
Bonaire - Karpata

Part of the regional summary: Bonaire
More about this place: Bonaire on Wikipedia
More info
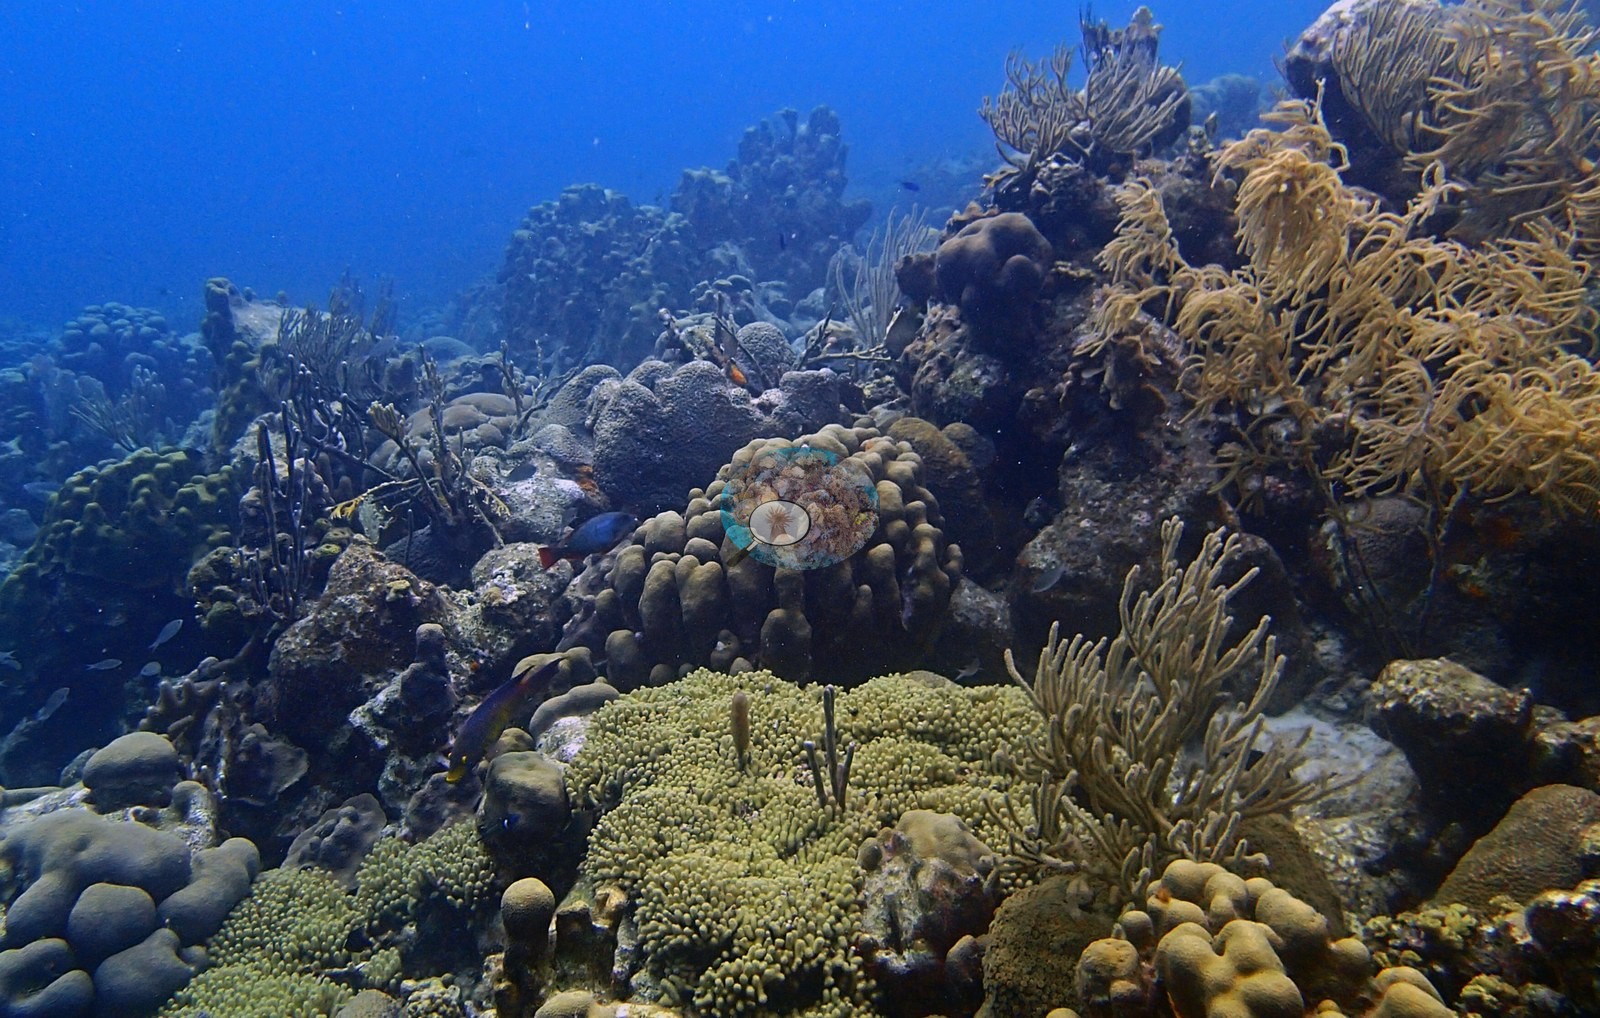
Aruba, Curacao, and Bonaire (NOAA CRW virtual station)A shore dive down a concrete stairway on Bonaire's northwest coast onto an unbroken carpet of boulder star coral, with living elkhorn coral in the shallows, a resting hawksbill turtle, and dense schools of sergeant majors and chromis. Most colonies are well pigmented, though one large brain coral shows extensive old partial die-off.
Een kantduik via een betonnen trap aan de noordwestkust van Bonaire, die uitkomt op een ononderbroken tapijt van sterkoraal (boulder star coral), met levend elandsgeweikoraal in het ondiepe water, een rustende karetschildpad en dichte scholen sergeant-majoorvissen en chromissen. De meeste kolonies zijn goed gepigmenteerd, al vertoont één groot hersenkoraal uitgebreide, oude gedeeltelijke afsterving.
AI translation of this summary; the English is authoritative.
Ten independent survey stations shown with the program’s logo — click one to see how far it is from this site.
Two other CRD dive sites with their own pages within 5 km shown in orange — click a marker to open its page.
6 of the 42 photographs on this page are shown beside the text that discusses them under "Site description" below.
Site description
Setting
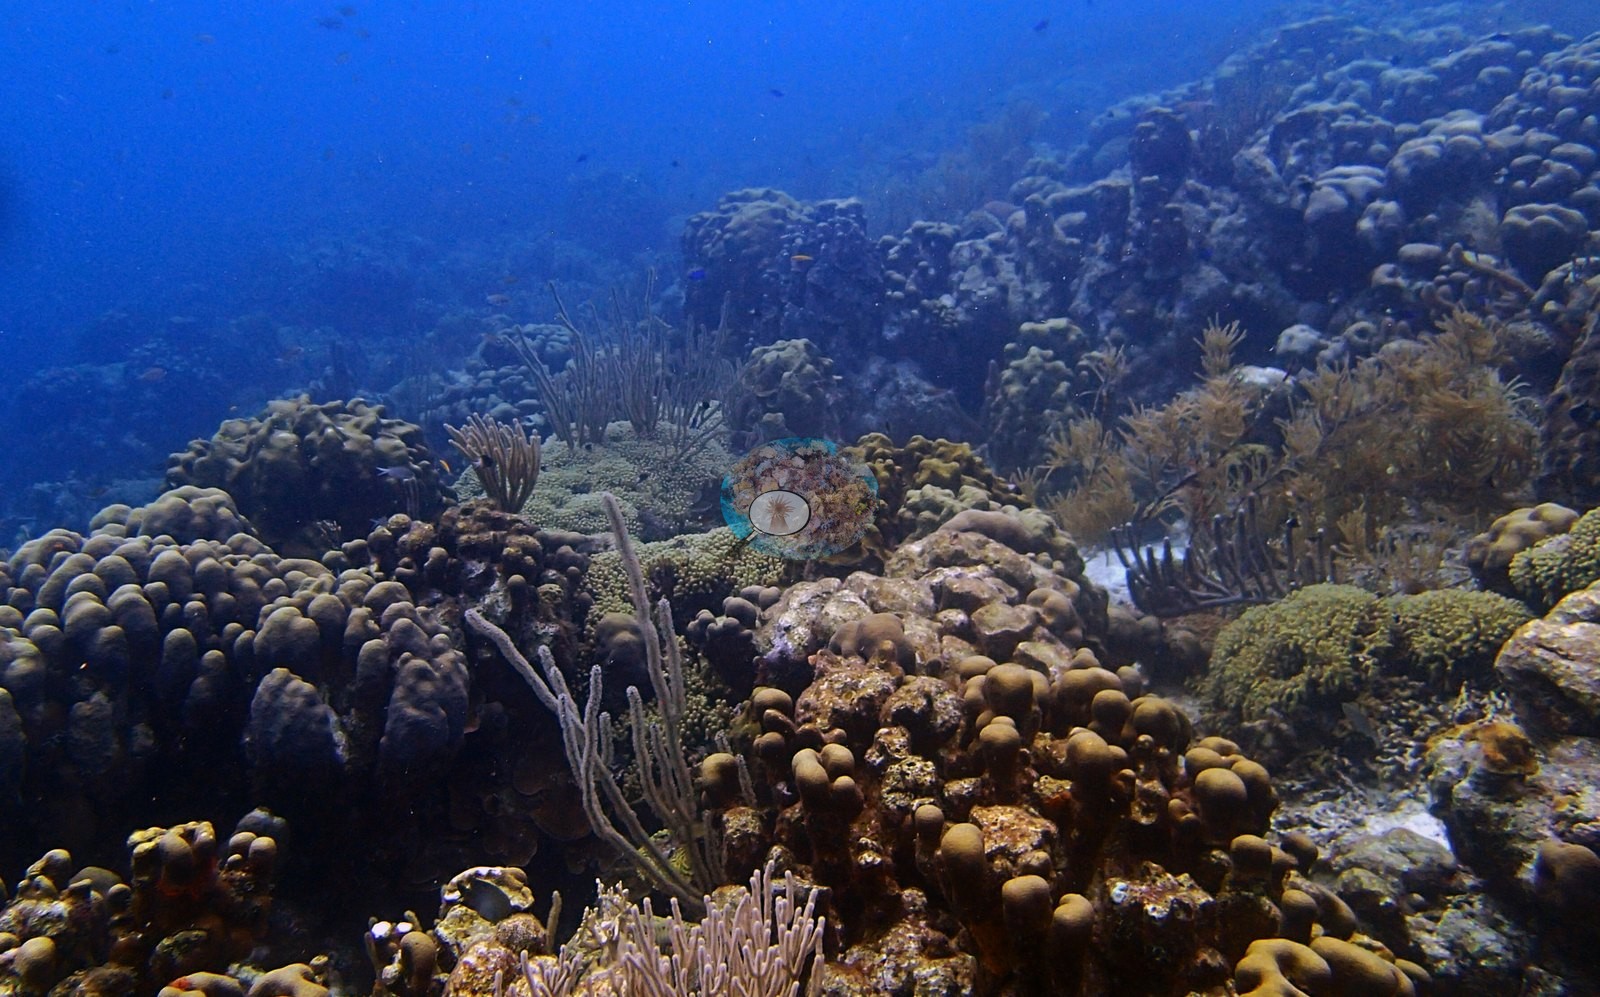
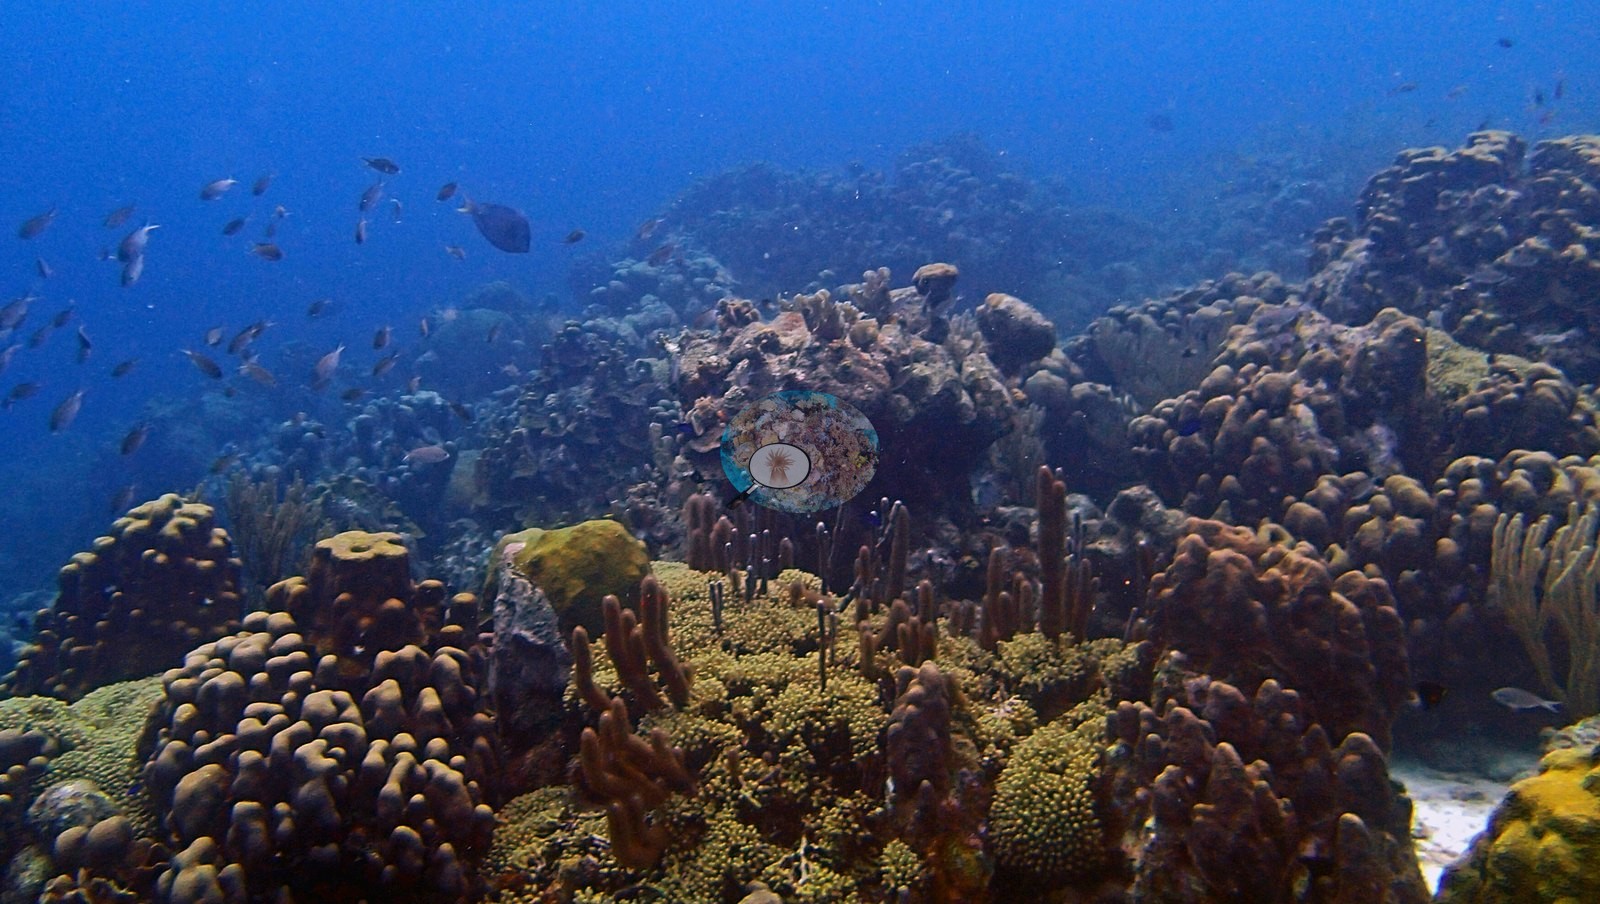
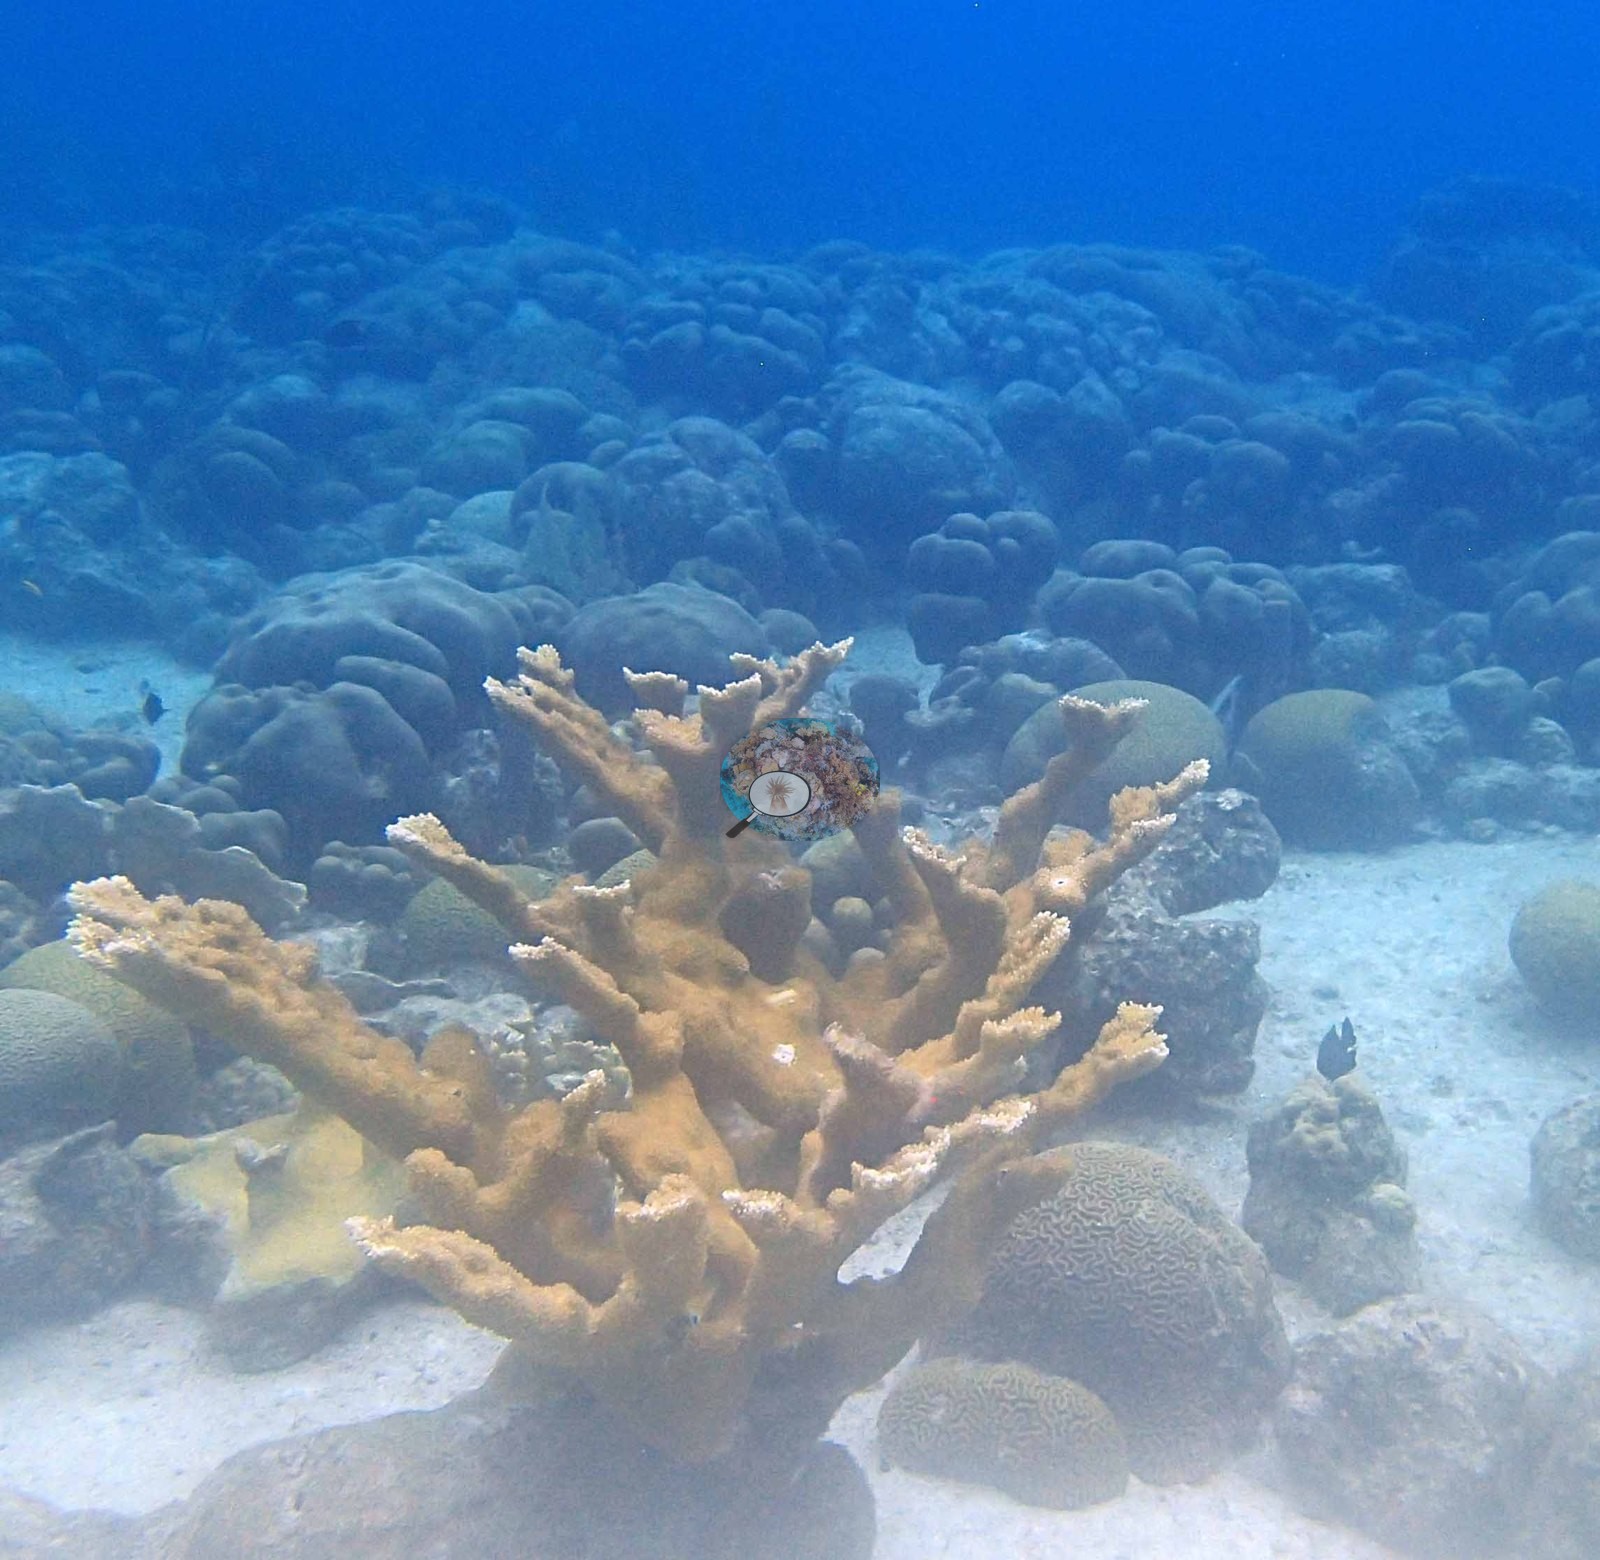
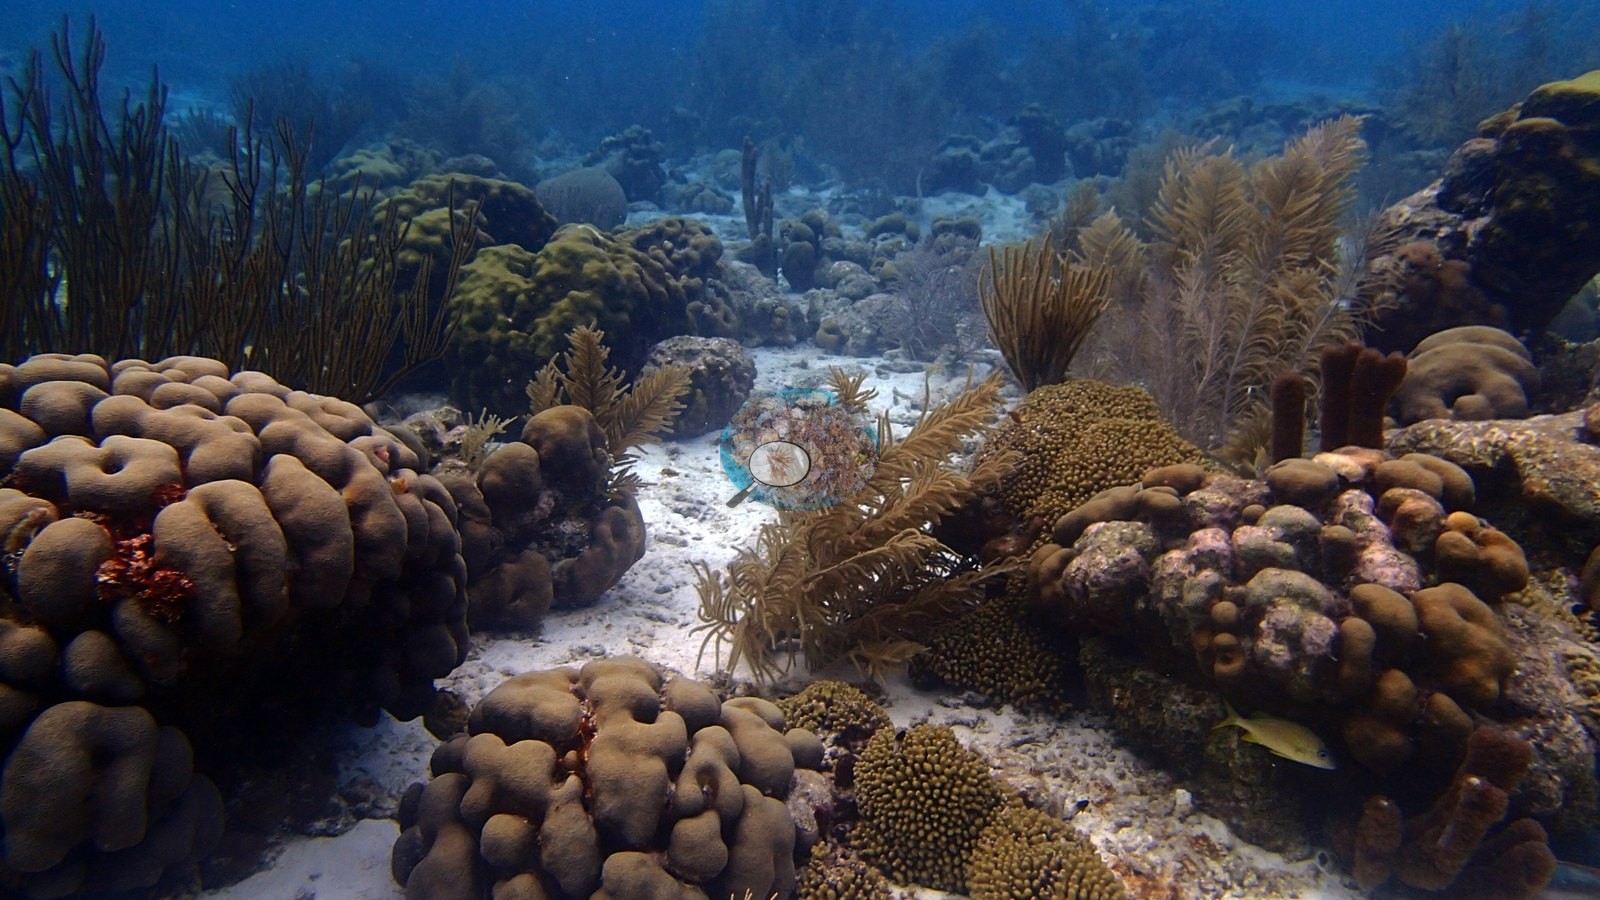
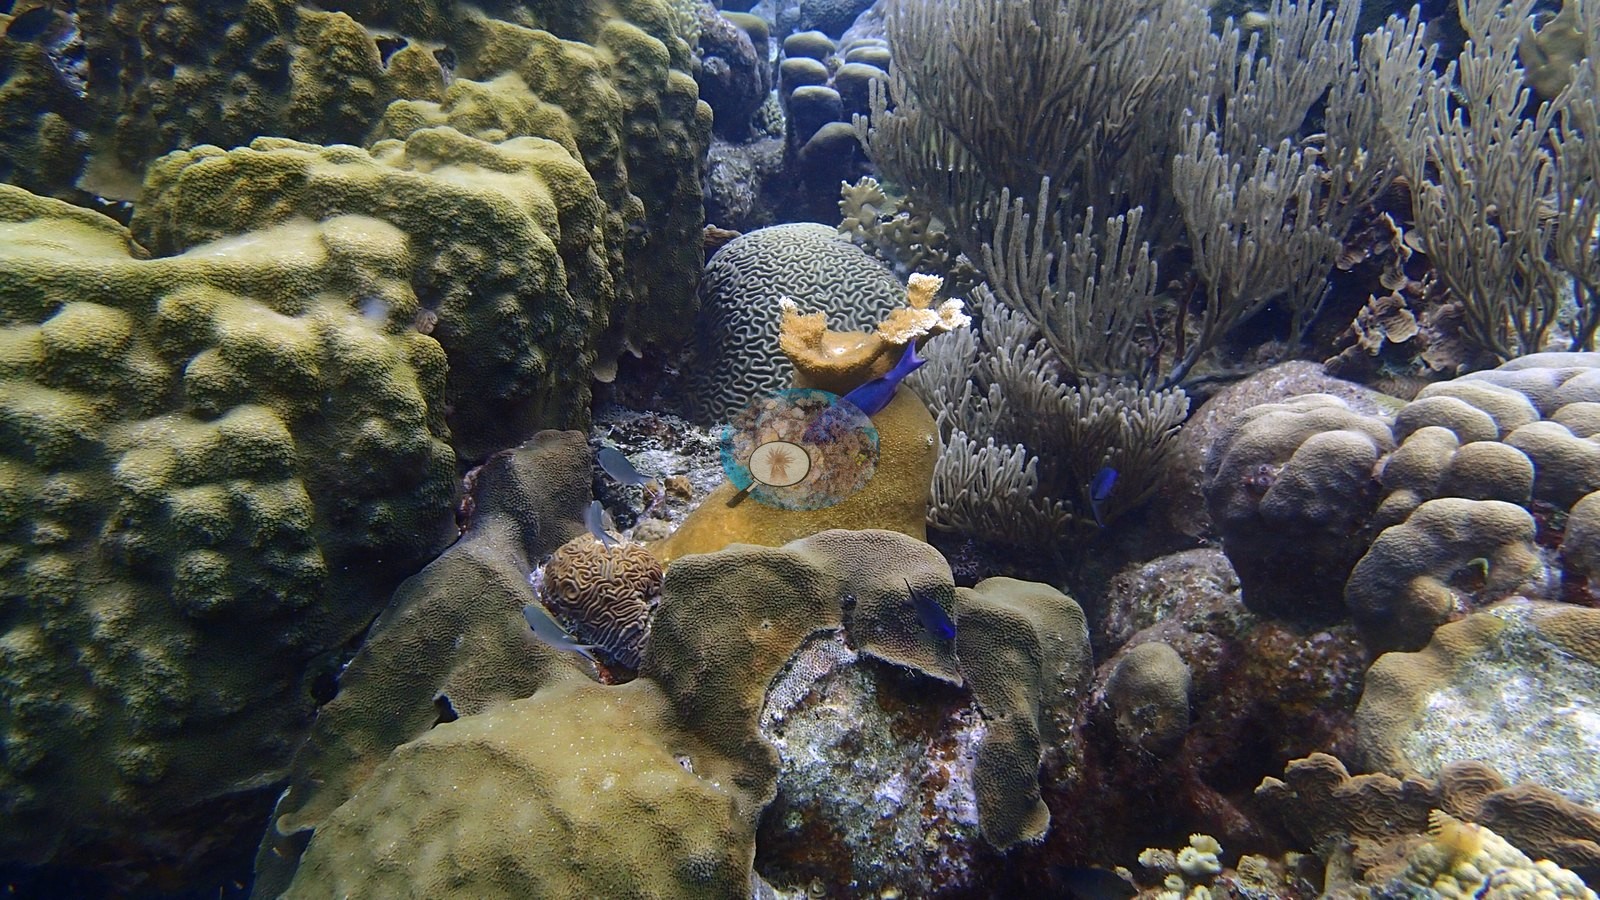
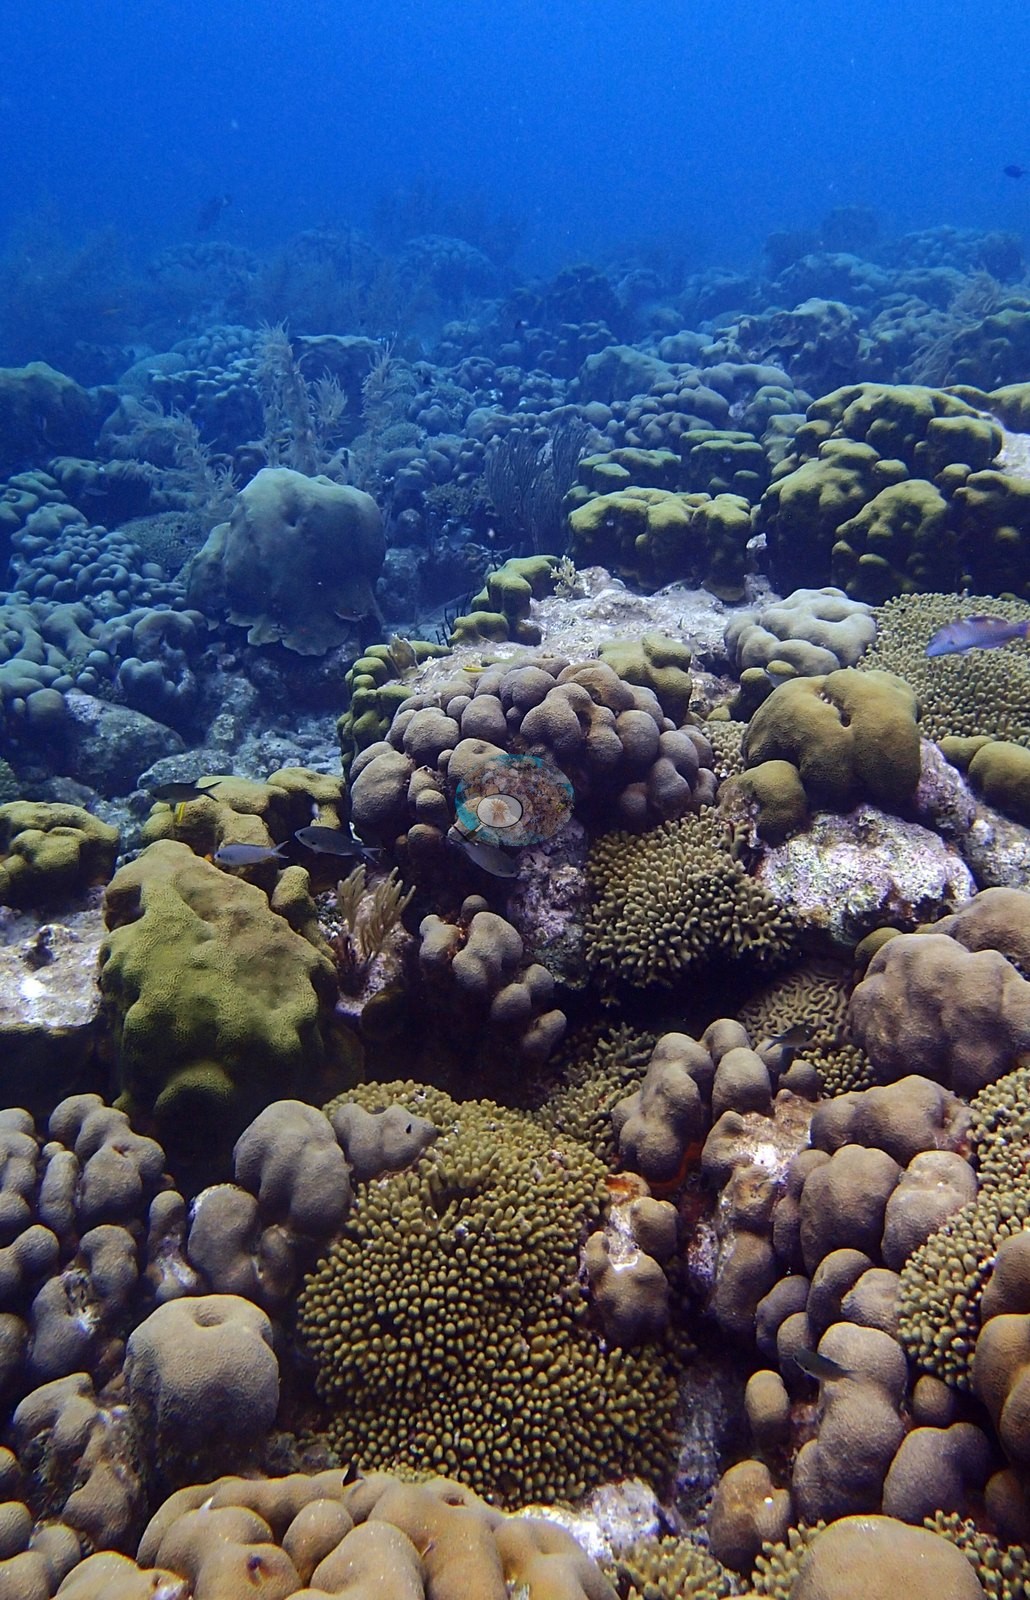
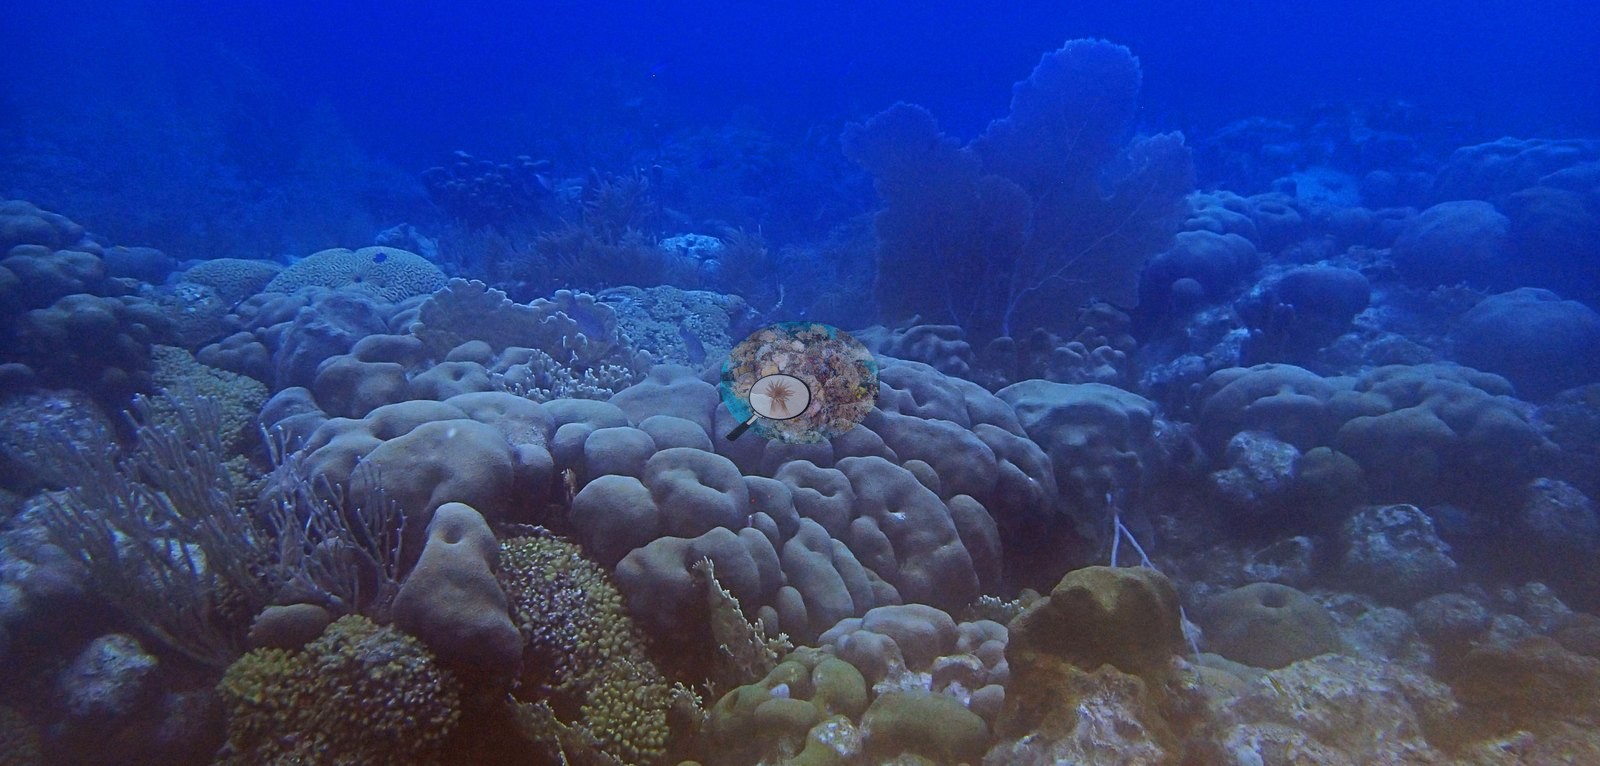
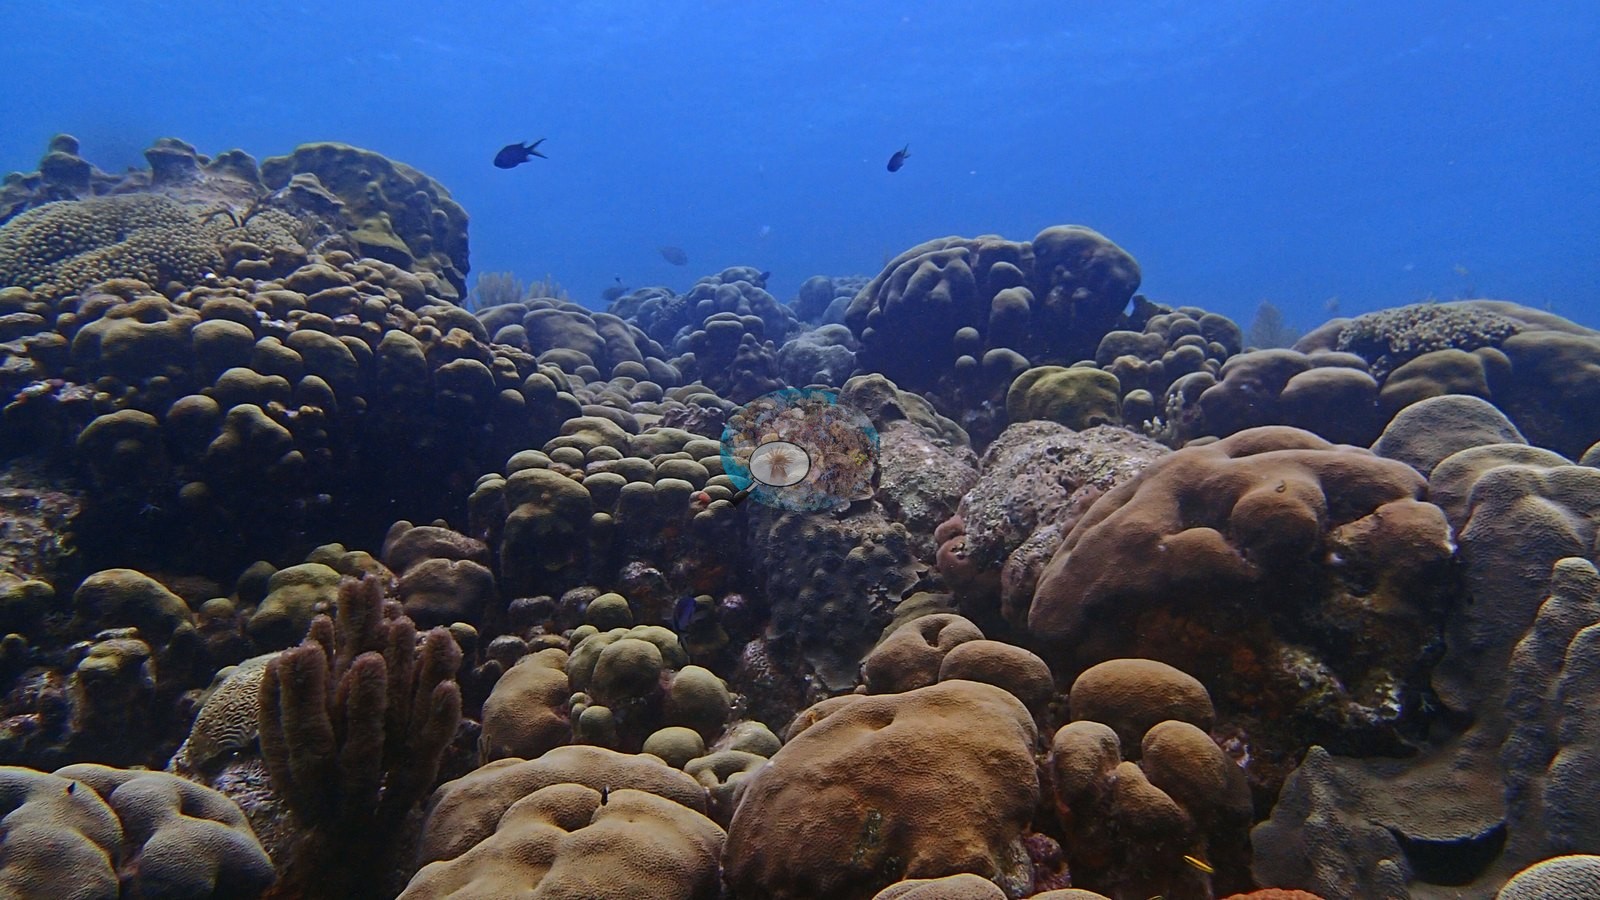
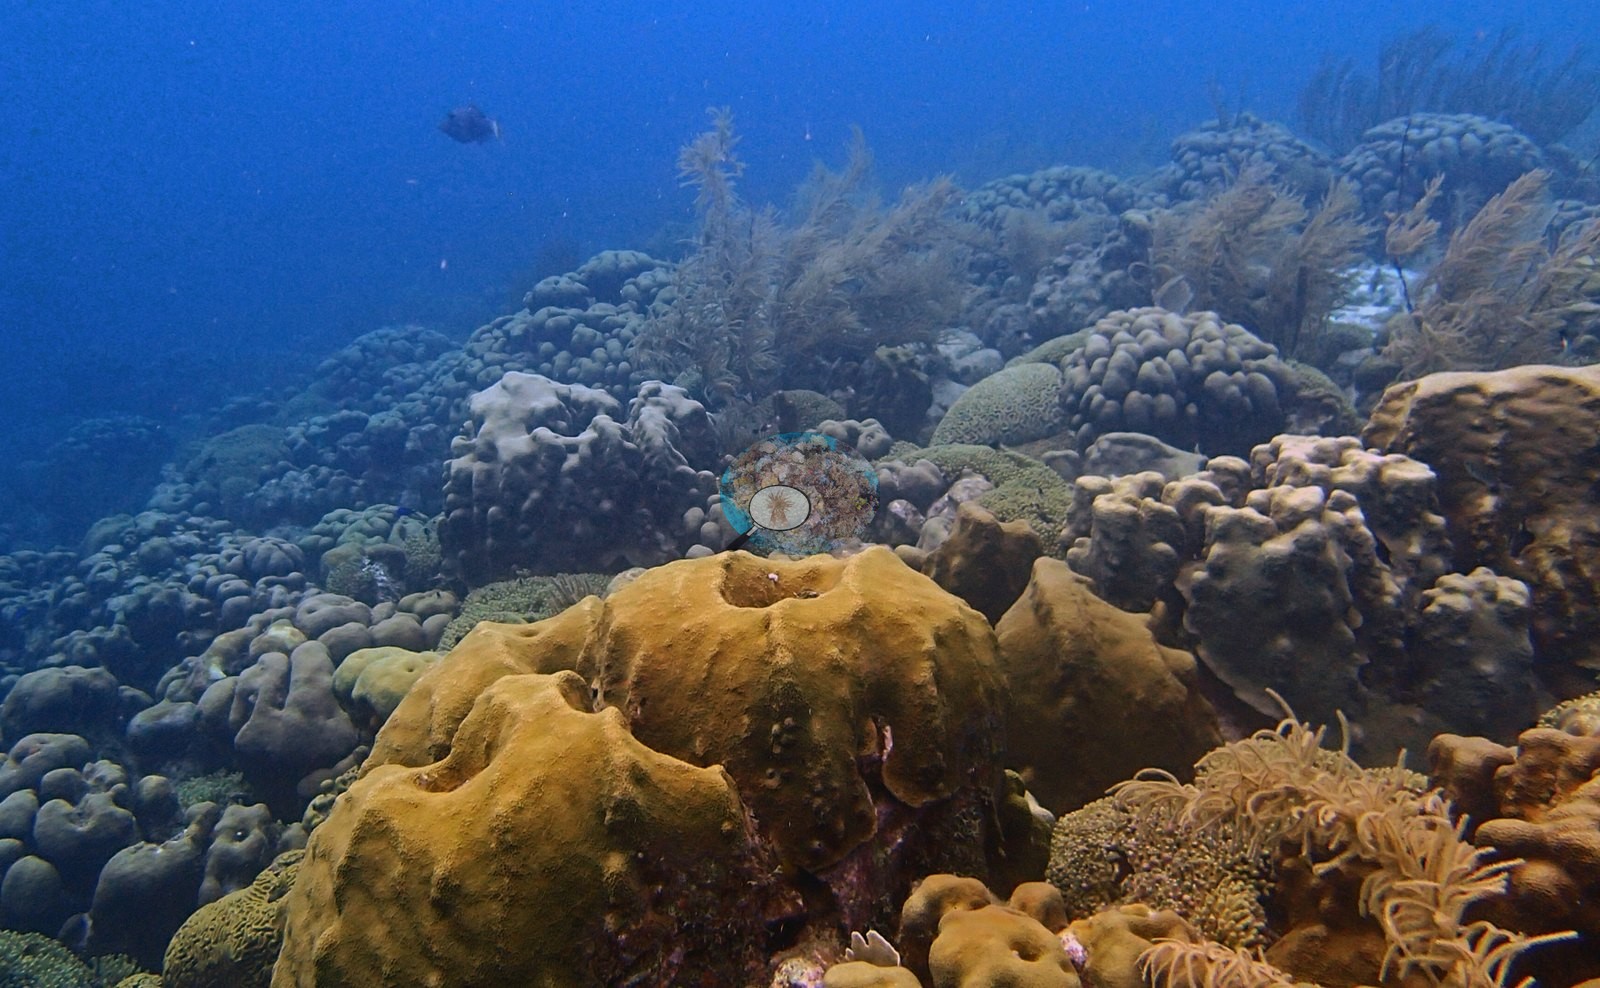
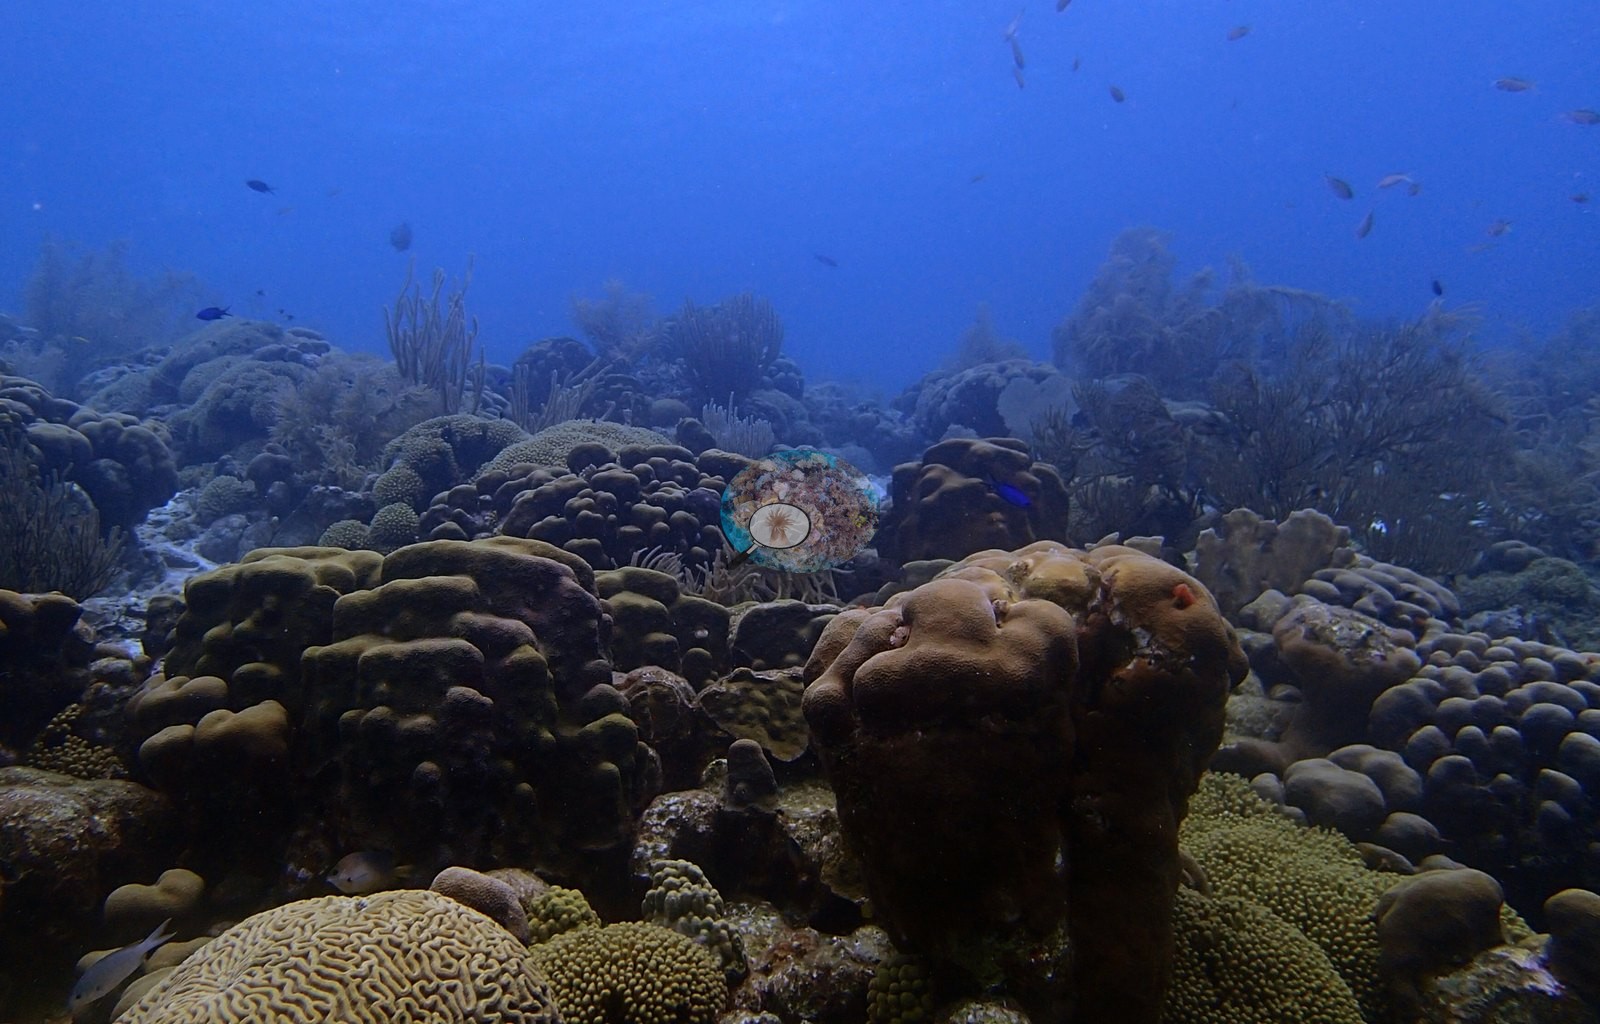
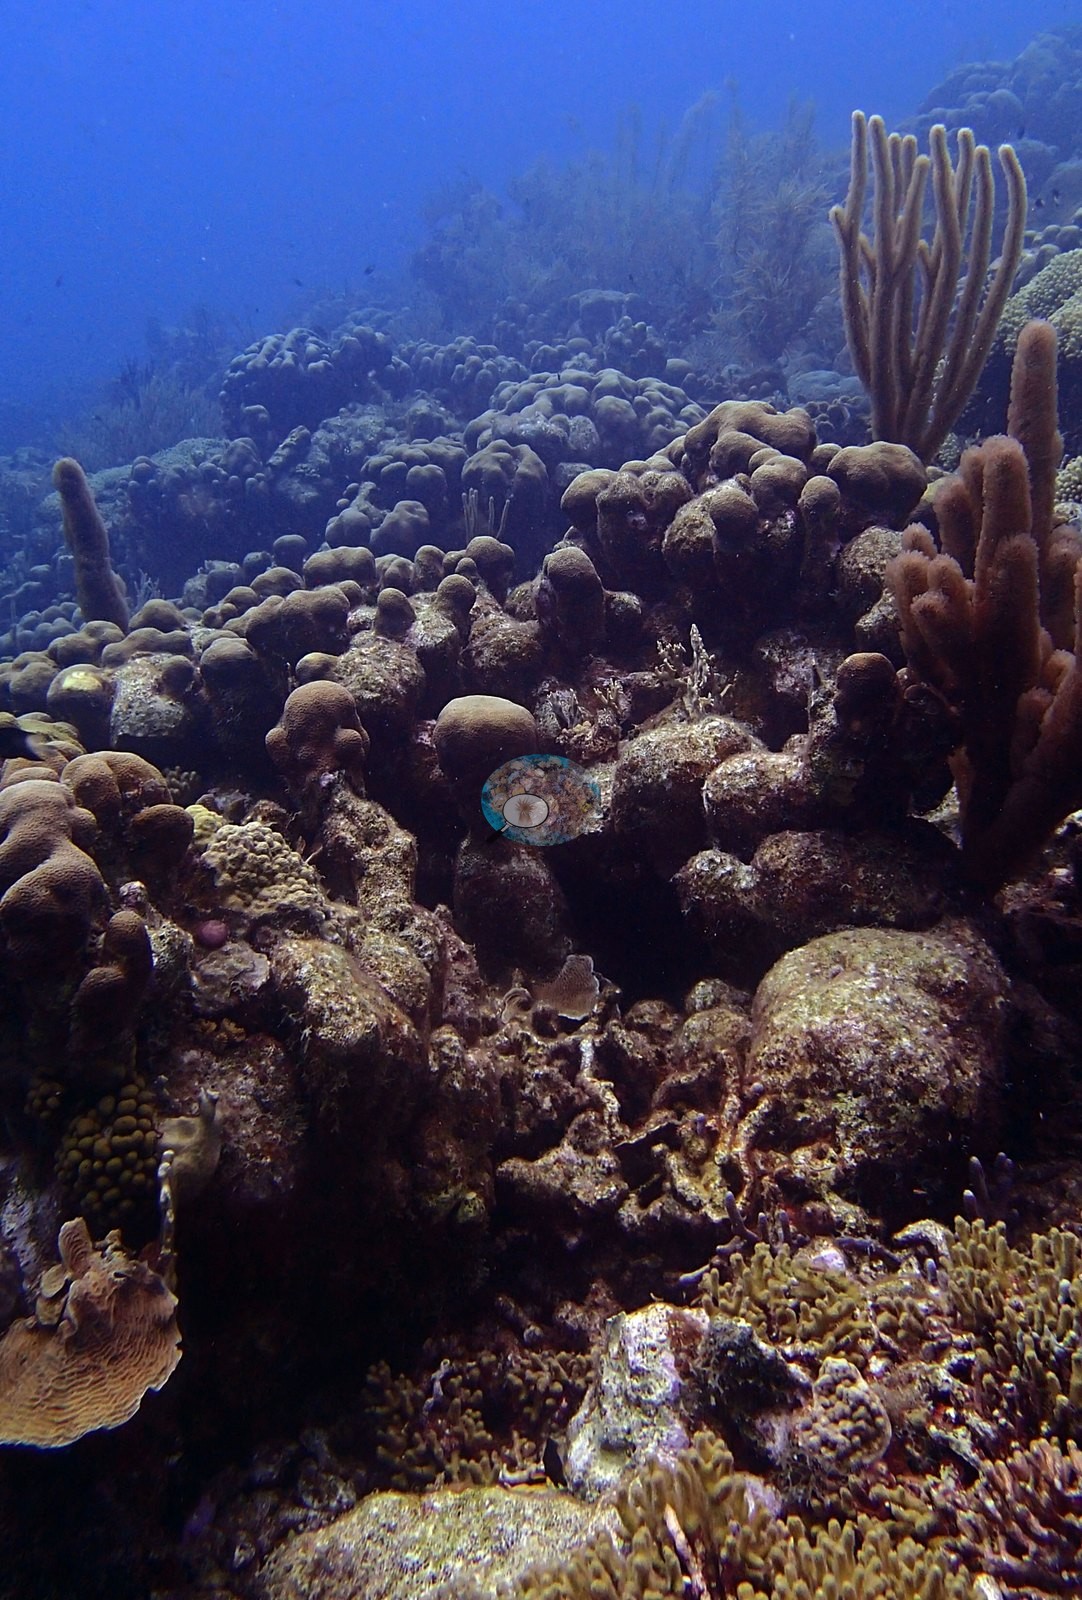
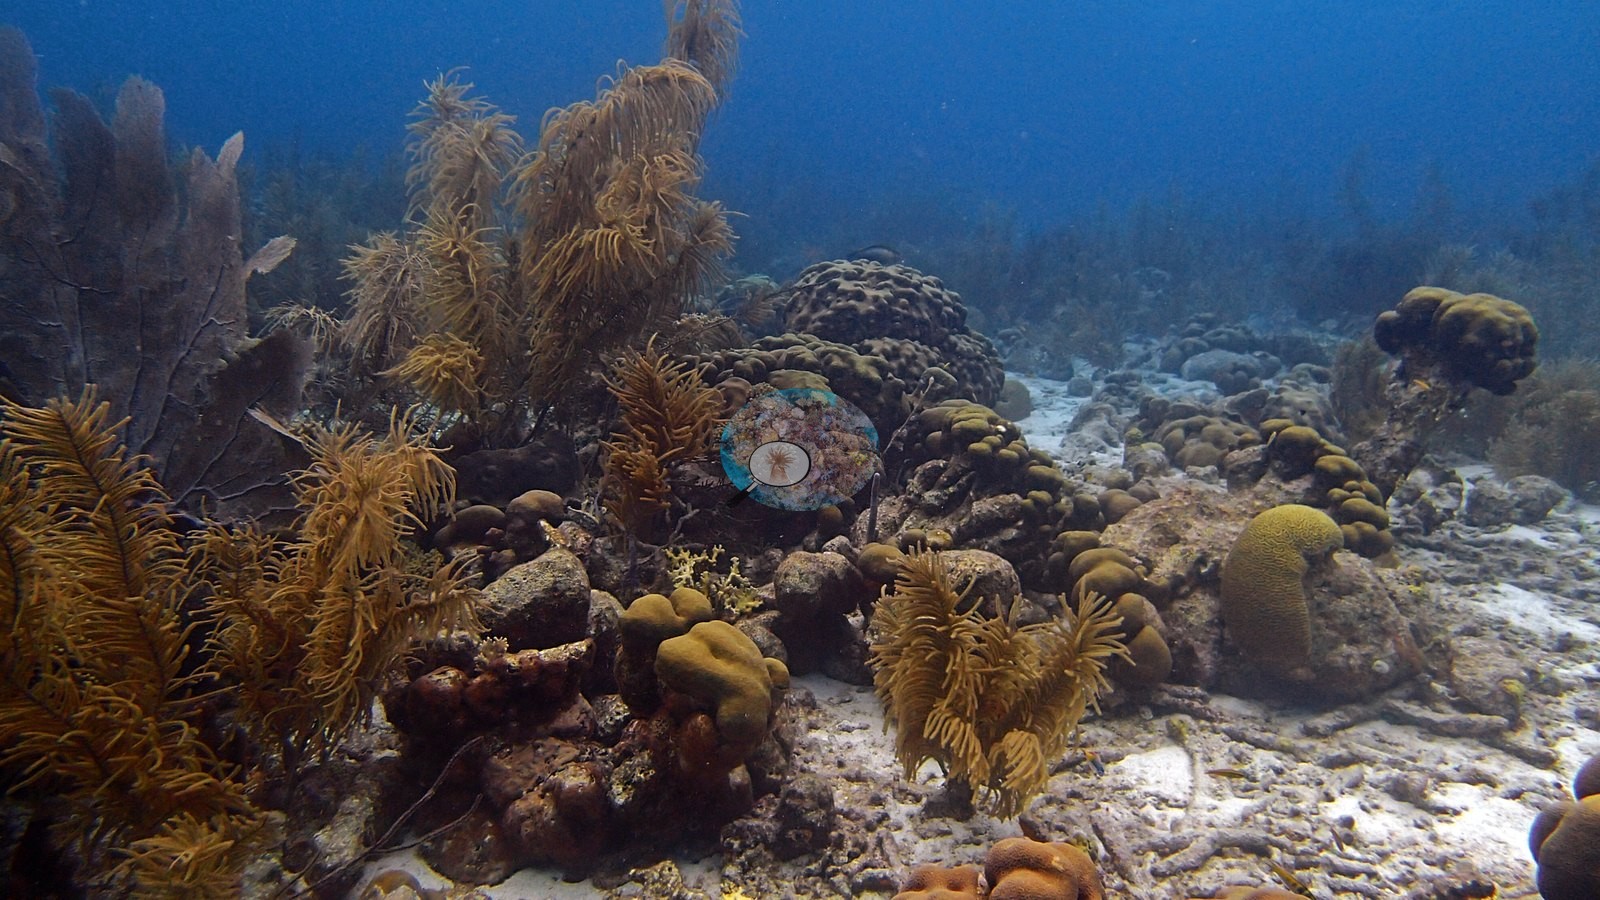
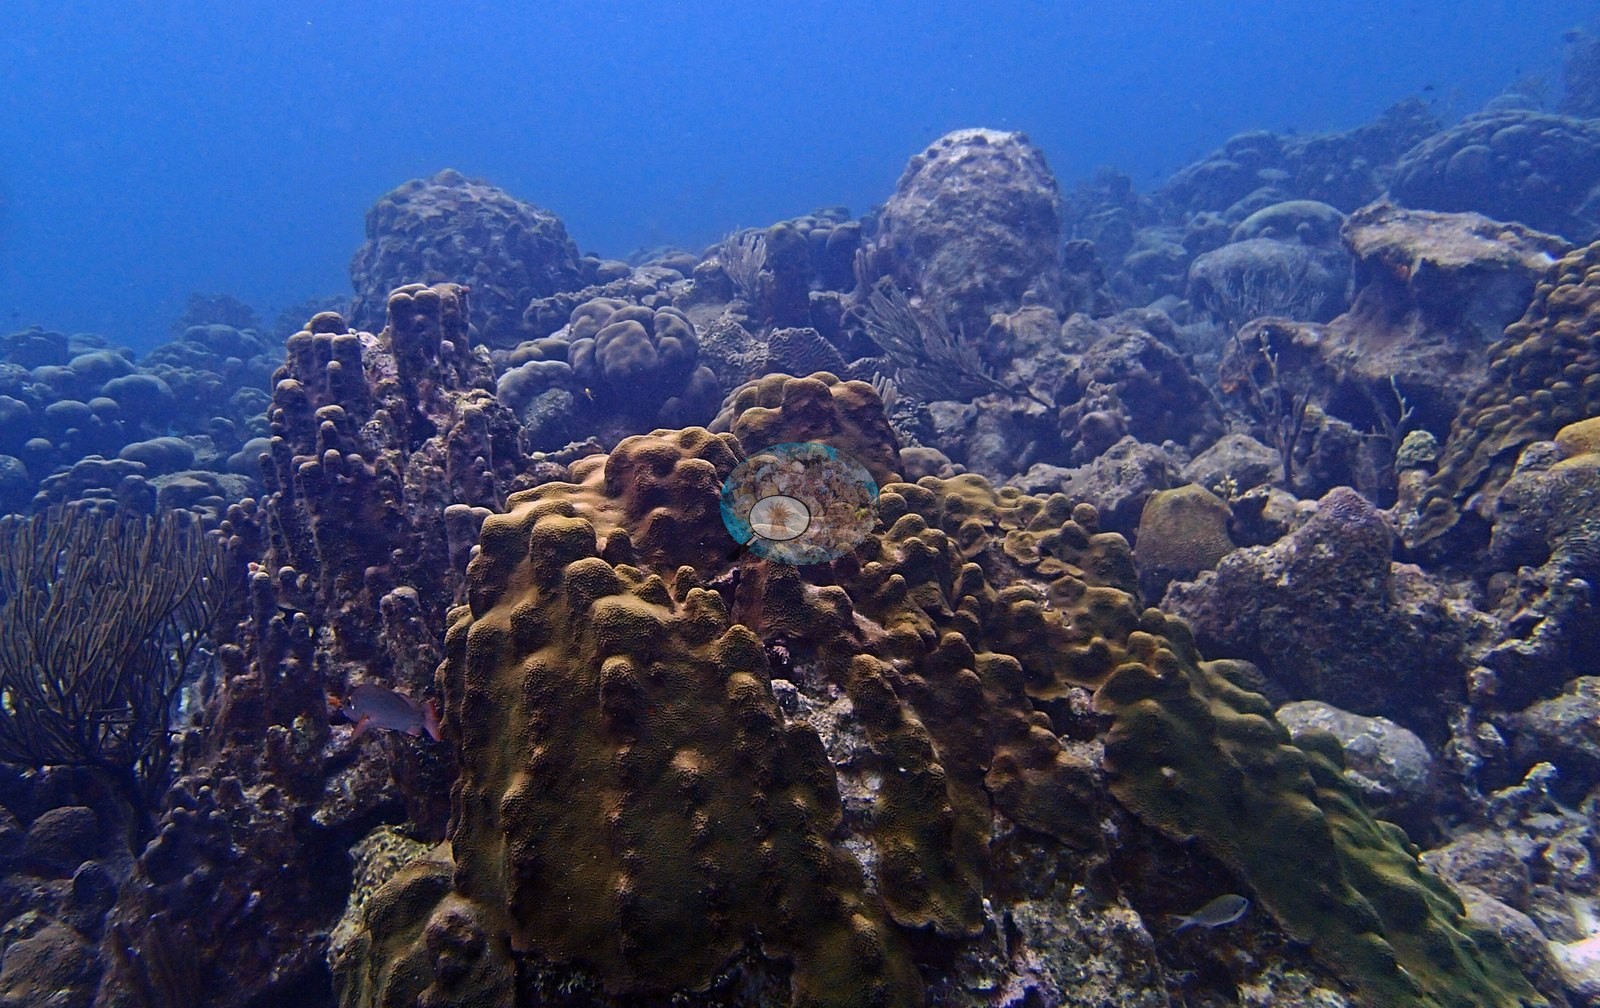
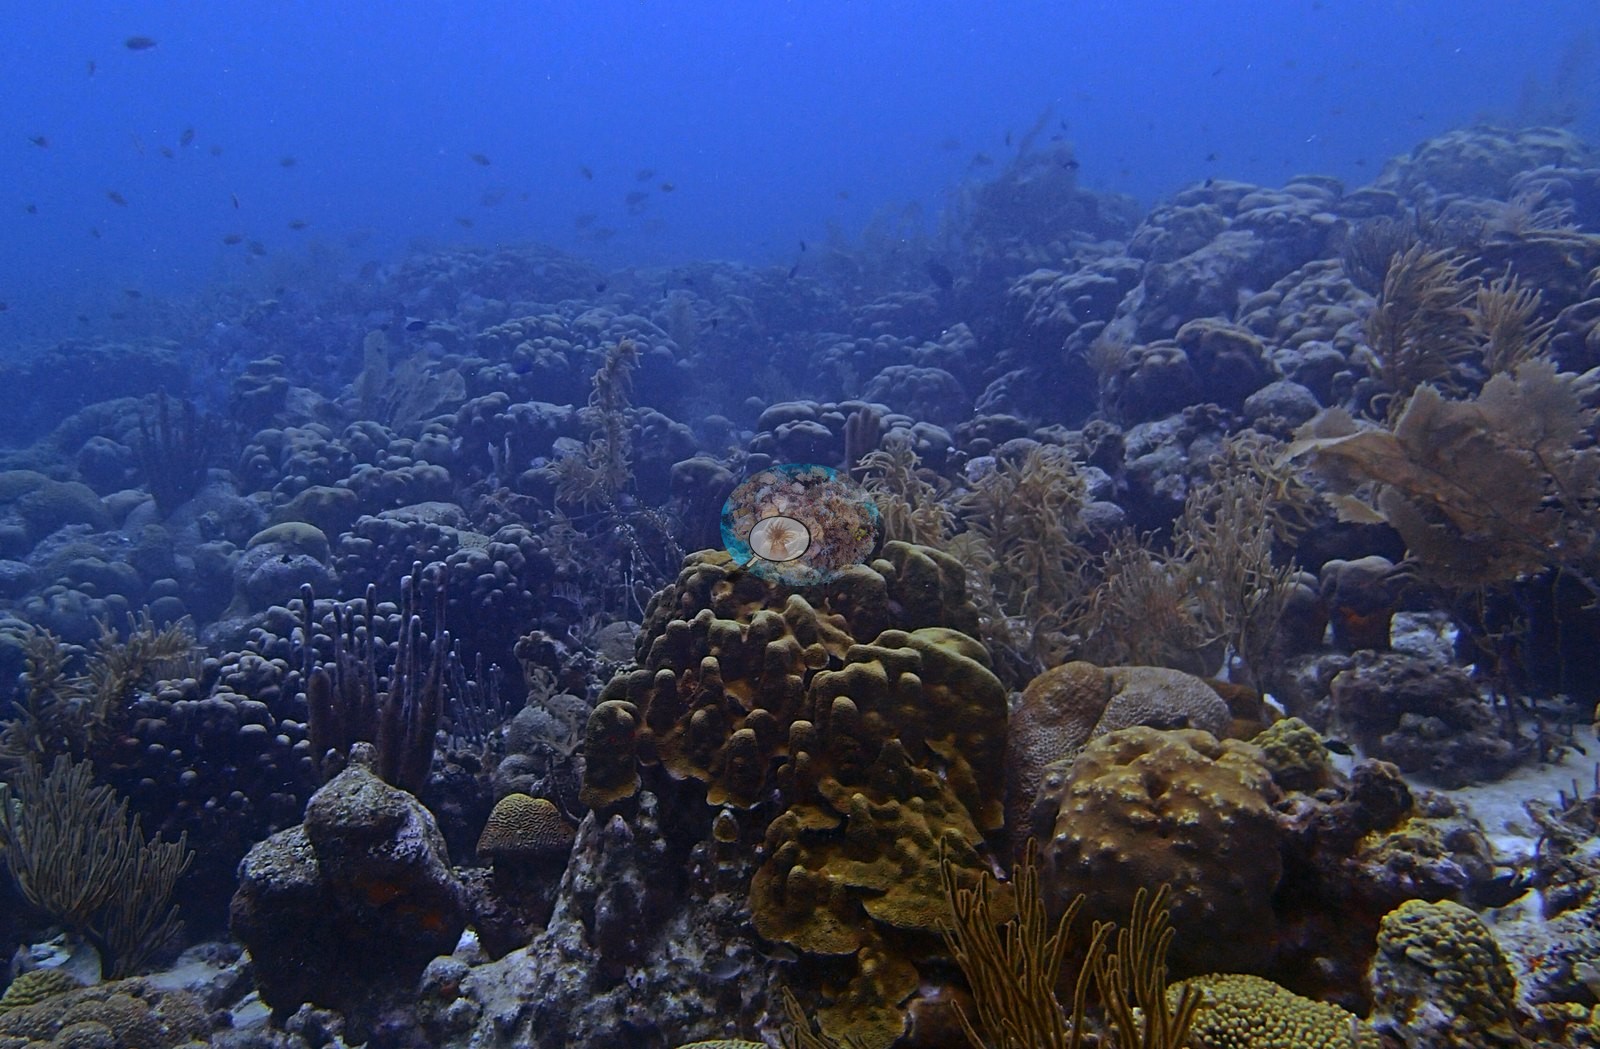
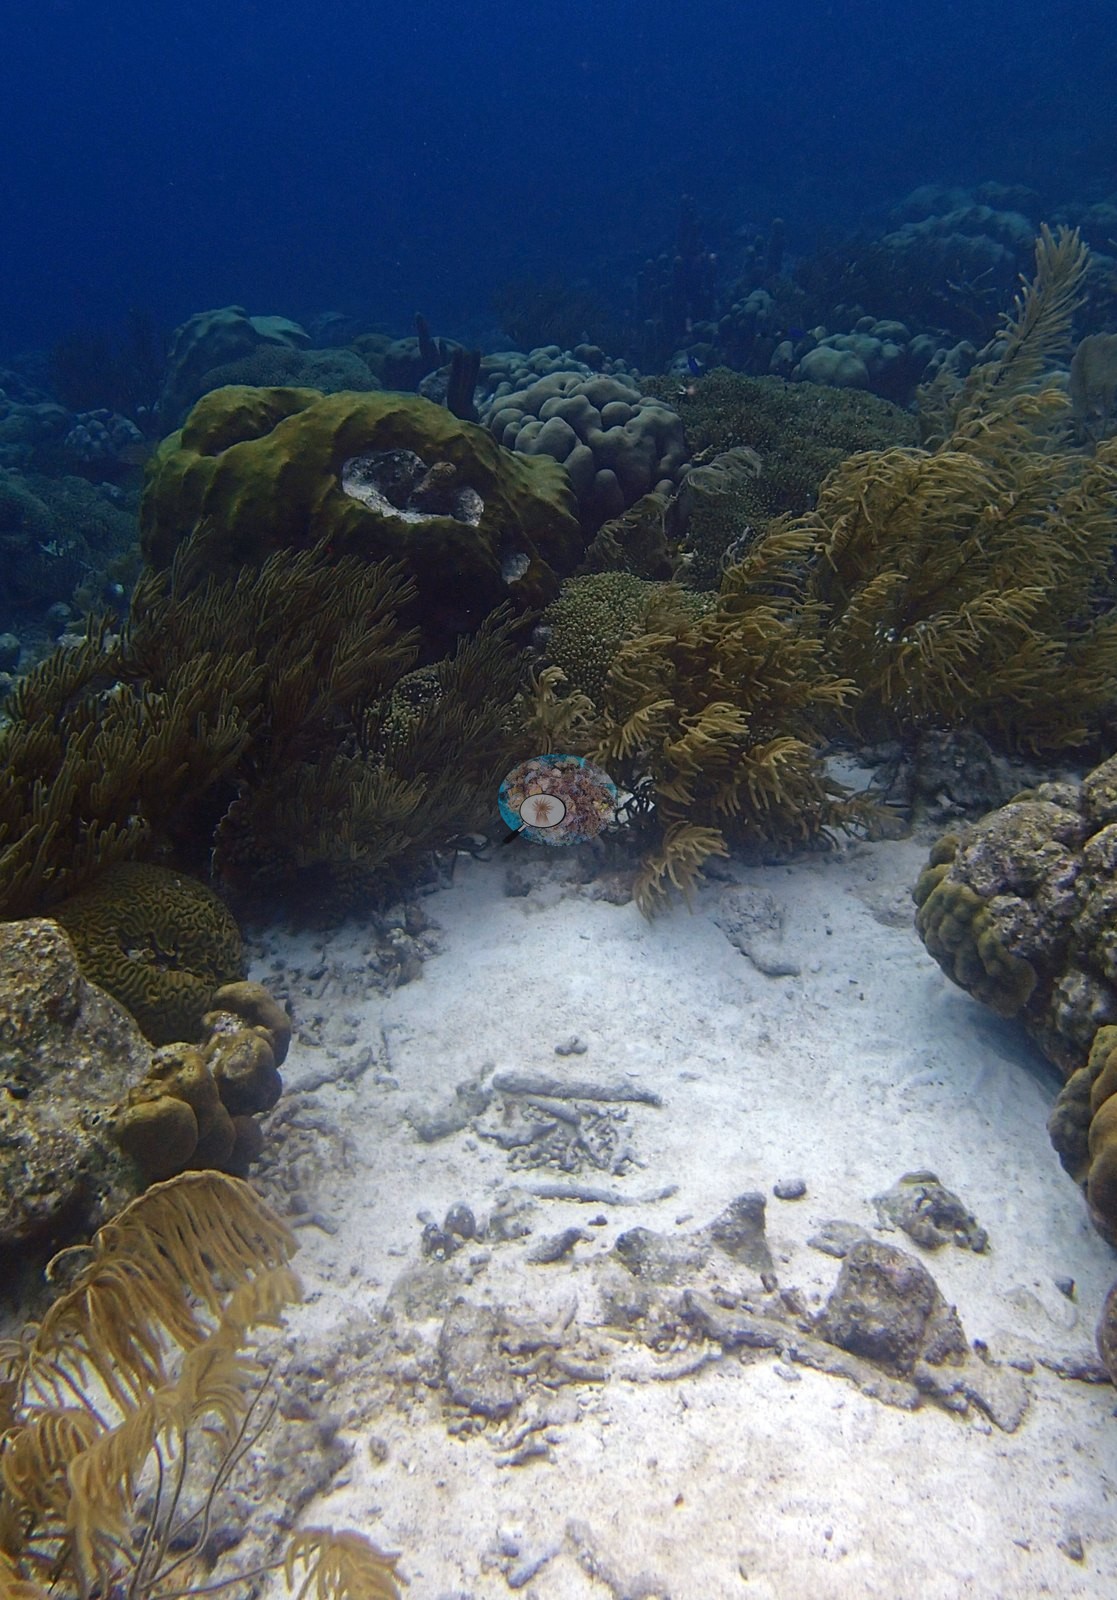
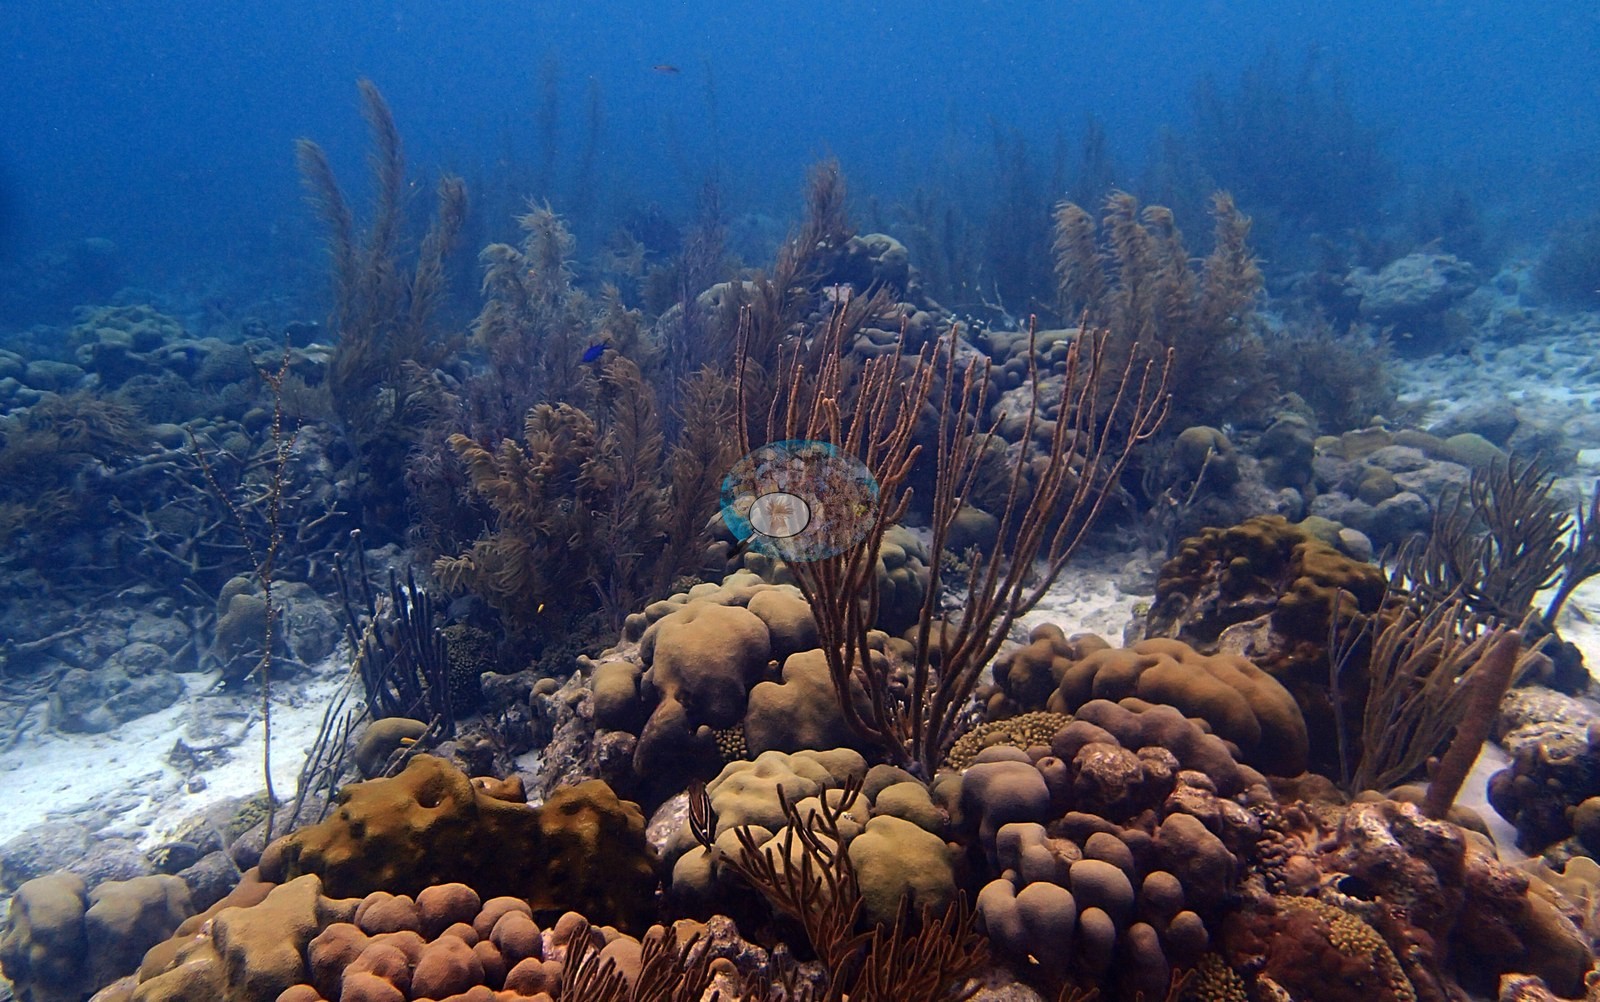
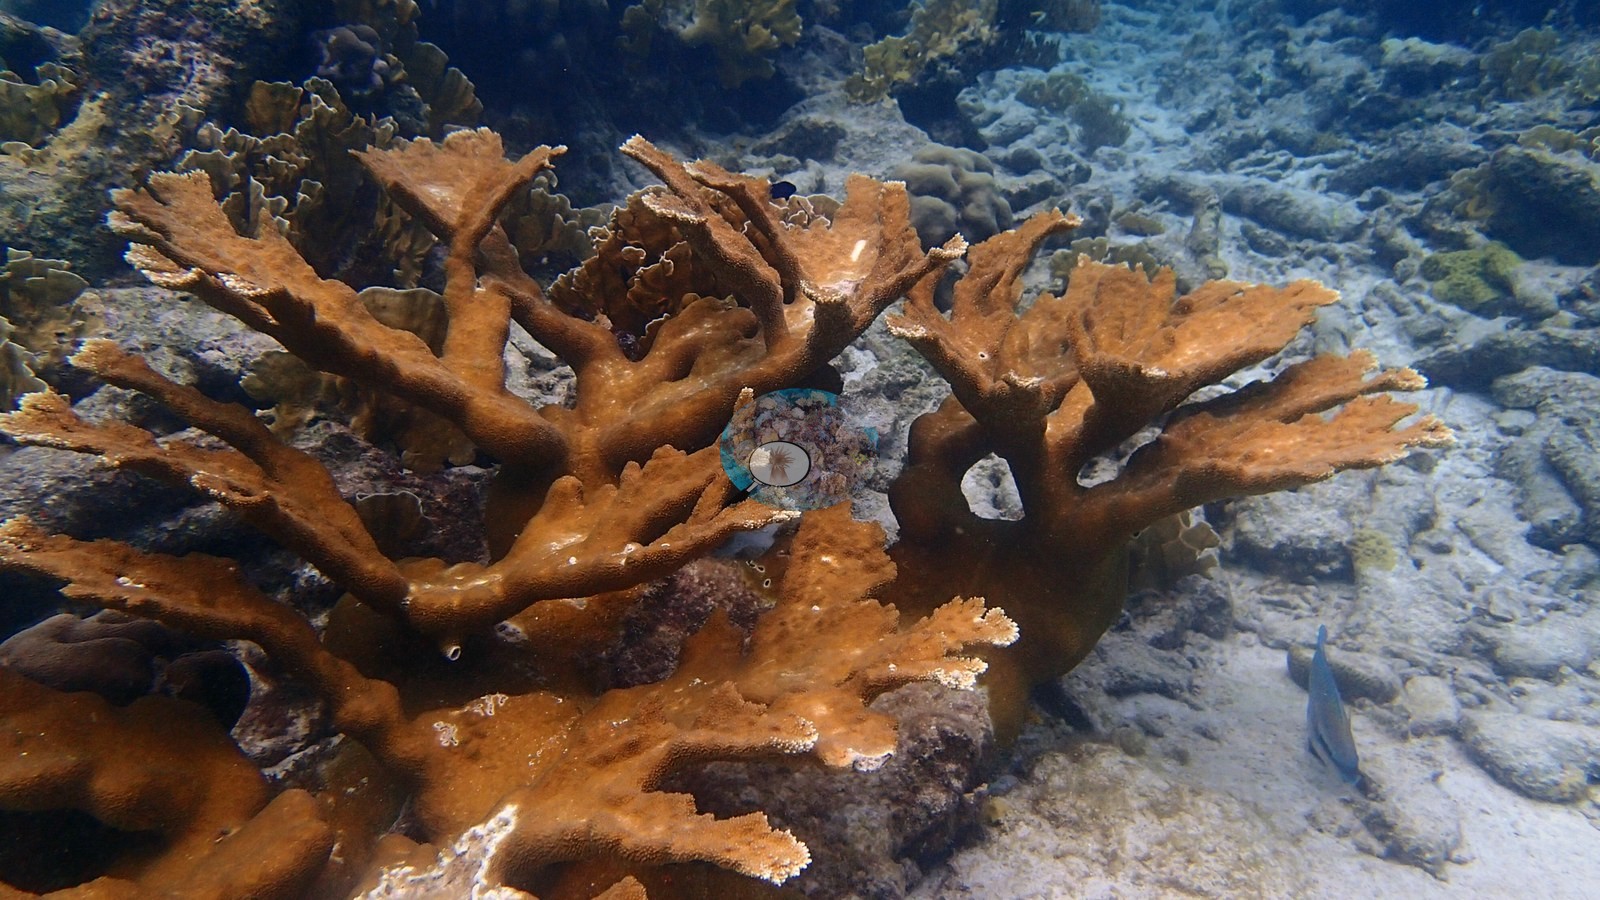
A shore dive down a concrete stairway on Bonaire's northwest coast, entering a slope built on an extensive, unbroken carpet of boulder star coral heads with patches of elkhorn coral in the shallows and gorgonian sea plumes scattered among the mounds (e.g., Image 4, Image 5).
General benthic features
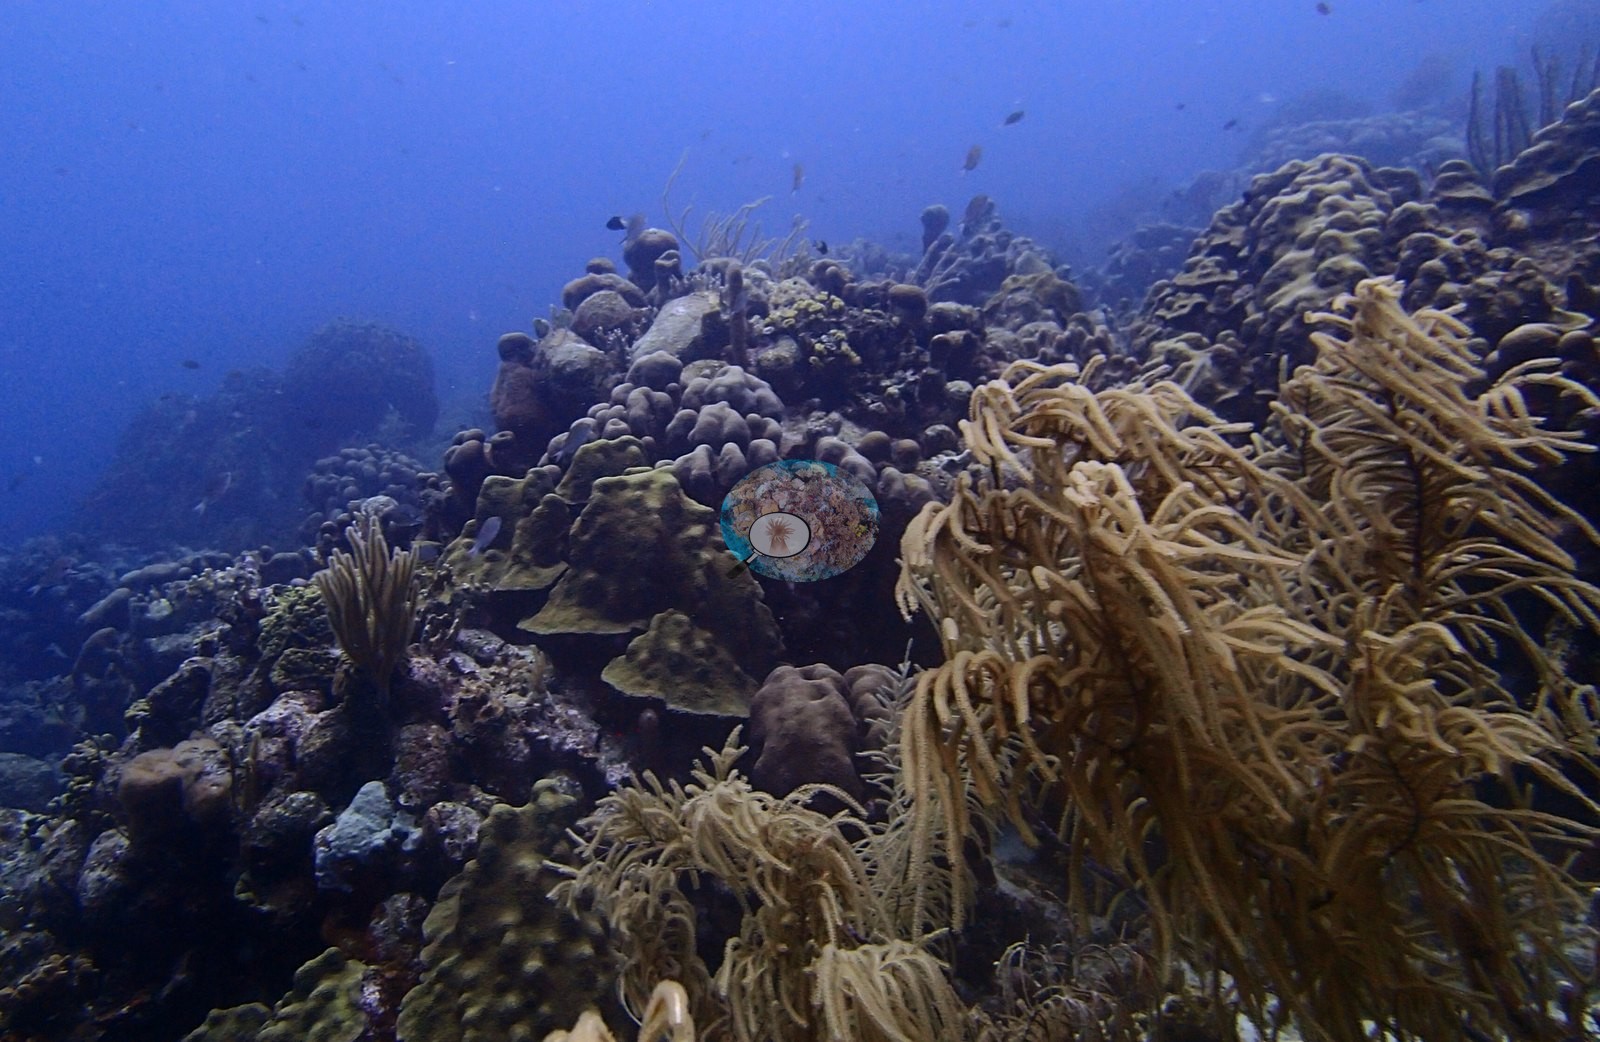
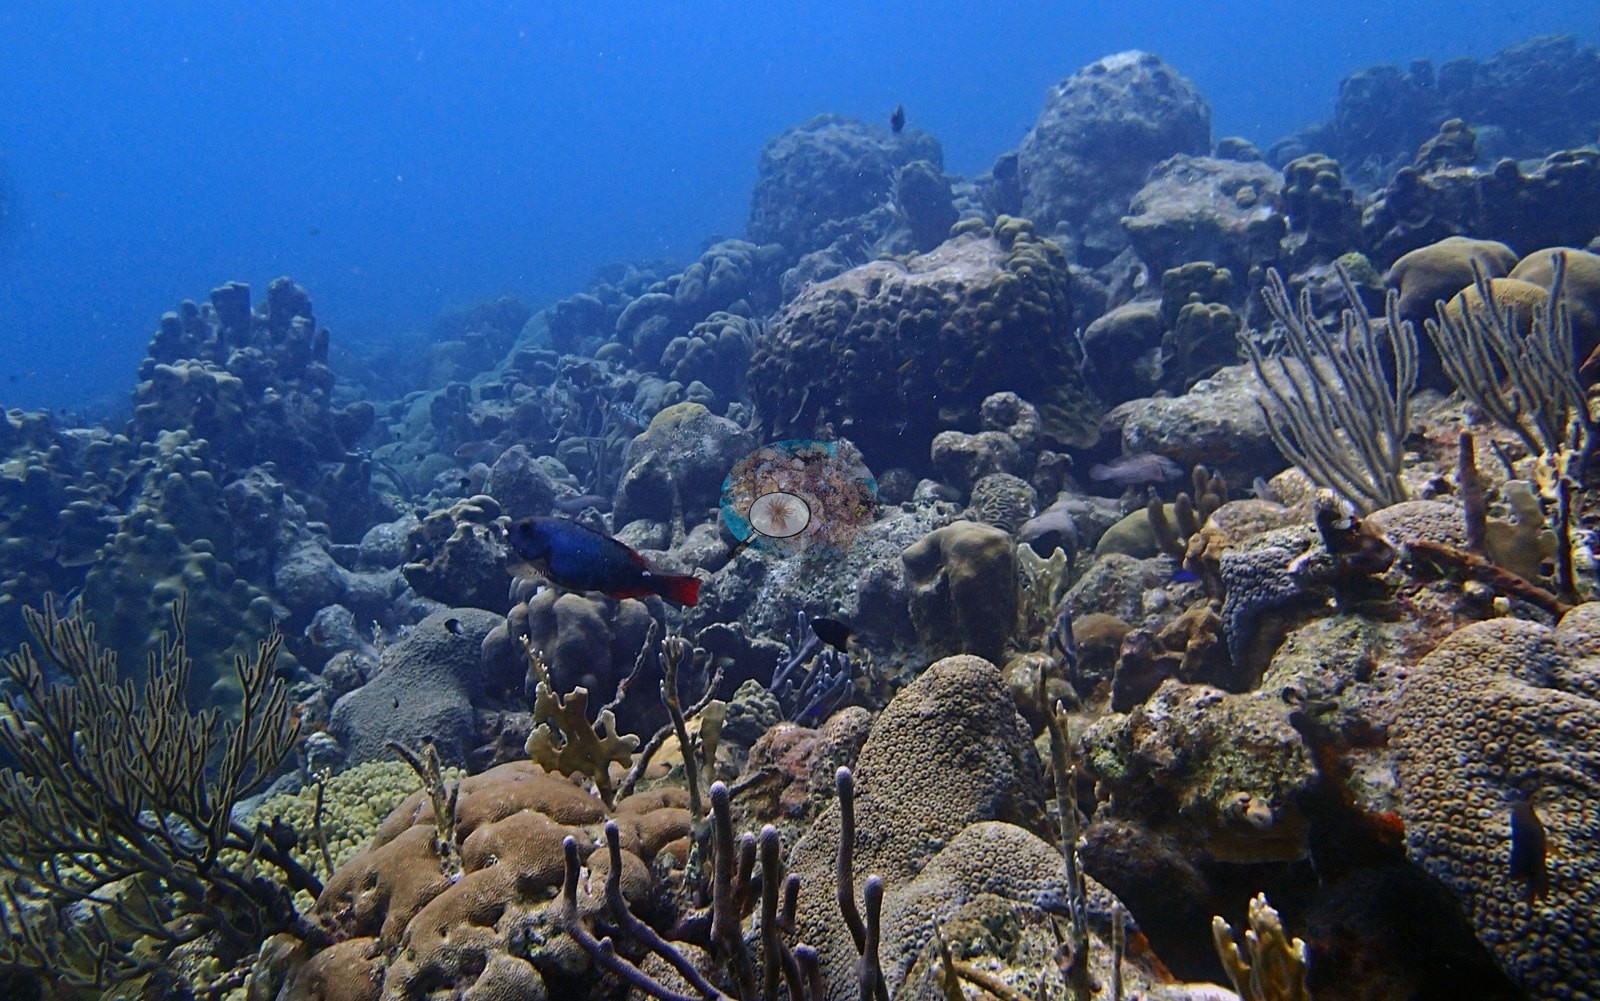
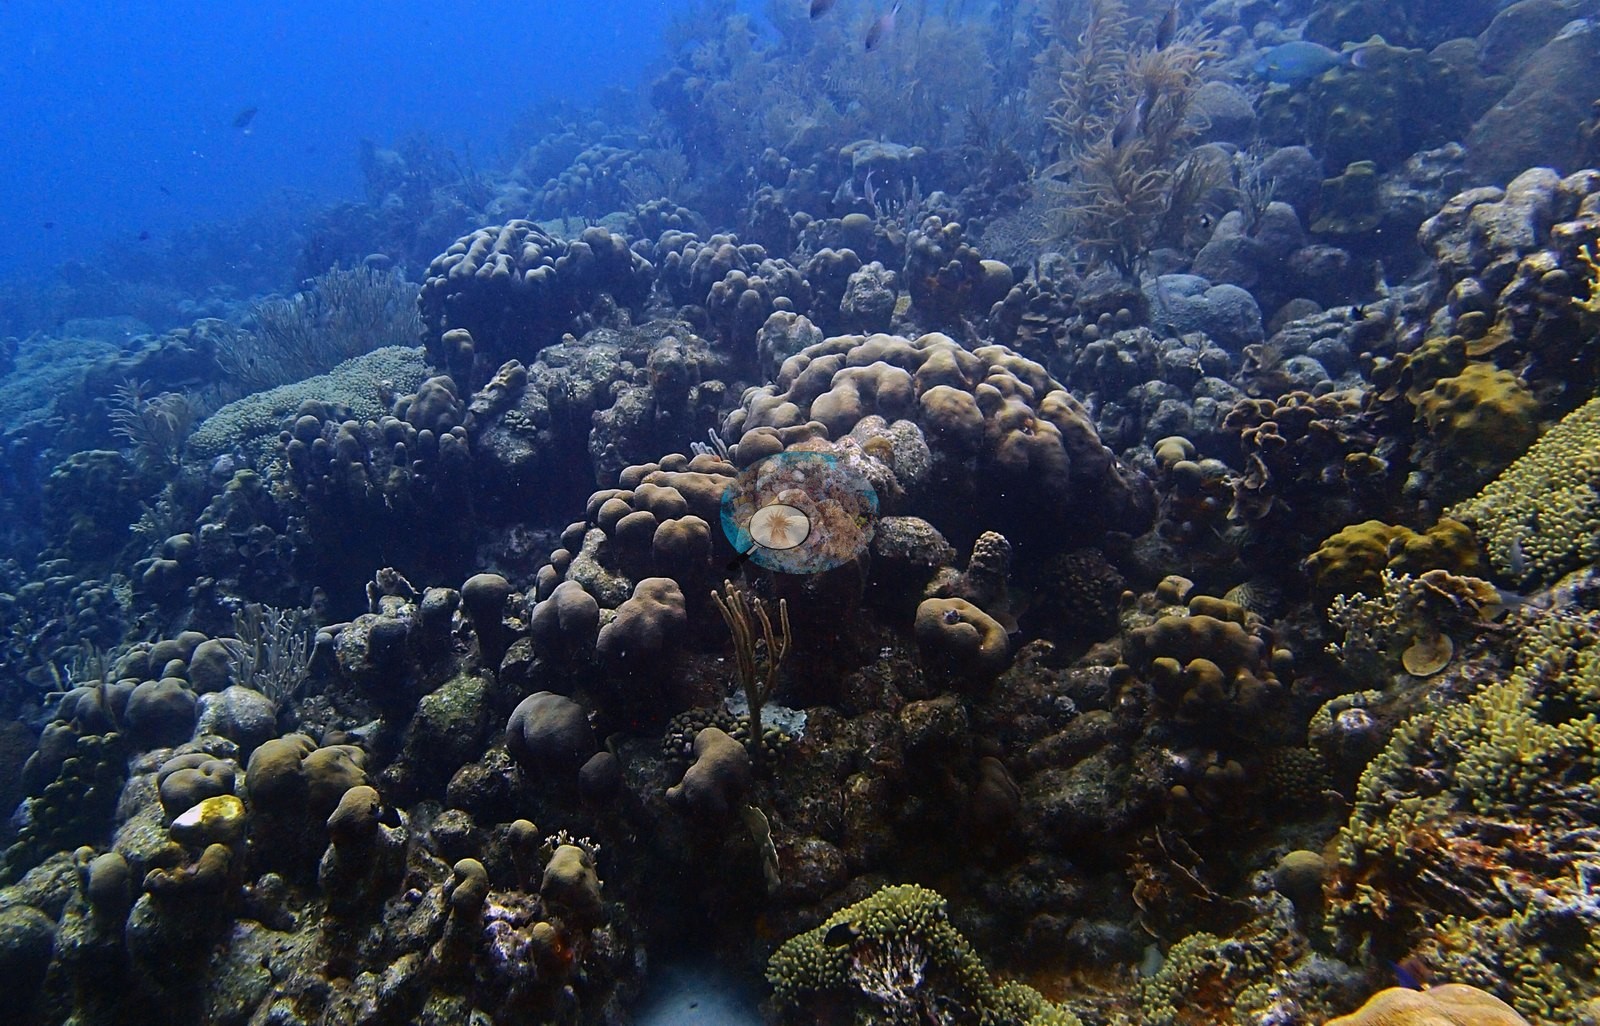
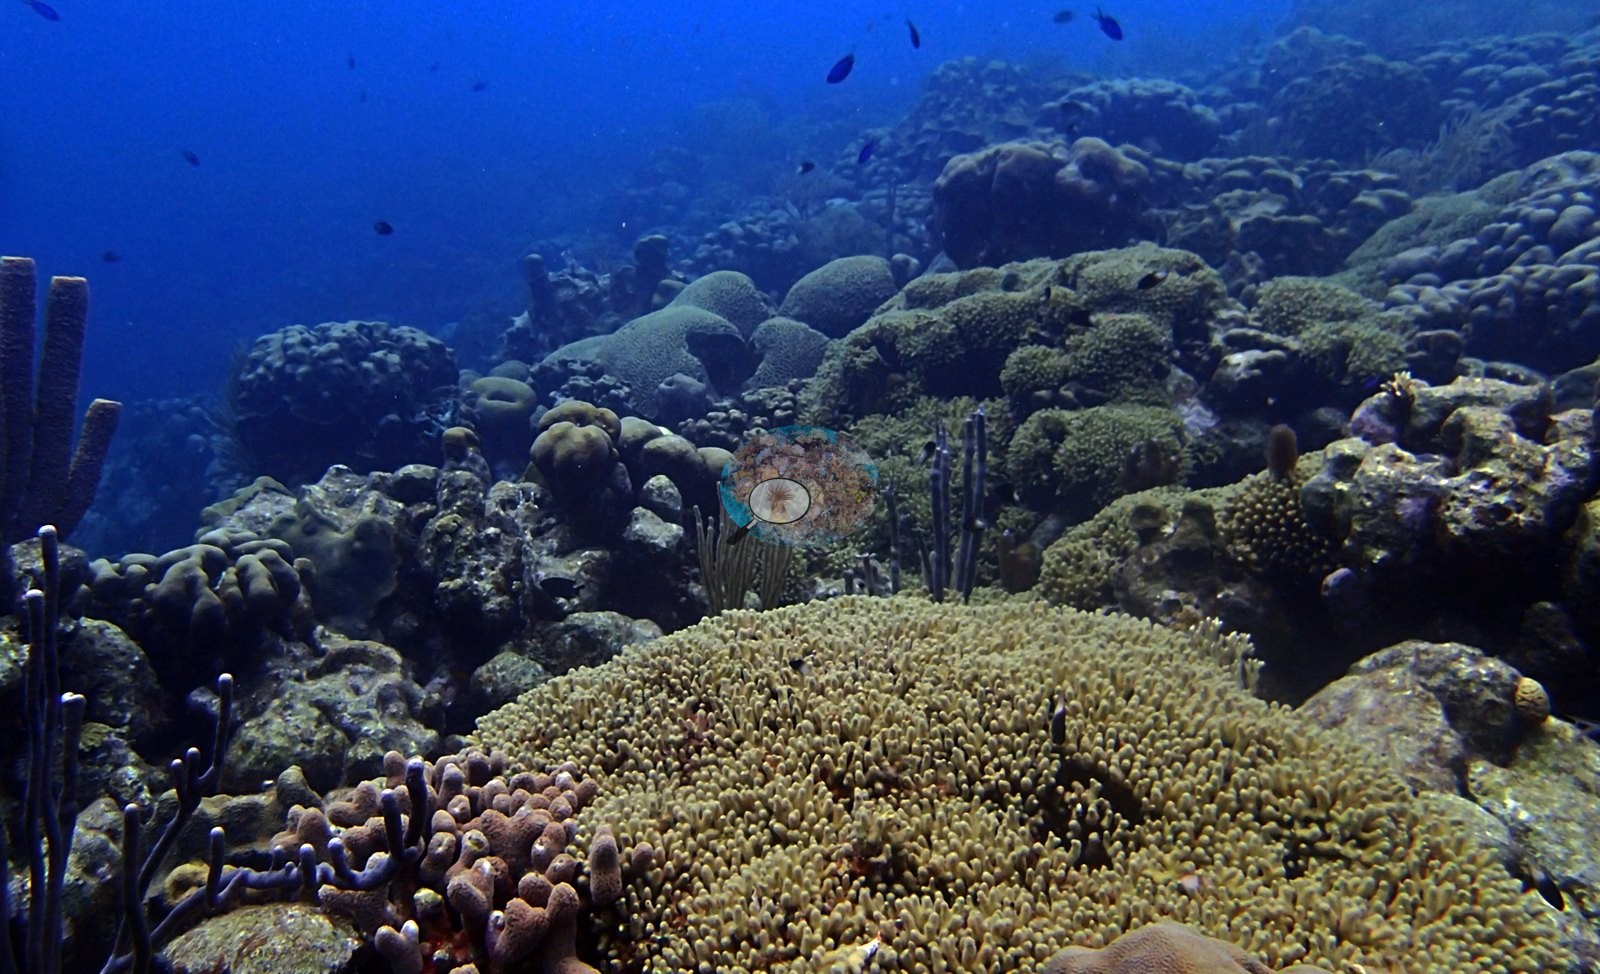
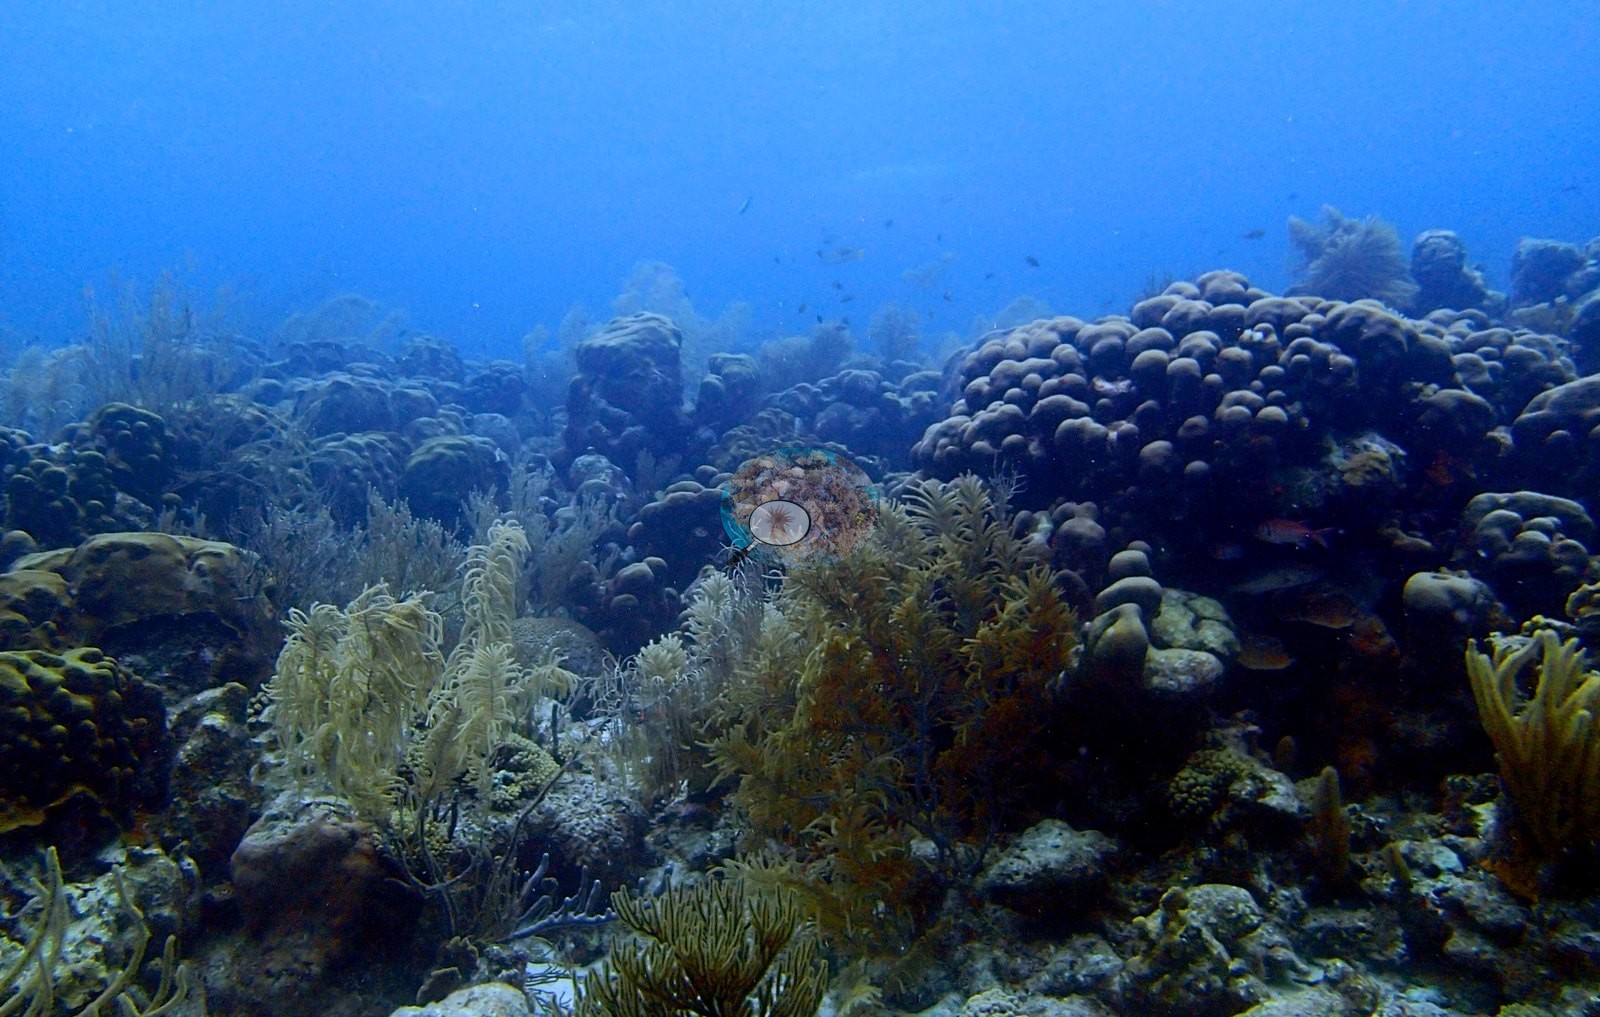
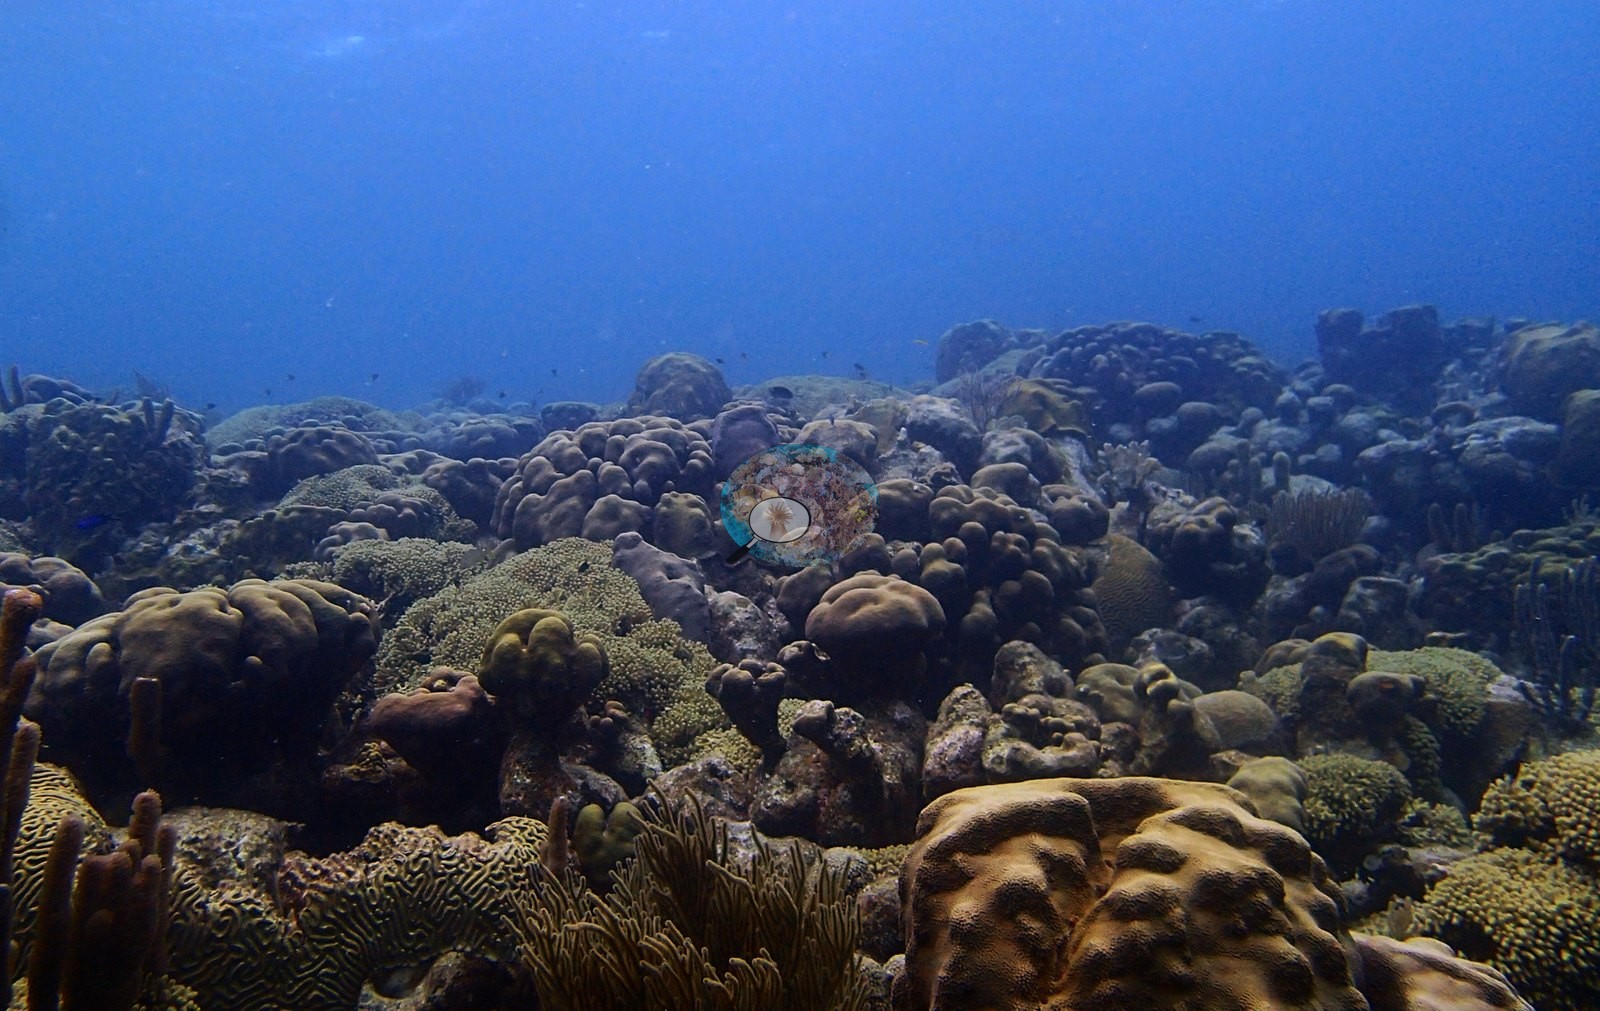
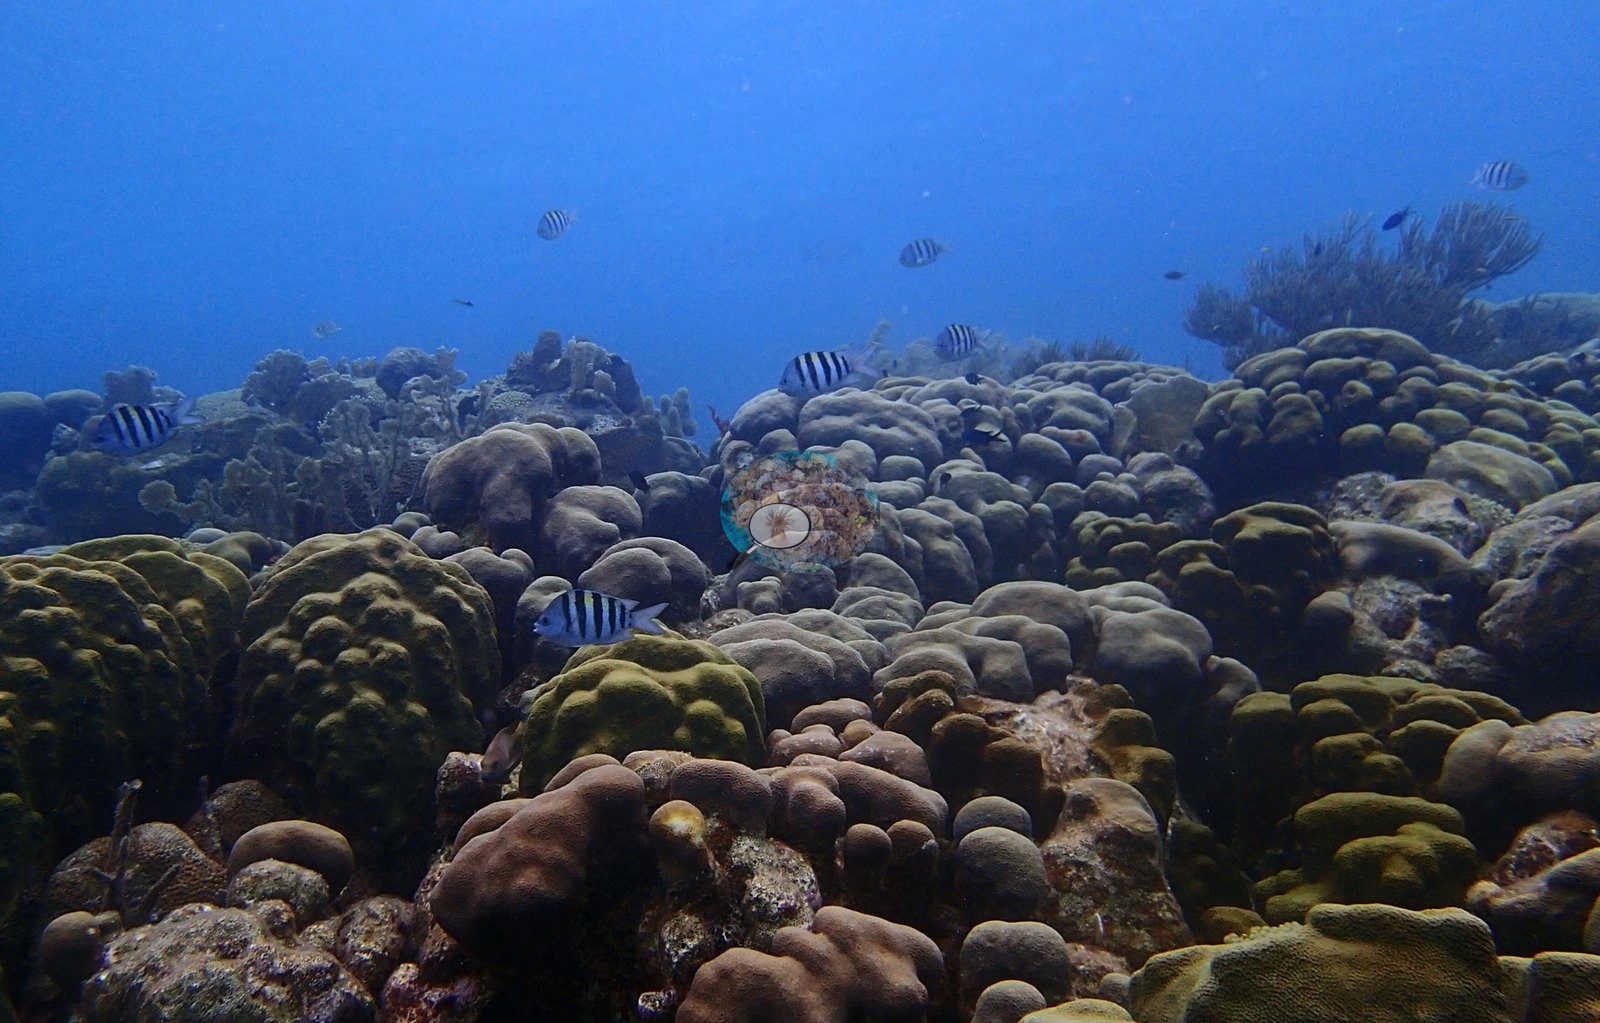
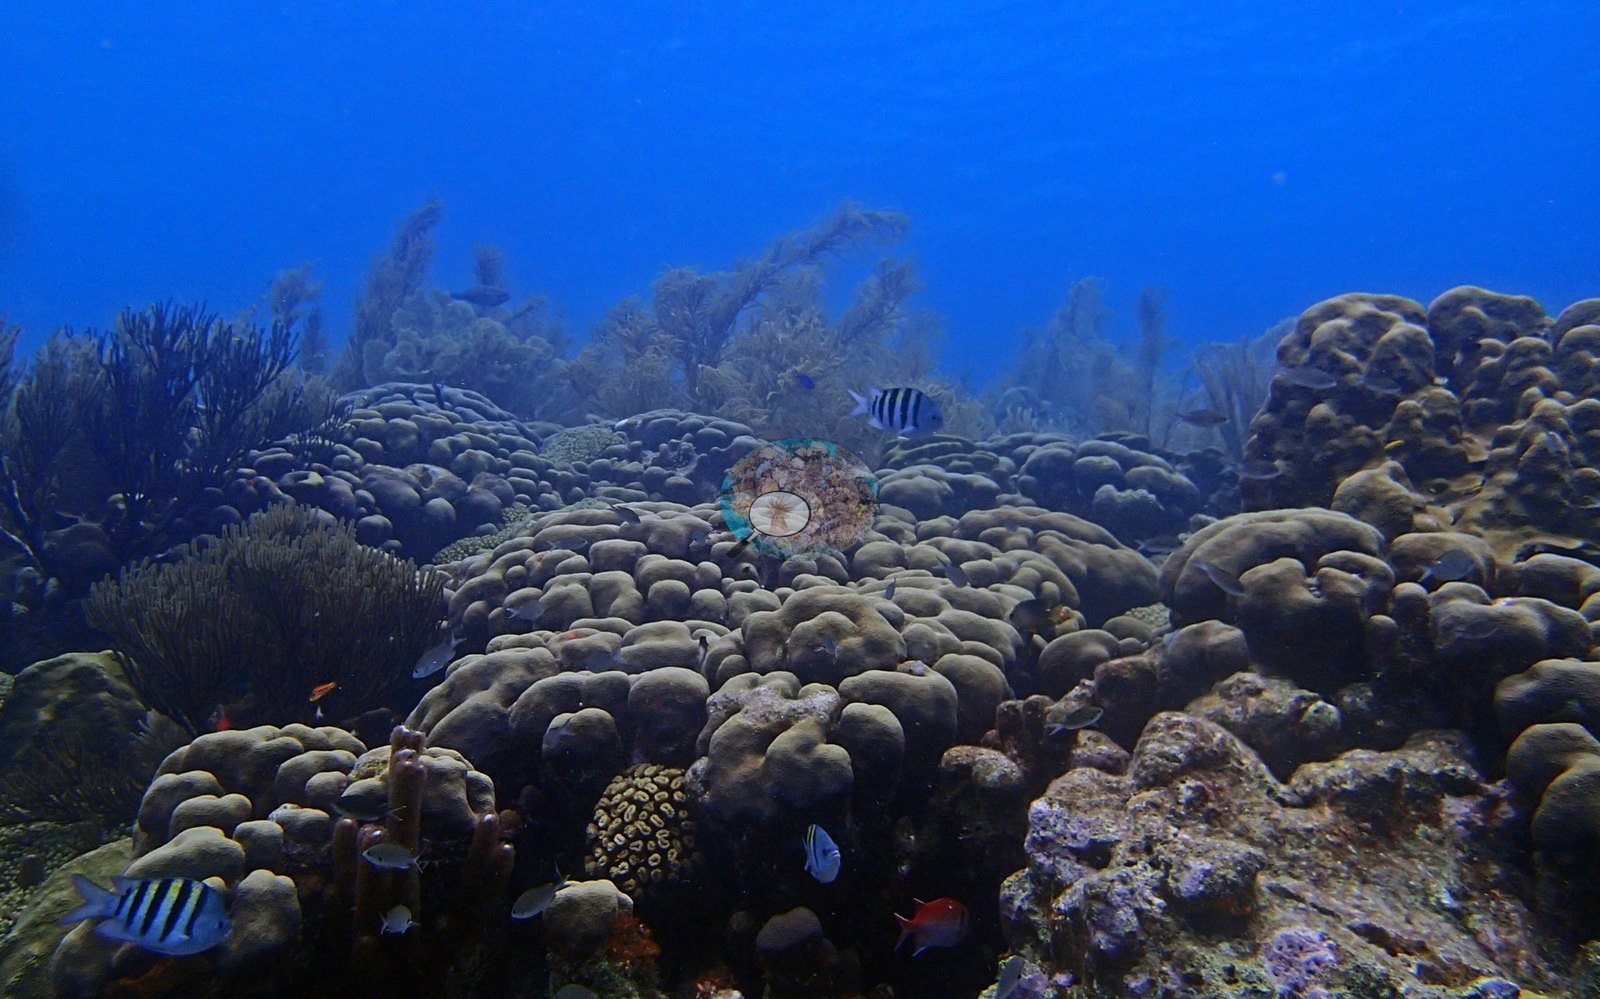
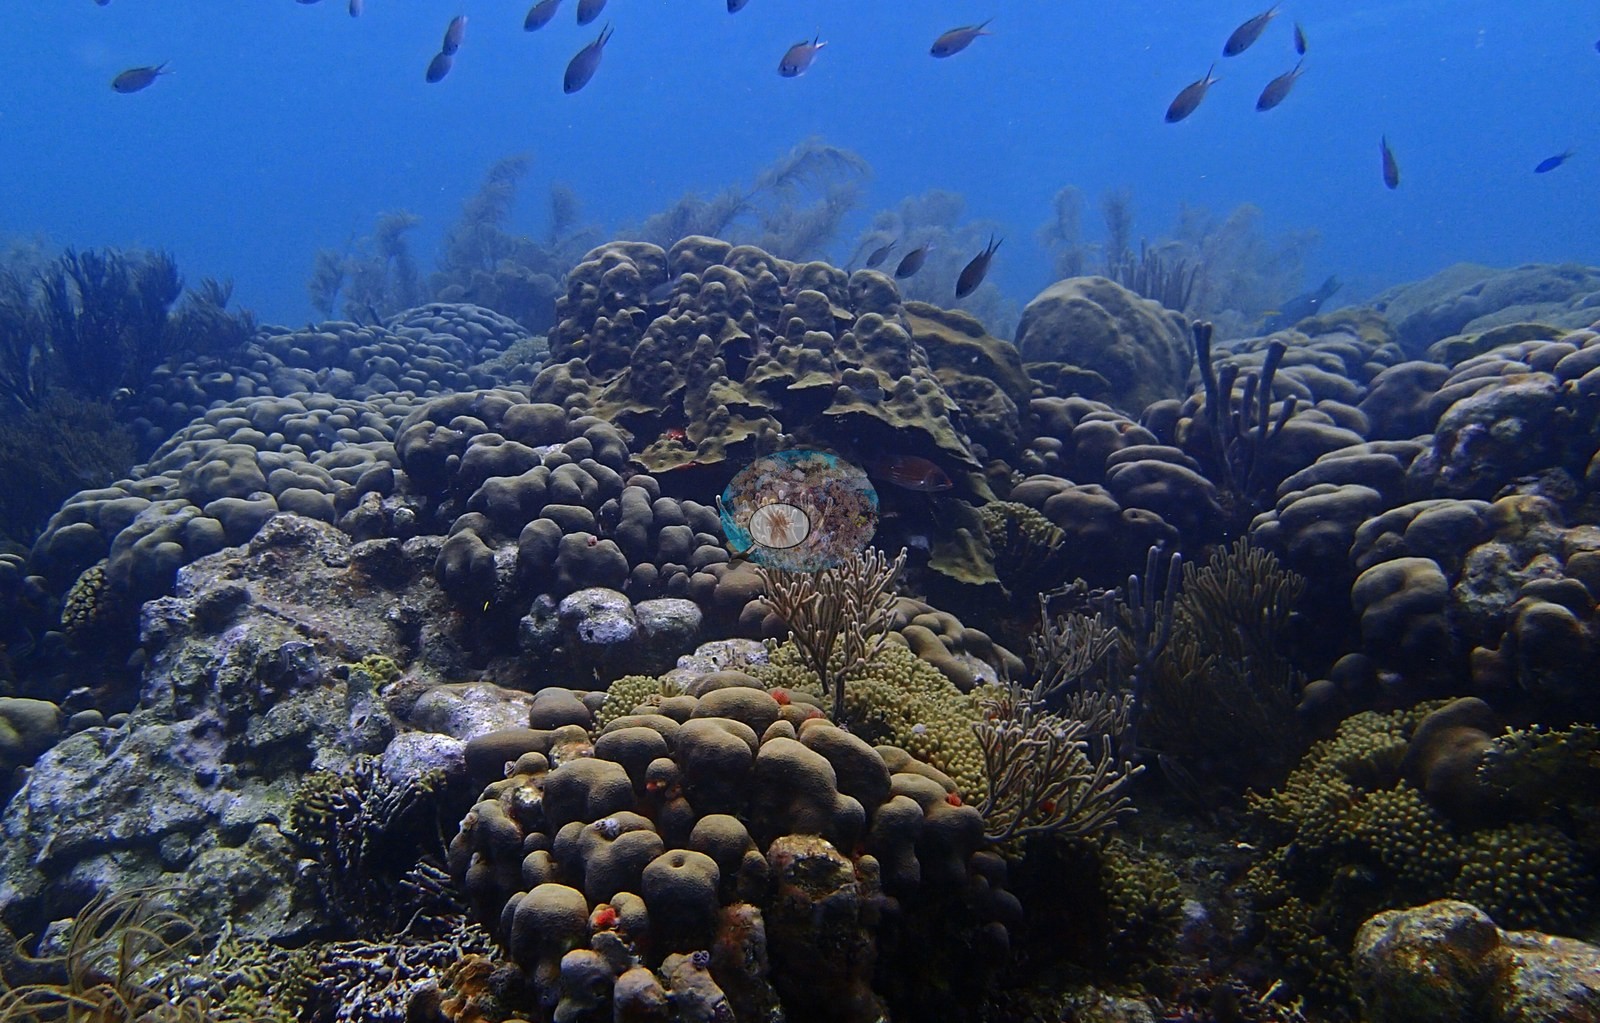
Many of these scenic frames show high apparent live-coral occupancy, especially in shallow fields of large massive and lobate star-coral forms (e.g., Image 2).
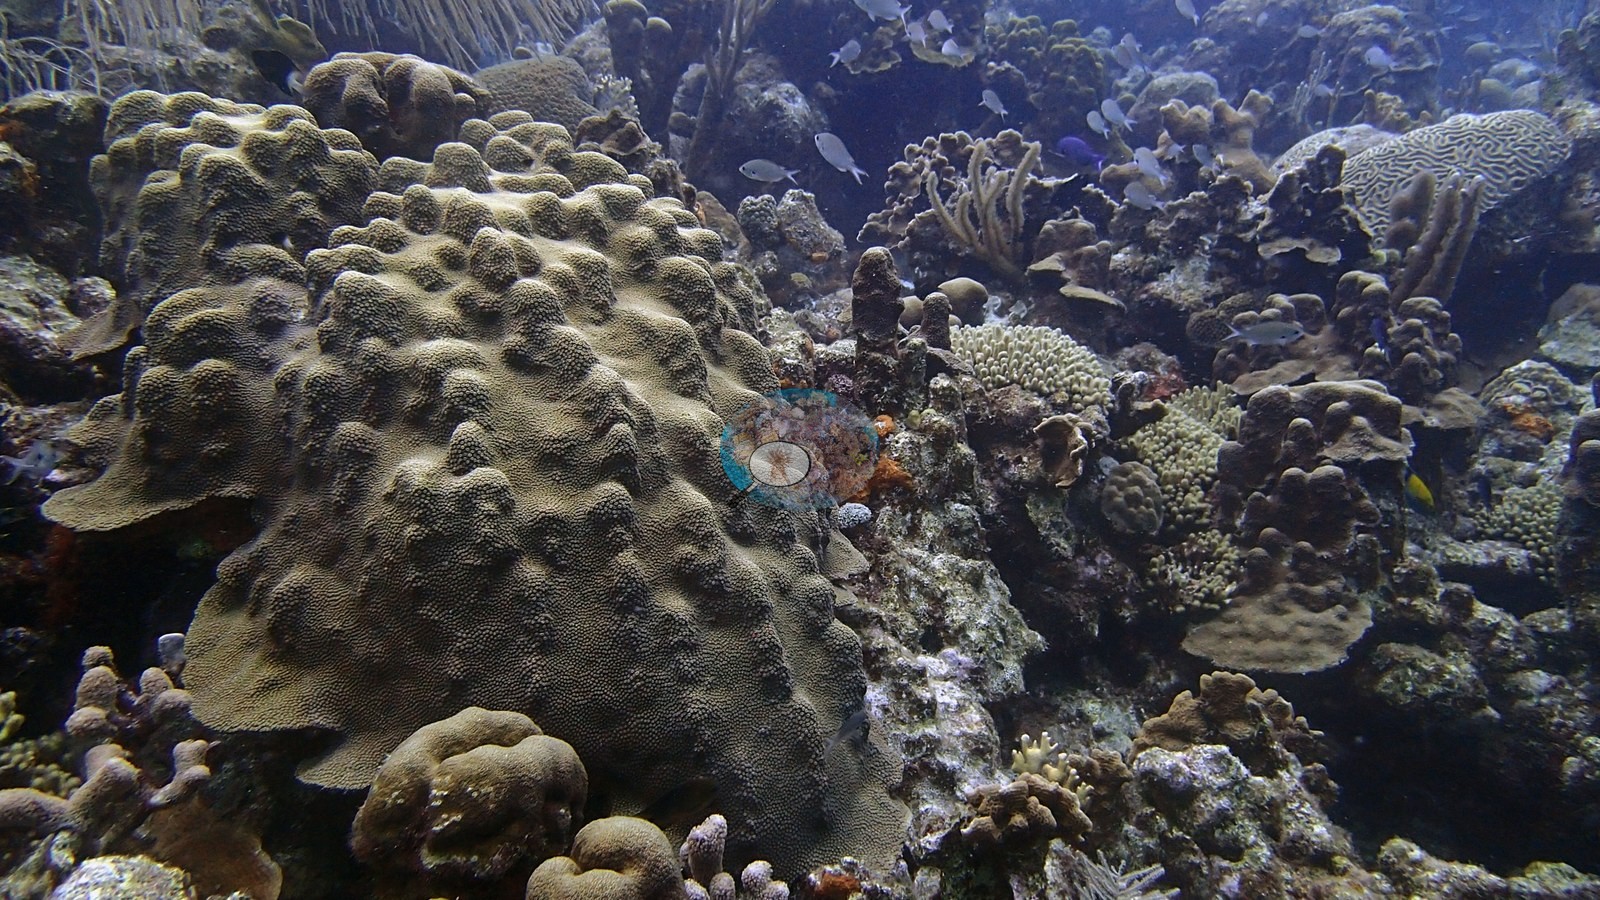
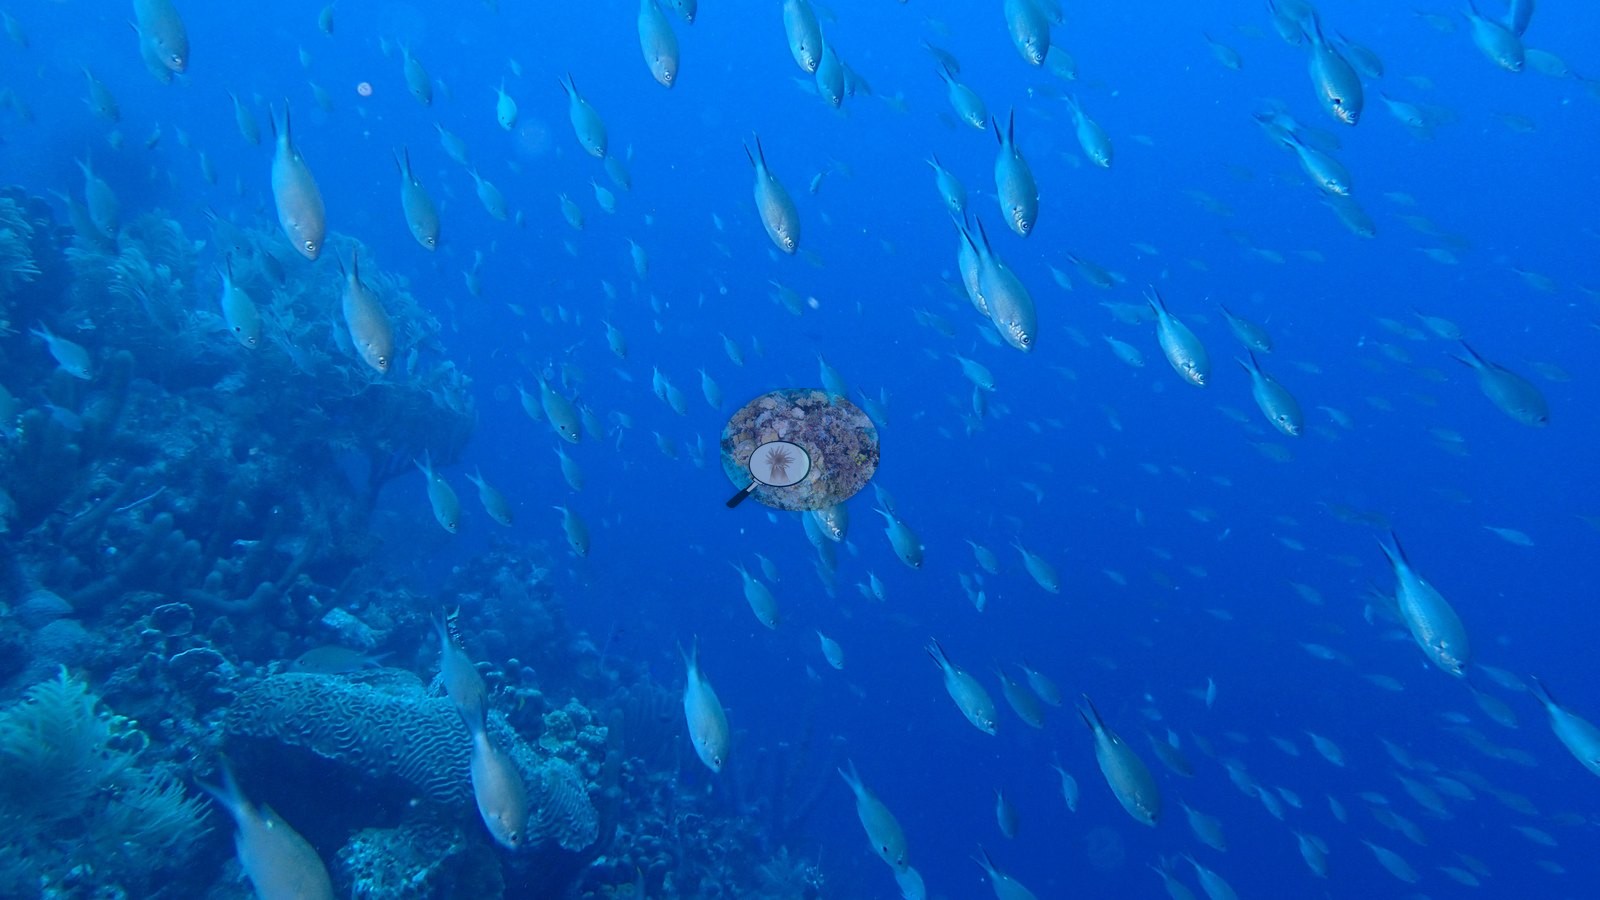
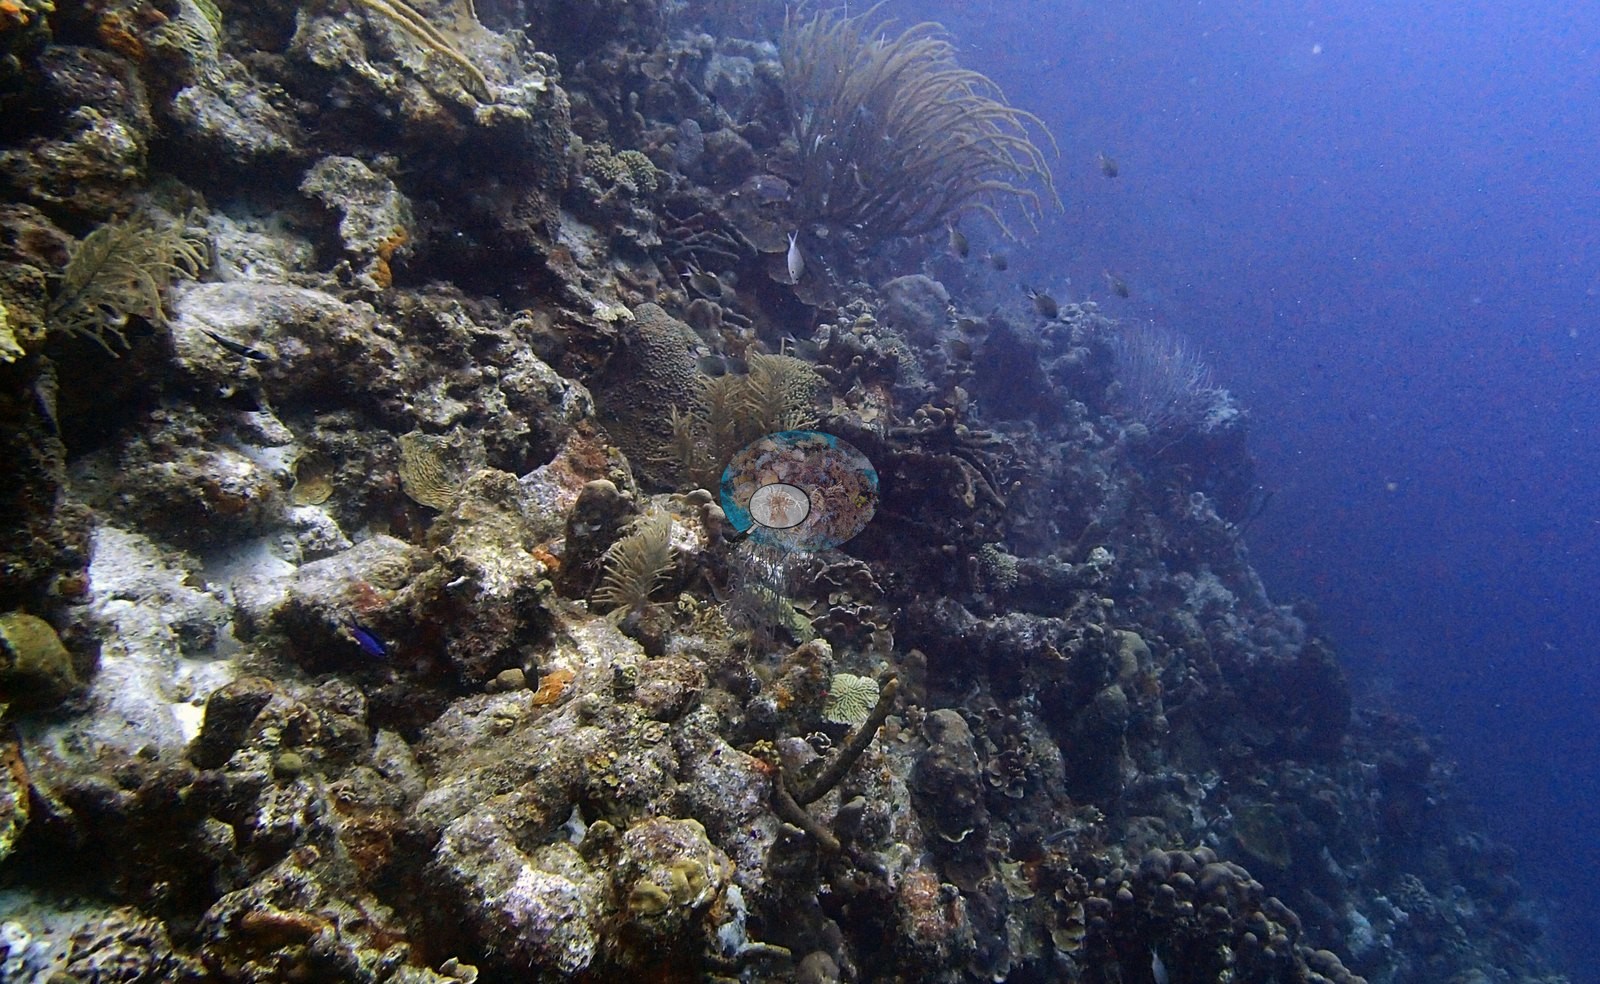
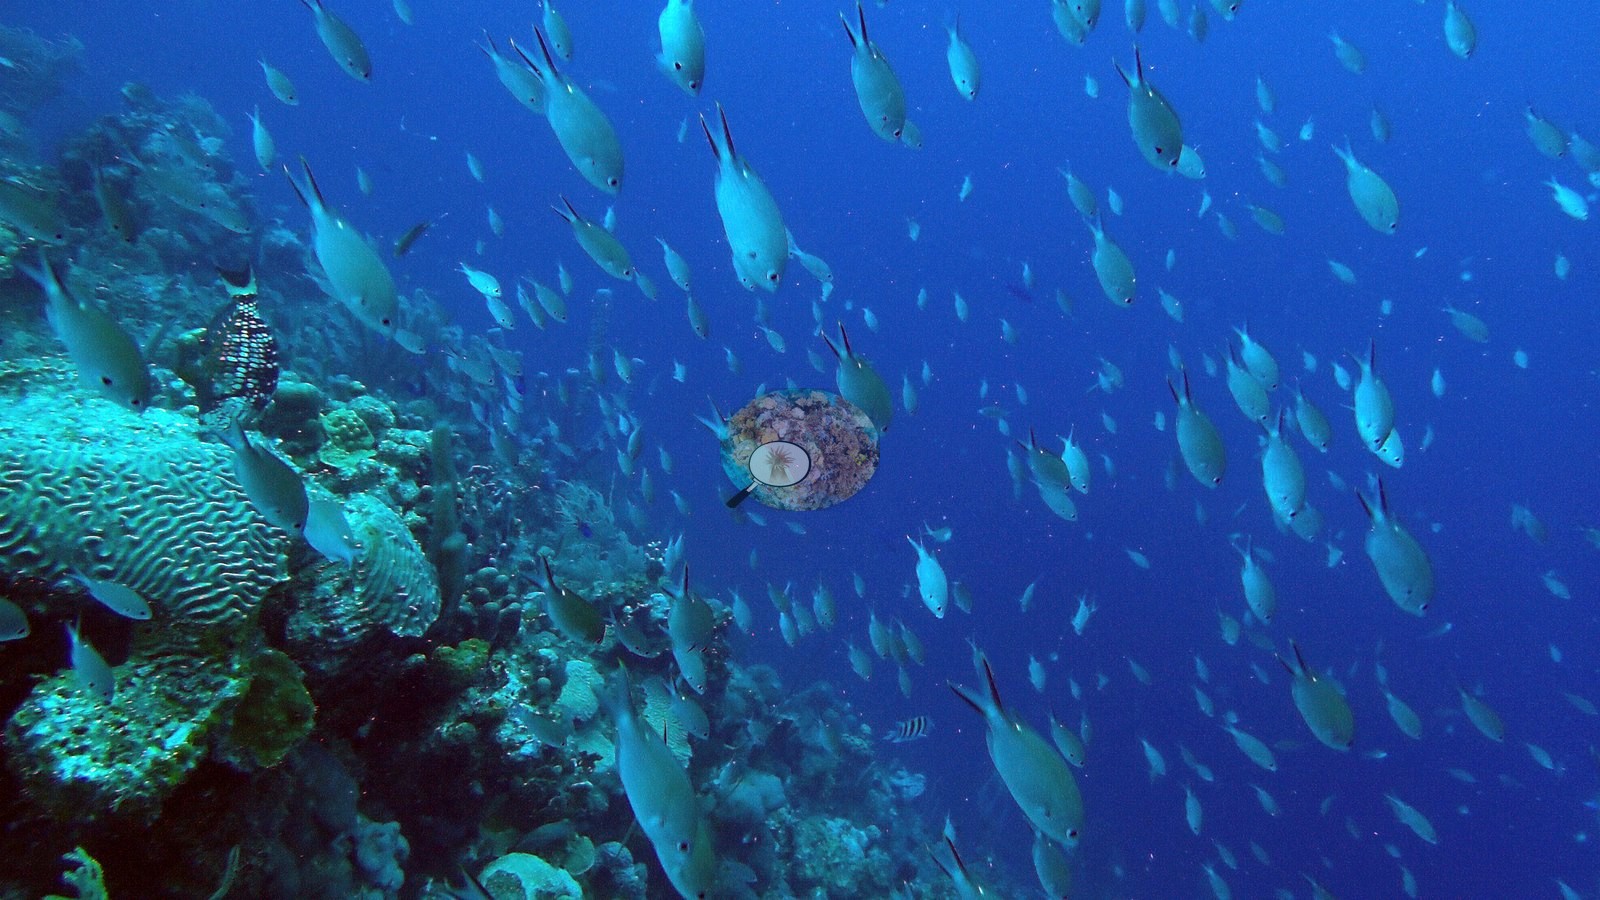
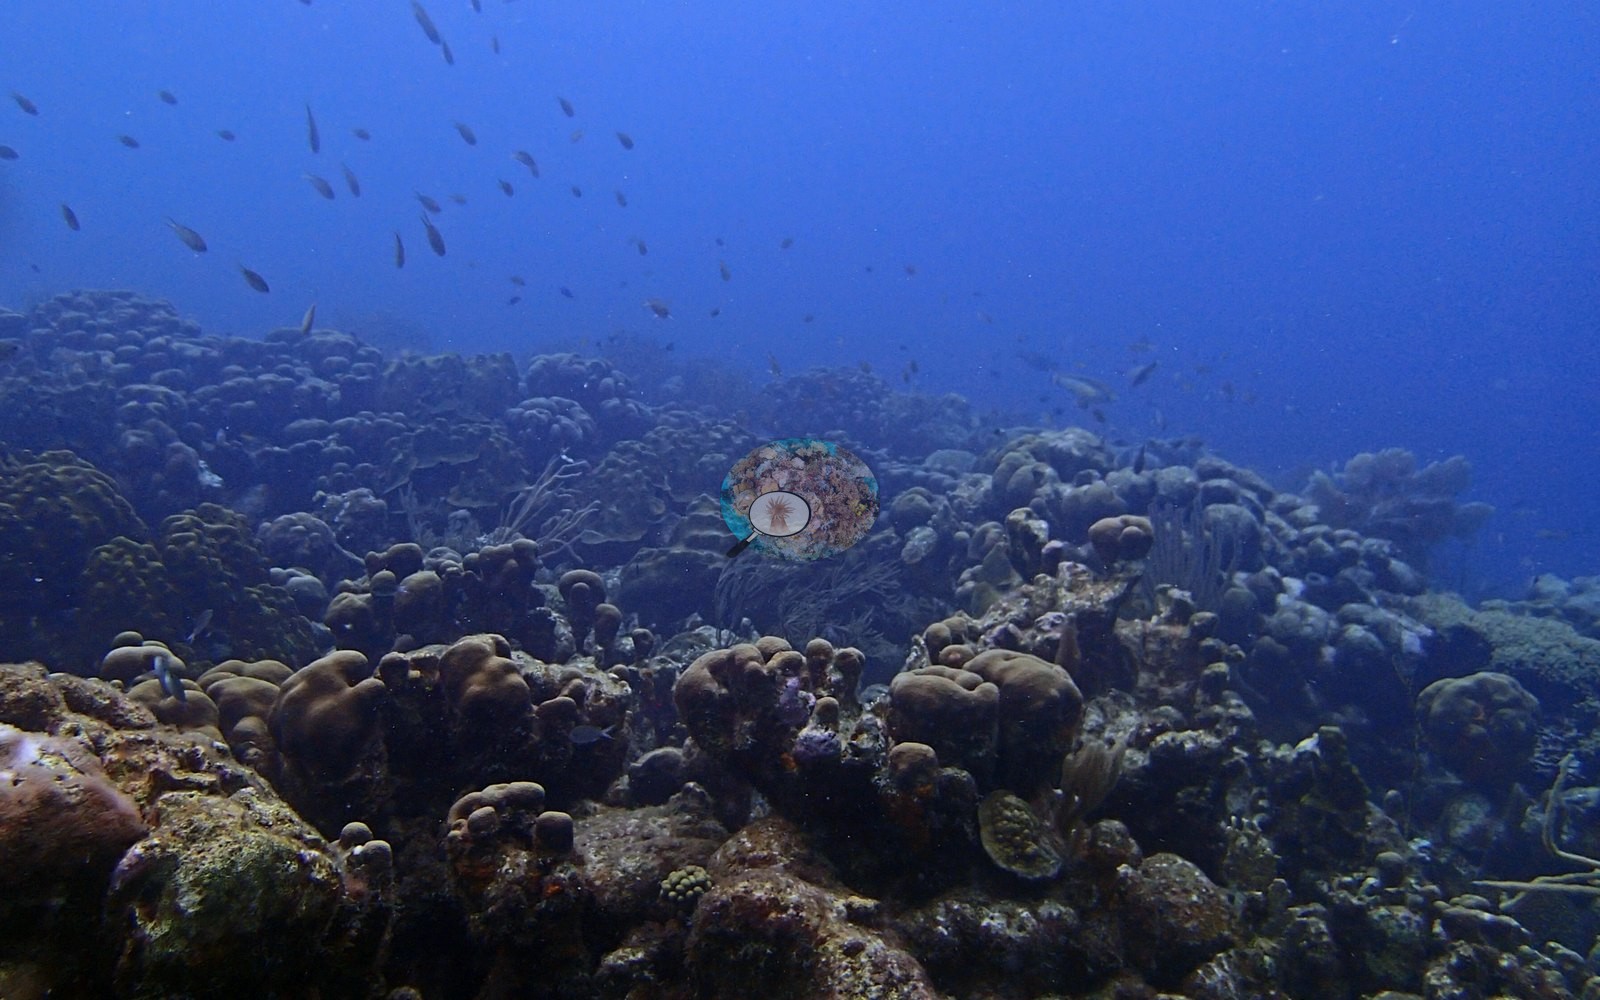
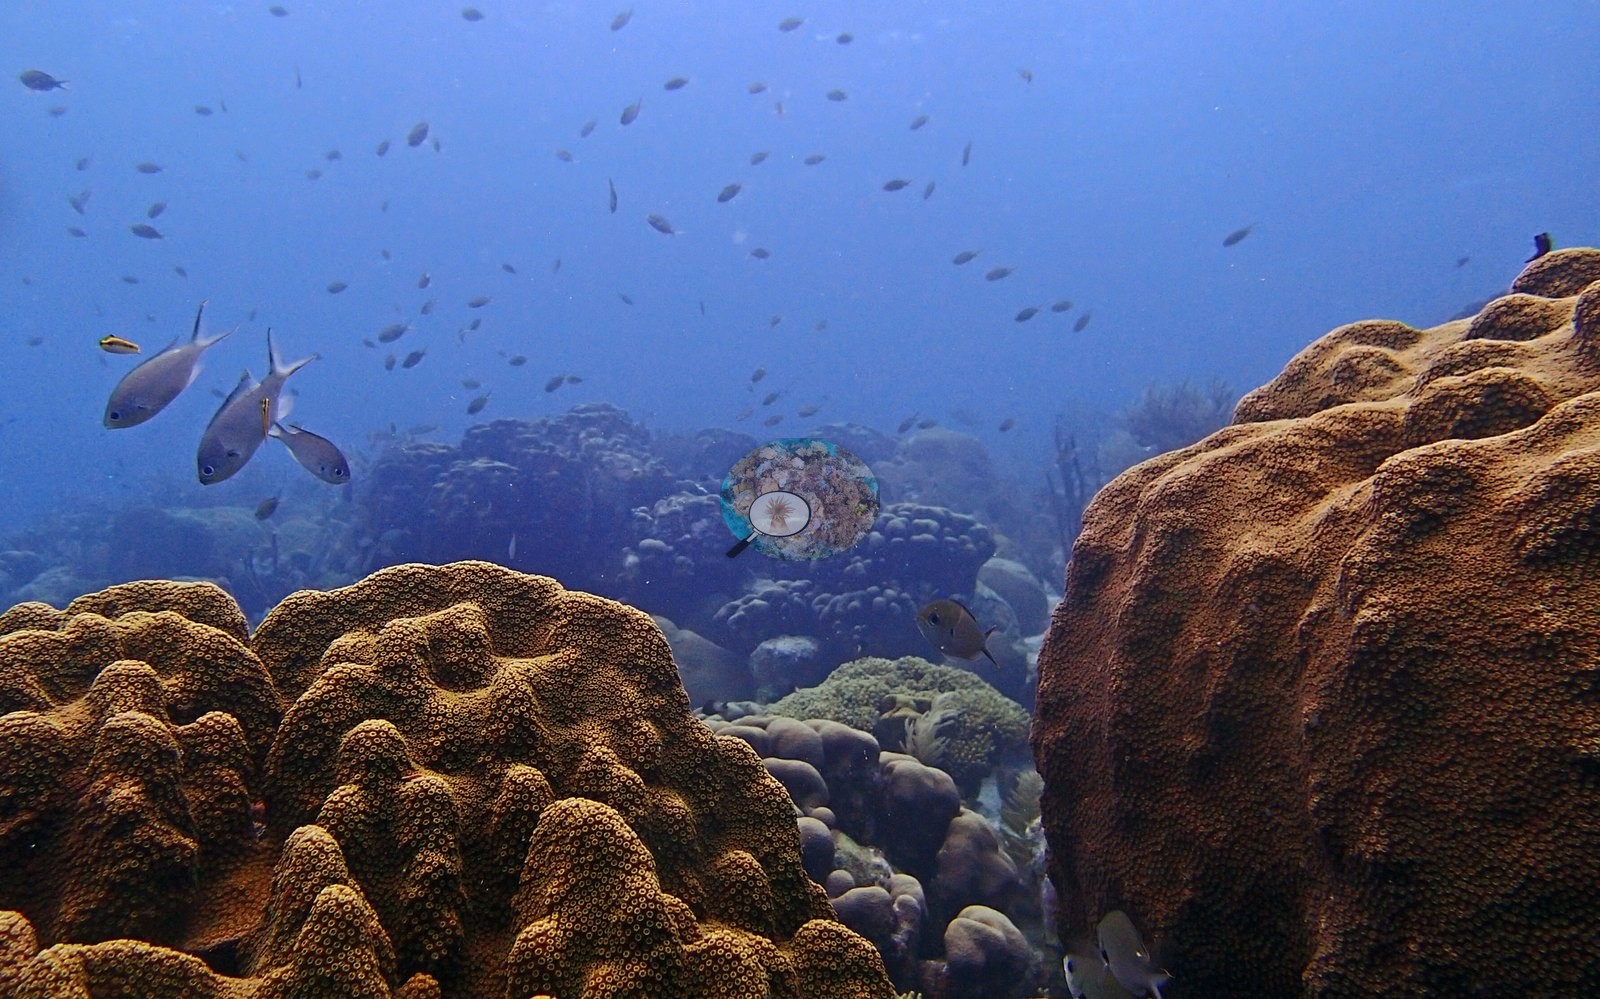
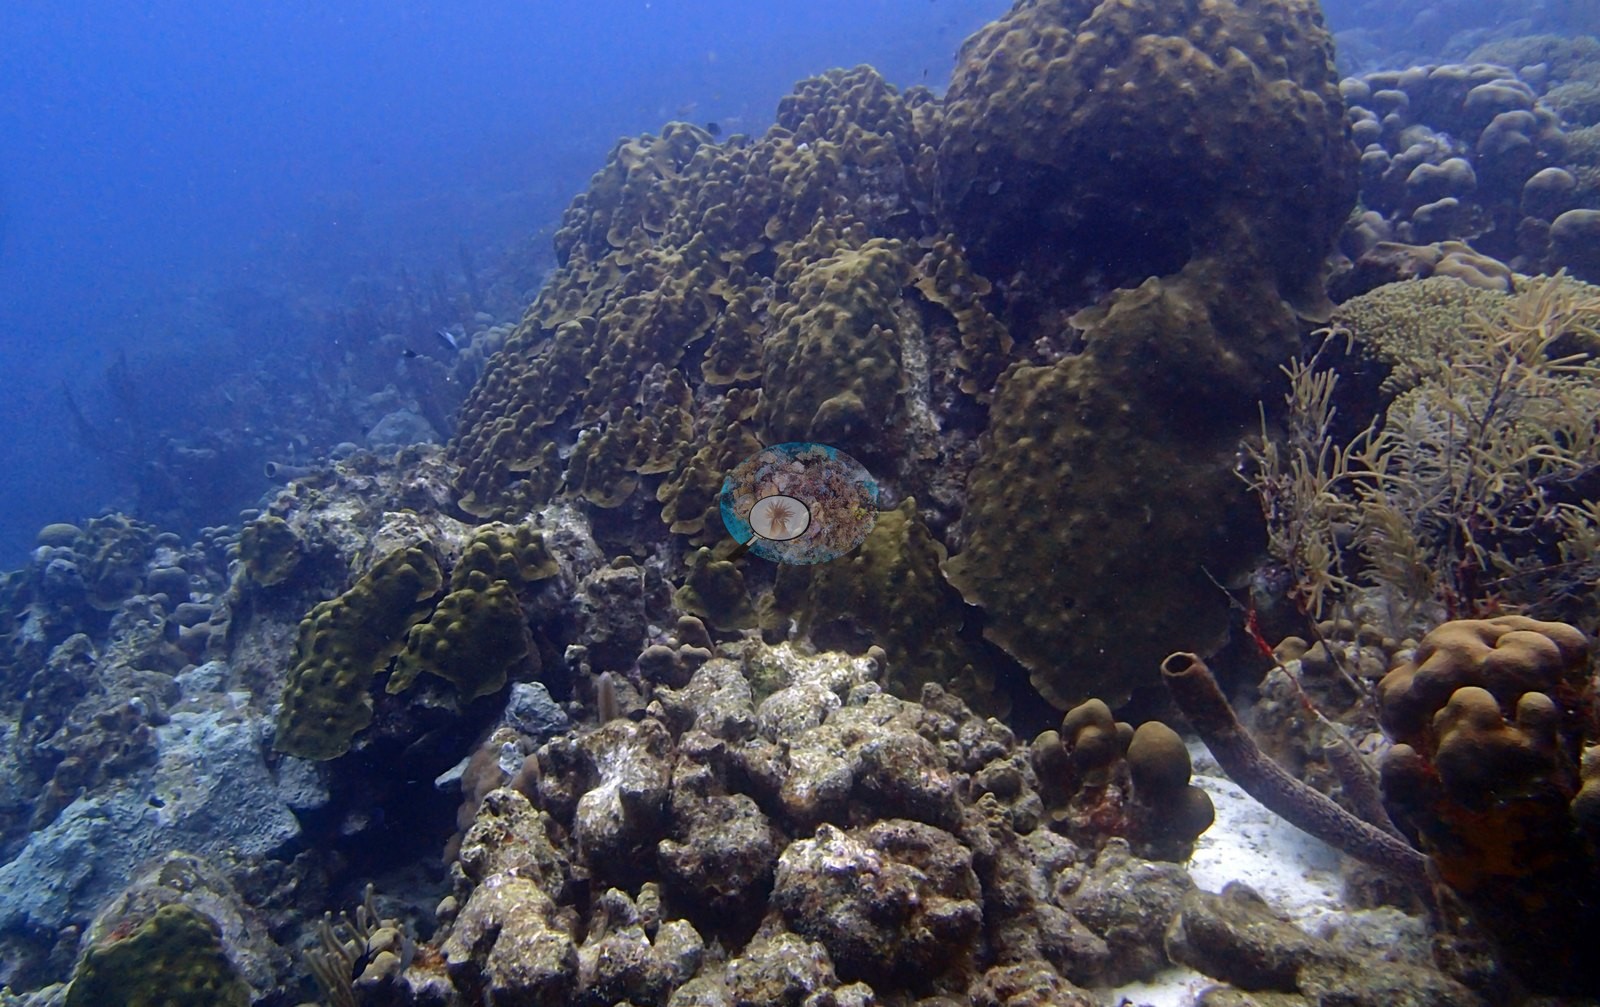
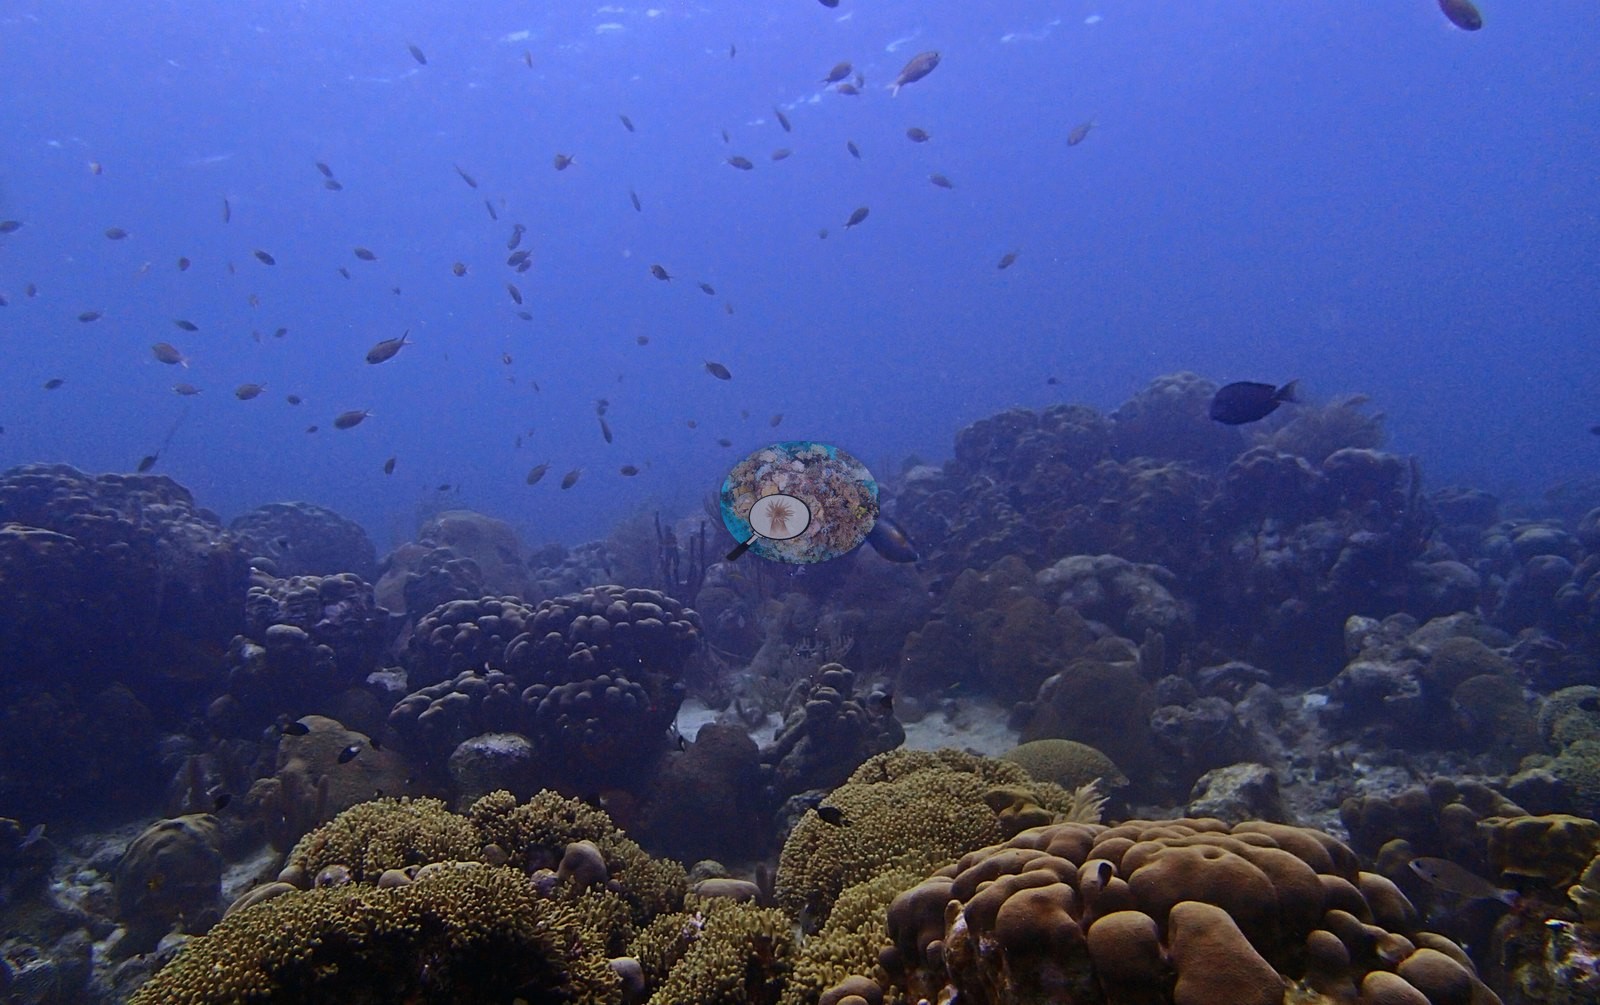
The set also records reef-wall relief, brain and plating corals, octocorals, and living Acropora palmata (e.g., Image 1, Image 3).
Coral cover
- Reference: Claude CV point count (this site's photos)
- Coral cover: 36% — a blind Claude computer-vision point count of 41 of Anderson's edited photographs (20 points per photo; water, fish, and obstructions excluded). Other computer-vision methods are listed in the method table.
Stressors
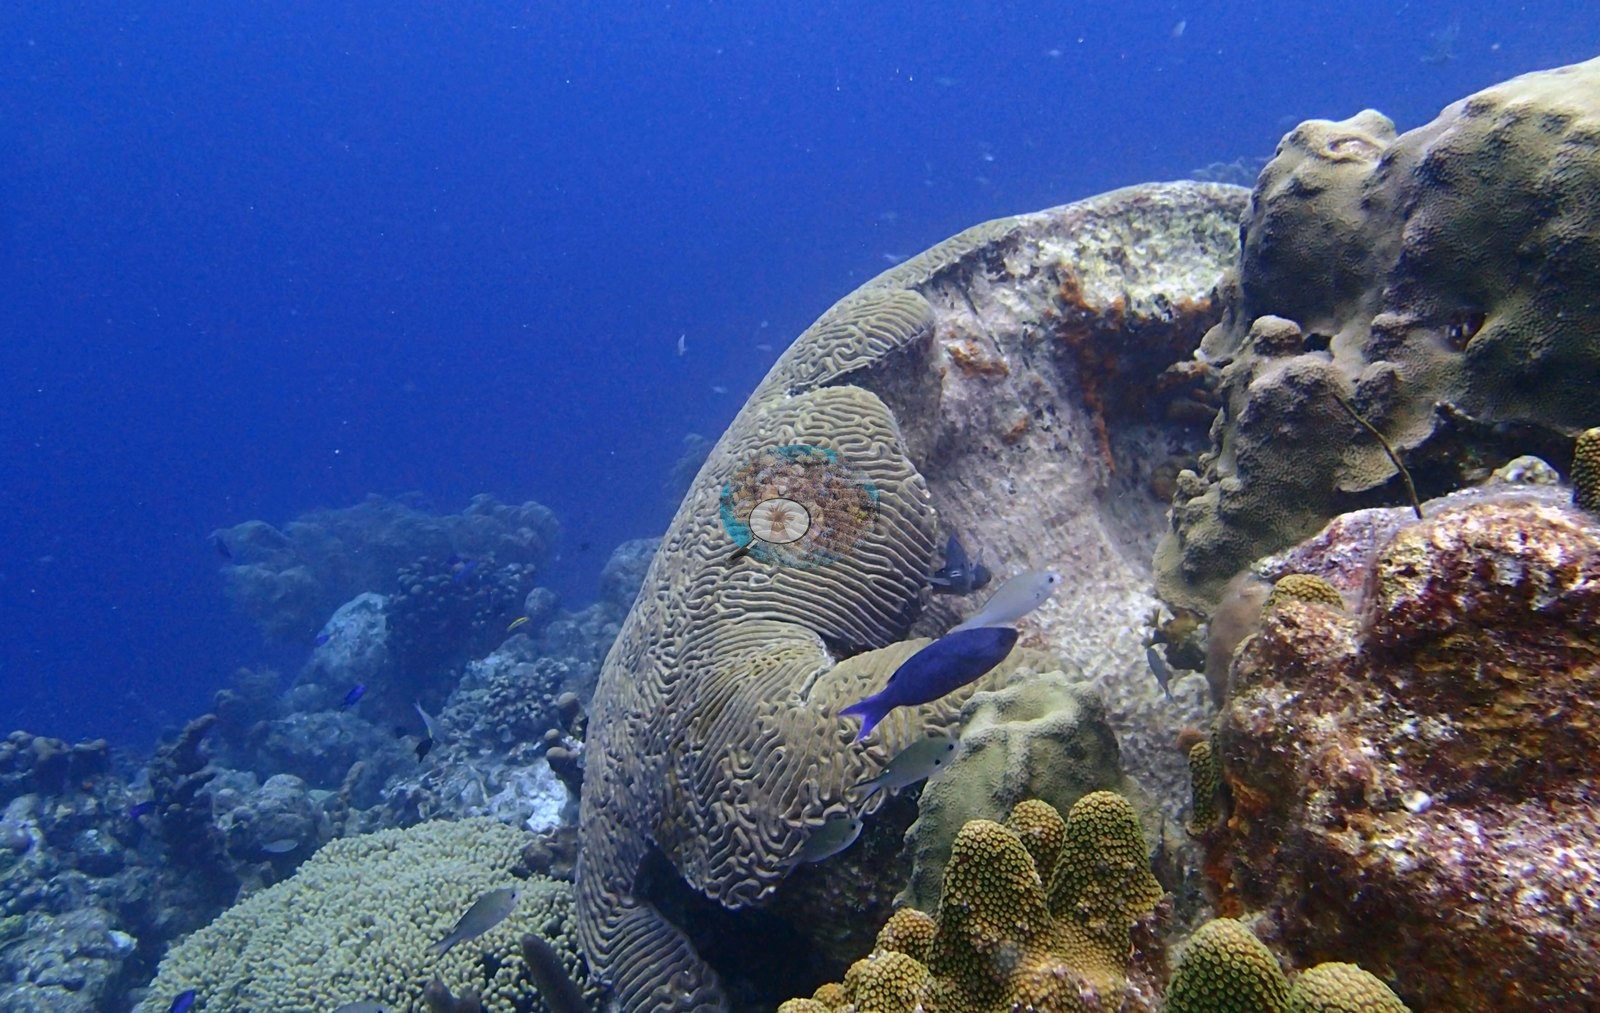
No widespread bleaching signal is visible. Most colonies retain substantial pigmented live tissue. One frame clearly shows a large brain coral with extensive central old partial mortality and encrusted/exposed skeleton, demonstrating meaningful colony-level loss despite otherwise coral-dense scenes. A single time point cannot establish whether the margin was active in 2017. No corallivores were evident.
Fish and other fauna
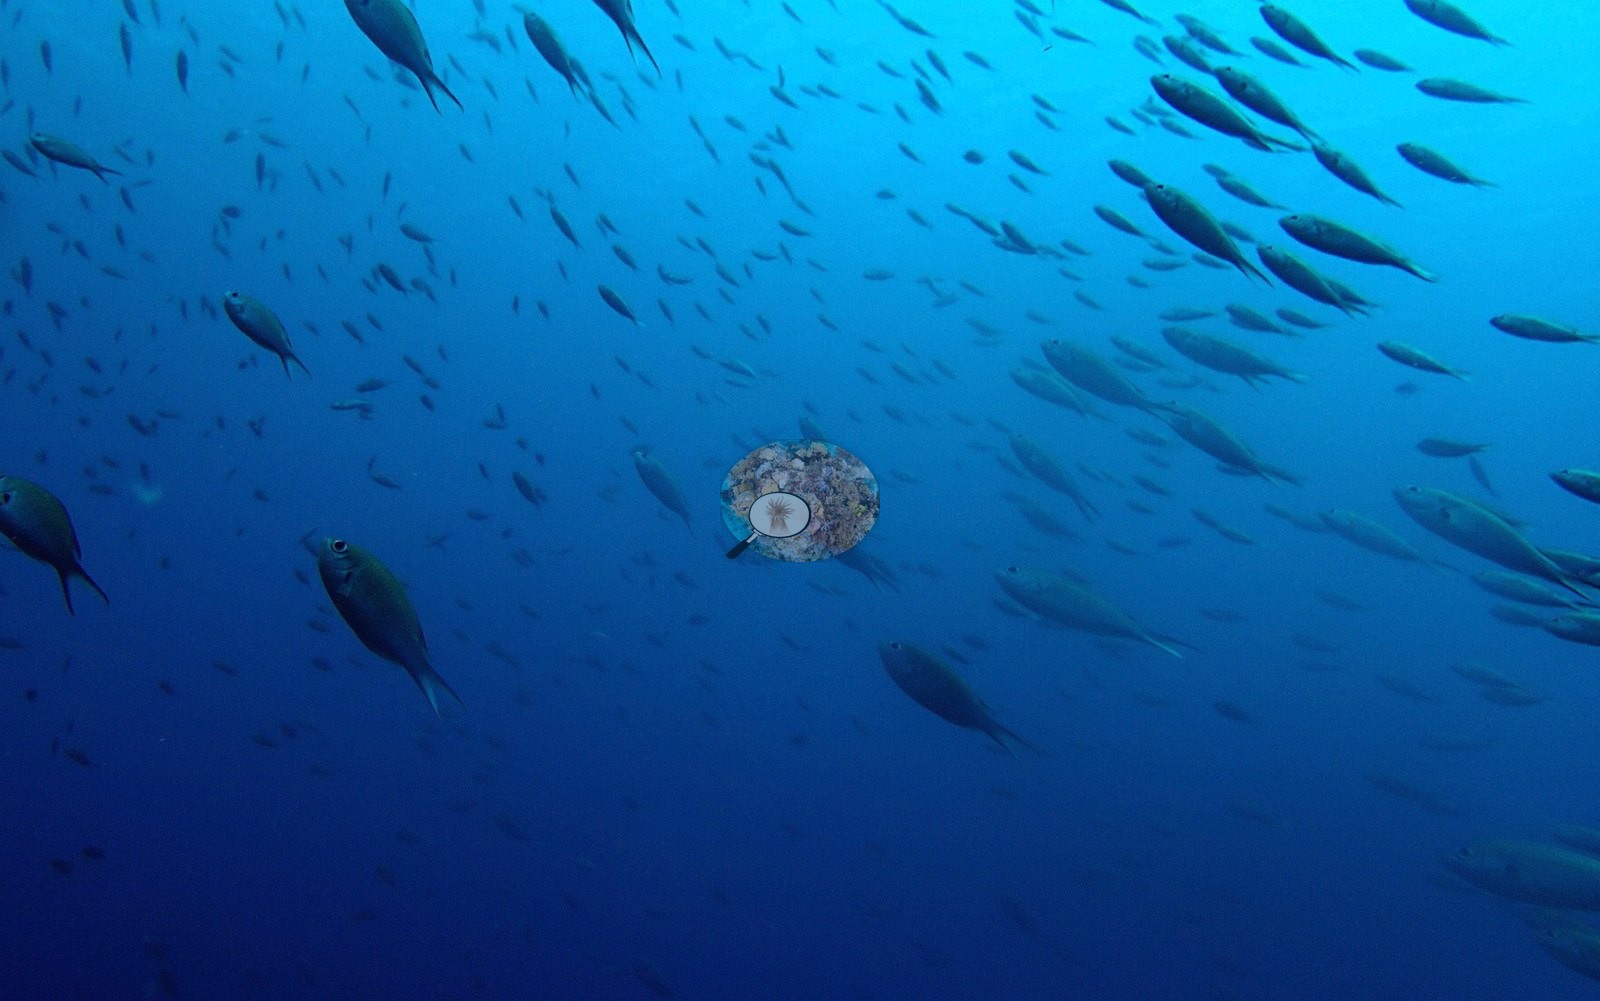
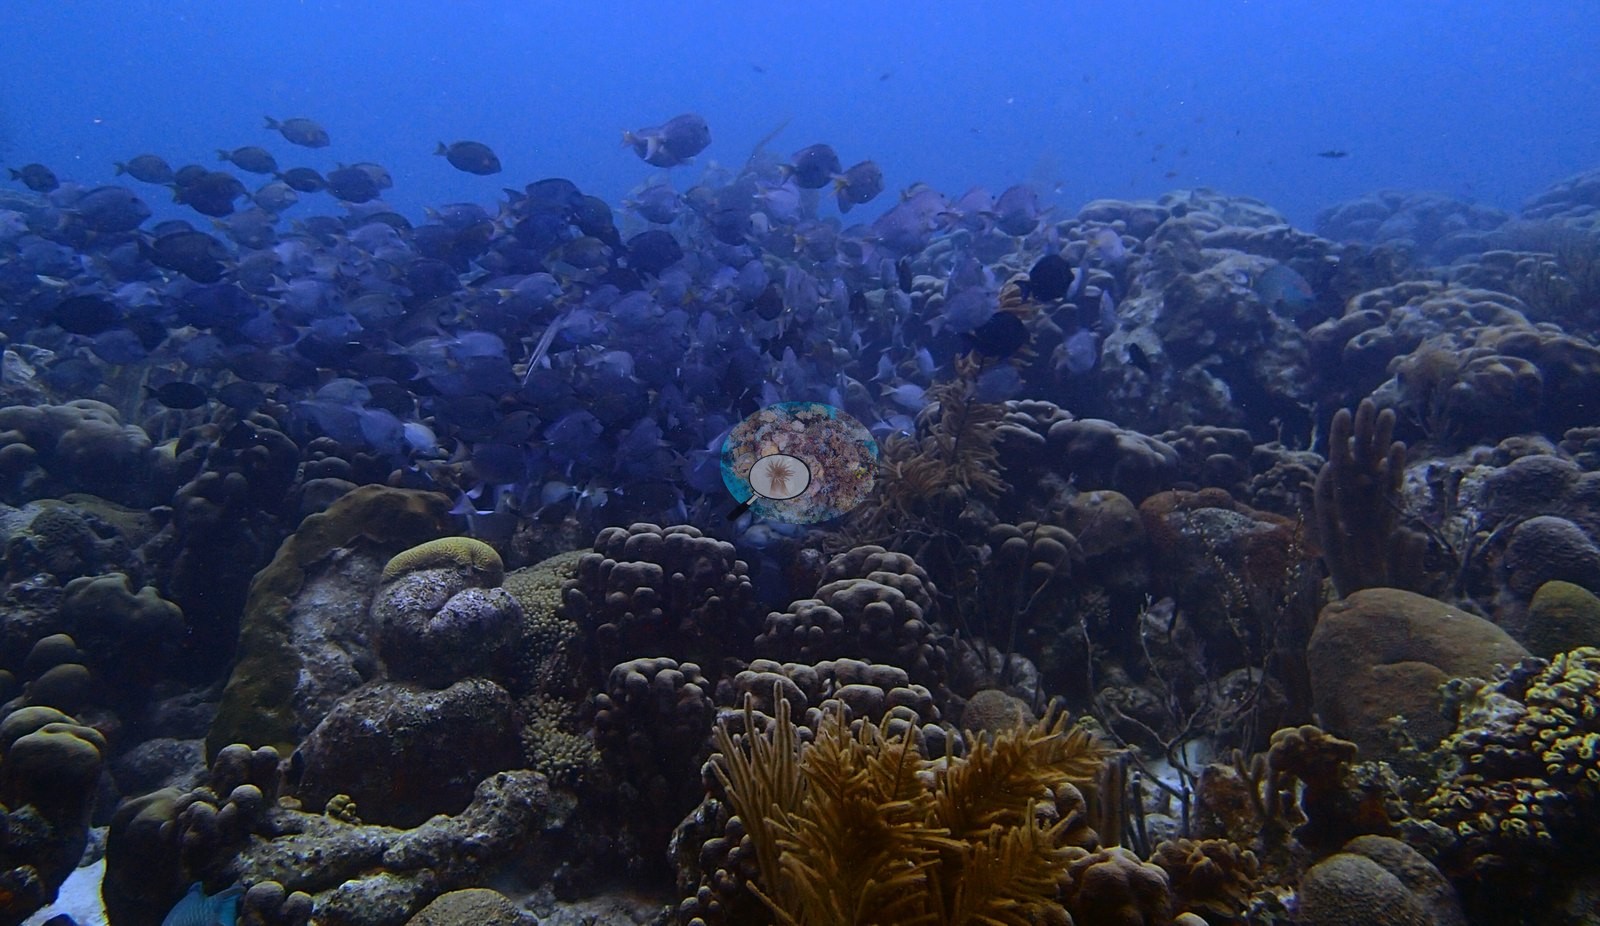
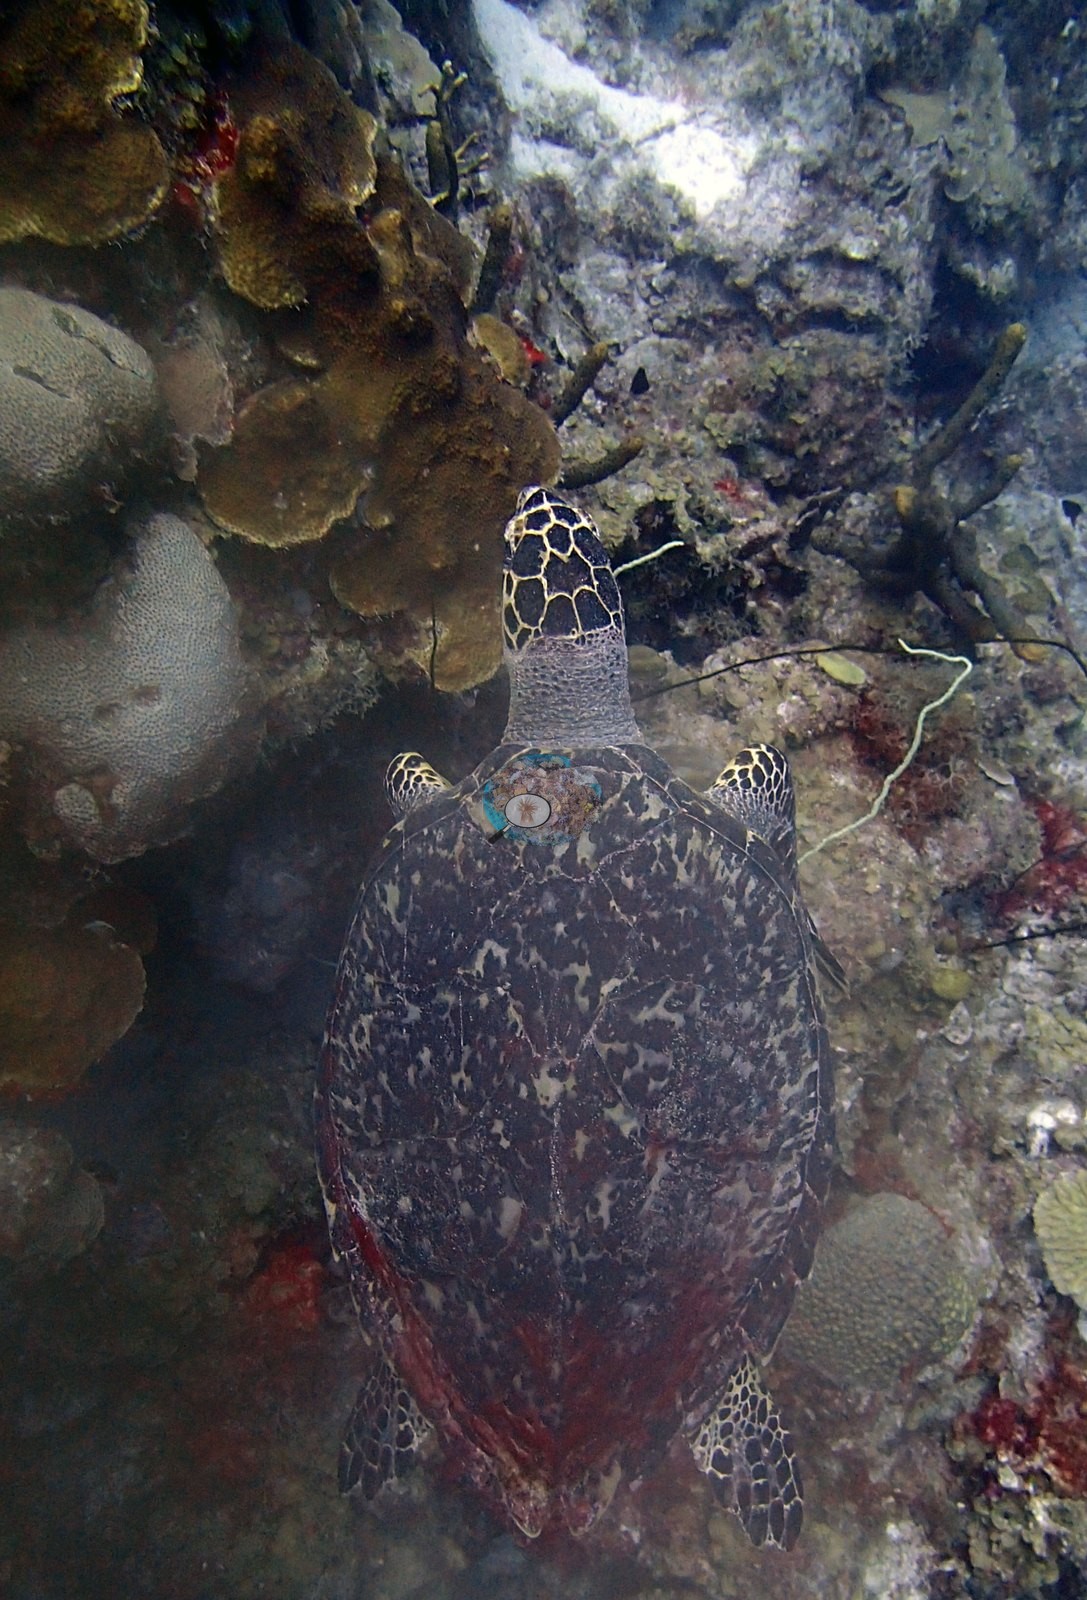
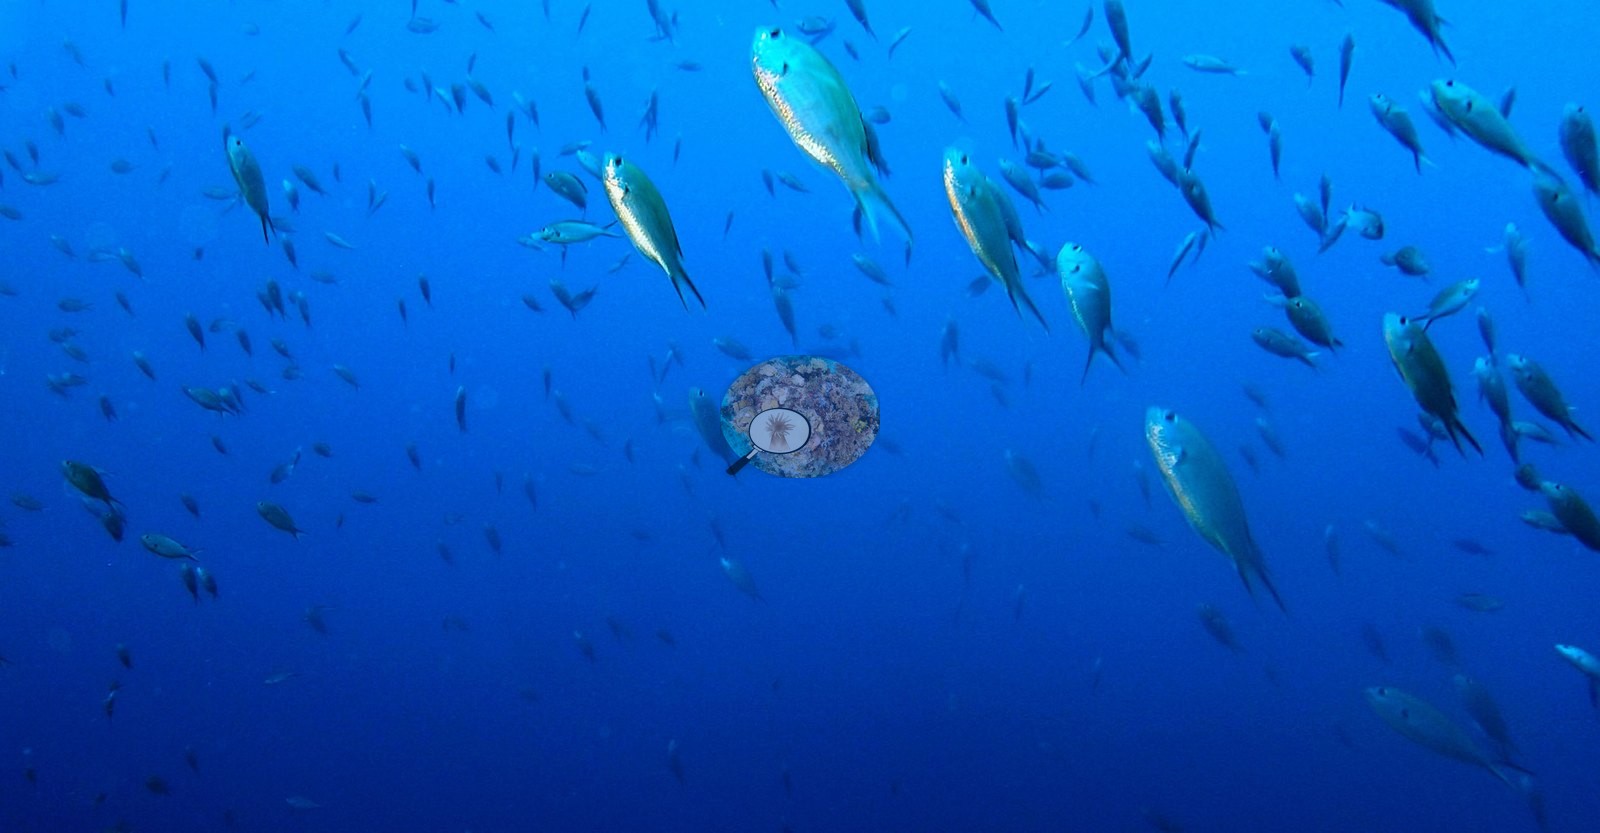
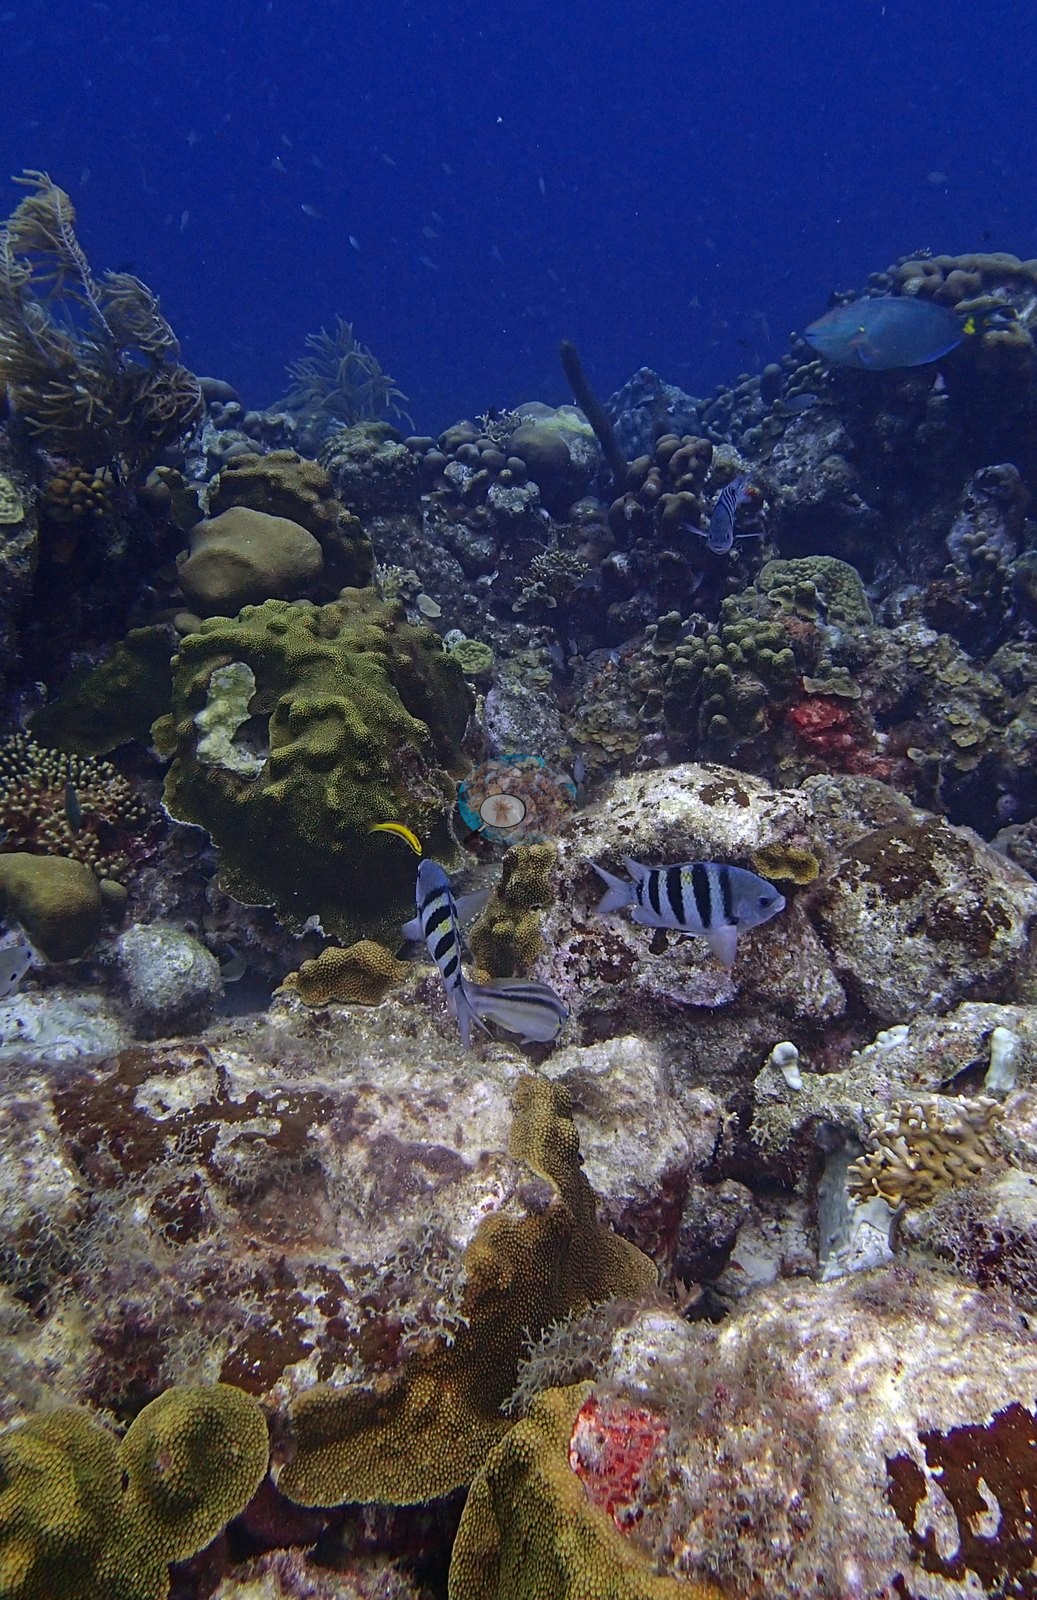
A hawksbill turtle rested on the reef and dense schools of sergeant majors and blue chromis hovered over the coral (e.g., Image 36).
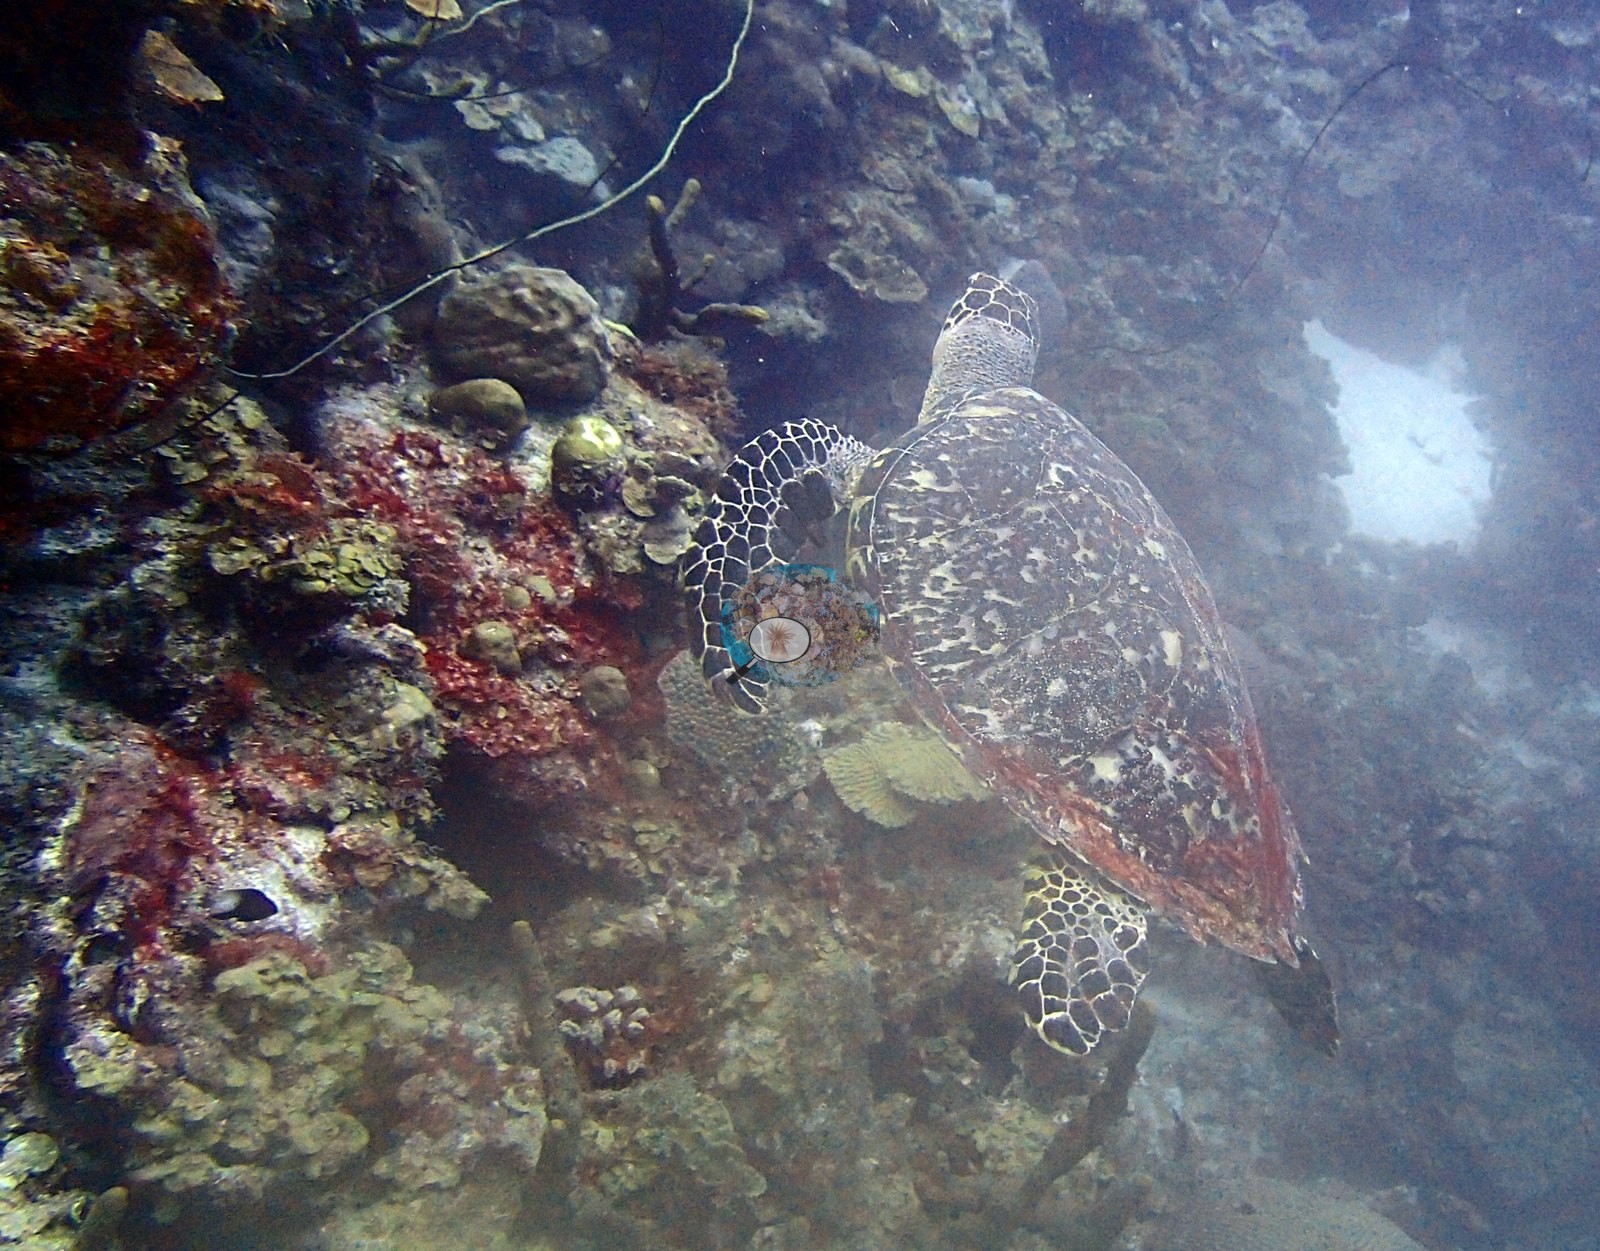
Turtles, schooling fishes, and blue tangs are conspicuous.
Comparisons with other data
Stokes et al. 2010 surveyed this site (Karpata (Bonaire Marine Park mooring) [2008 - 5 m]) in 2008, 0.08 km from the pin. Within 5 km, ten independent stations recorded station-year means of 20–60% hard coral cover between 1999 and 2017; the nearest, Stokes et al. 2010 at Karpata (Bonaire Marine Park mooring) [2008 - 5 m], 0.08 km away, read 36% in 2008.
CV model comparison
More info
A few low-cover photos (sand, rubble, or open bottom) pull the mean down; the median is the typical photo. No computer-vision method yet estimates coral cover accurately on new images, so treat this as indicative rather than a measurement; it is revised as the methods improve.More info
Other rows are for comparison only and are never averaged. No diver transect exists for these photos, so agreement between rows is not accuracy.| Method | Hard coral cover (%) | Photos (n) ± SE |
|---|---|---|
| CoralSCOP edited | 32.3 | n = 49 · SE 2.6 |
| Claude (edited photos) | 35.6 | n = 41 · SE 2.9 |
CoralSCOP (edited photos) reads 32.3%, within 3.3 pp of Claude's blind point count (35.6%).
See a more detailed, stand-alone version of this table.
Independent surveys nearby
| Agency / program | Year(s) | Stations / distance | Link |
|---|---|---|---|
| Kramer & Bischof 2003 | 1999 | 1 station, 0.08 km | Records ↓ |
| Reef Check | 2000–2003 | 1 station, 0.81 km | Records ↓ |
| Steneck et al. (2019) | 2004–2017 | 2 stations, 0.23–1.95 km | Records ↓ |
| Stokes et al. 2010 | 2008 | 3 stations, 0.08 km | Records ↓ |
| XL Catlin Seaview Survey | 2013 | 3 stations, 0.09–4.29 km | Records ↓ |
 Coral Reef DiagnosticsYear-average (illustrative only, programs differ)
Within 5 km, 10 independent survey stations recorded hard coral cover in 59 records between 1999 and 2017. Of the 3 stations surveyed in more than one year, 1 declined (by 6.0 points) and 2 increased (by 9.0–14 points) between their first and latest surveys. The longest record, Karpata (Steneck et al. 2019, 0.23 km away), went from 46% in 2004 (mean of 8 records) to 60% in 2017 (mean of 4 records). The most recent nearby survey is from 2017, so these values predate recent heat stress. This site's own estimate (36%) sits within the range of these station-year means up to 2 km away (24–60%); the methods differ, so the comparison is context, not a like-for-like test.
Collected by other programs using different methods (Reef Check uses point-intercept transects; the XL Catlin Seaview Survey uses photo-transects with automated image annotation), so these are context for the figures above, not a like-for-like comparison. Where a station was surveyed more than once, the cell shows either the range of its values or, as a single value, the mean of surveys made in one year. Station names are not dive-site names.
| Agency | Site / location | Date | Hard coral cover (%) | Distance | Link |
|---|---|---|---|---|---|
| Kramer & Bischof 2003 | Karpata [10 m] | 1999 | 44% | 0.08 km | — |
| Reef Check | Karpata Reserve | 2000–2003 | 24–34% (range of yearly means; 8 surveys) | 0.81 km | — |
| Steneck et al. (2019) | Karpata | 2004–2017 | 39–60% (range of yearly means; 32 records) | 0.23 km | doi:10.3389/fmars.2019.00265 |
| Stokes et al. 2010 | Karpata (Bonaire Marine Park mooring) [2008 - 5 m] | 2008 | 36% | 0.08 km | doi:10.5479/si.00775630.582.1 |
| Stokes et al. 2010 | Karpata (Bonaire Marine Park mooring) [2008 - 10 m] | 2008 | 42% | 0.08 km | doi:10.5479/si.00775630.582.1 |
| Stokes et al. 2010 | Karpata (Bonaire Marine Park mooring) [2008 - 15 m] | 2008 | 31% | 0.08 km | doi:10.5479/si.00775630.582.1 |
| XL Catlin Seaview Survey | transect 17039 | 2013 | 25% | 0.09 km | doi:10.14264/uql.2019.930 |
| Steneck et al. (2019) | No-Dive Reserve | 2013–2017 | 45–54% (range of yearly means; 12 records) | 1.95 km | doi:10.3389/fmars.2019.00265 |
| XL Catlin Seaview Survey | transect 17038 | 2013 | 20% | 2.33 km | doi:10.14264/uql.2019.930 |
| XL Catlin Seaview Survey | transect 17046 | 2013 | 26% | 4.29 km | doi:10.14264/uql.2019.930 |
Data & links
All images from Coral Reef Diagnostics. Data are from Coral Reef Diagnostics and the organizations named in the data sources above.
© Coral Reef Diagnostics.
References
- Kramer P, Bischof BG (2003). AGRRA Data. Assessment Tables for Abaco, Bahamas (Fishes), Lighthouse Belize(Corals, Algae, Fishes) and Bonaire, Netherlands Antilles (Corals, Algae, Fishes). Atoll Research Bulletin 496:590-597. DOI
- Steneck RS, Arnold SN, Boenish R, de León R, Mumby PJ, Rasher DB, et al. (2019). Managing Recovery Resilience in Coral Reefs Against Climate-Induced Bleaching and Hurricanes: A 15 Year Case Study From Bonaire, Dutch Caribbean. Frontiers in Marine Science 6:265. PDF
- Stokes MD, Leichter JJ, Genovese SJ (2010). Long-term declines in coral cover at Bonaire, Netherlands Antilles. Atoll Research Bulletin 582:1-21. DOI
- Gonzalez-Rivero M, et al. (2019). Seaview Survey photo-quadrat and image classification dataset. The University of Queensland (UQ eSpace) data collection. DOI