
Bonaire - Chogogo
Part of the regional summary: Bonaire
More about this place: Bonaire on Wikipedia
More info
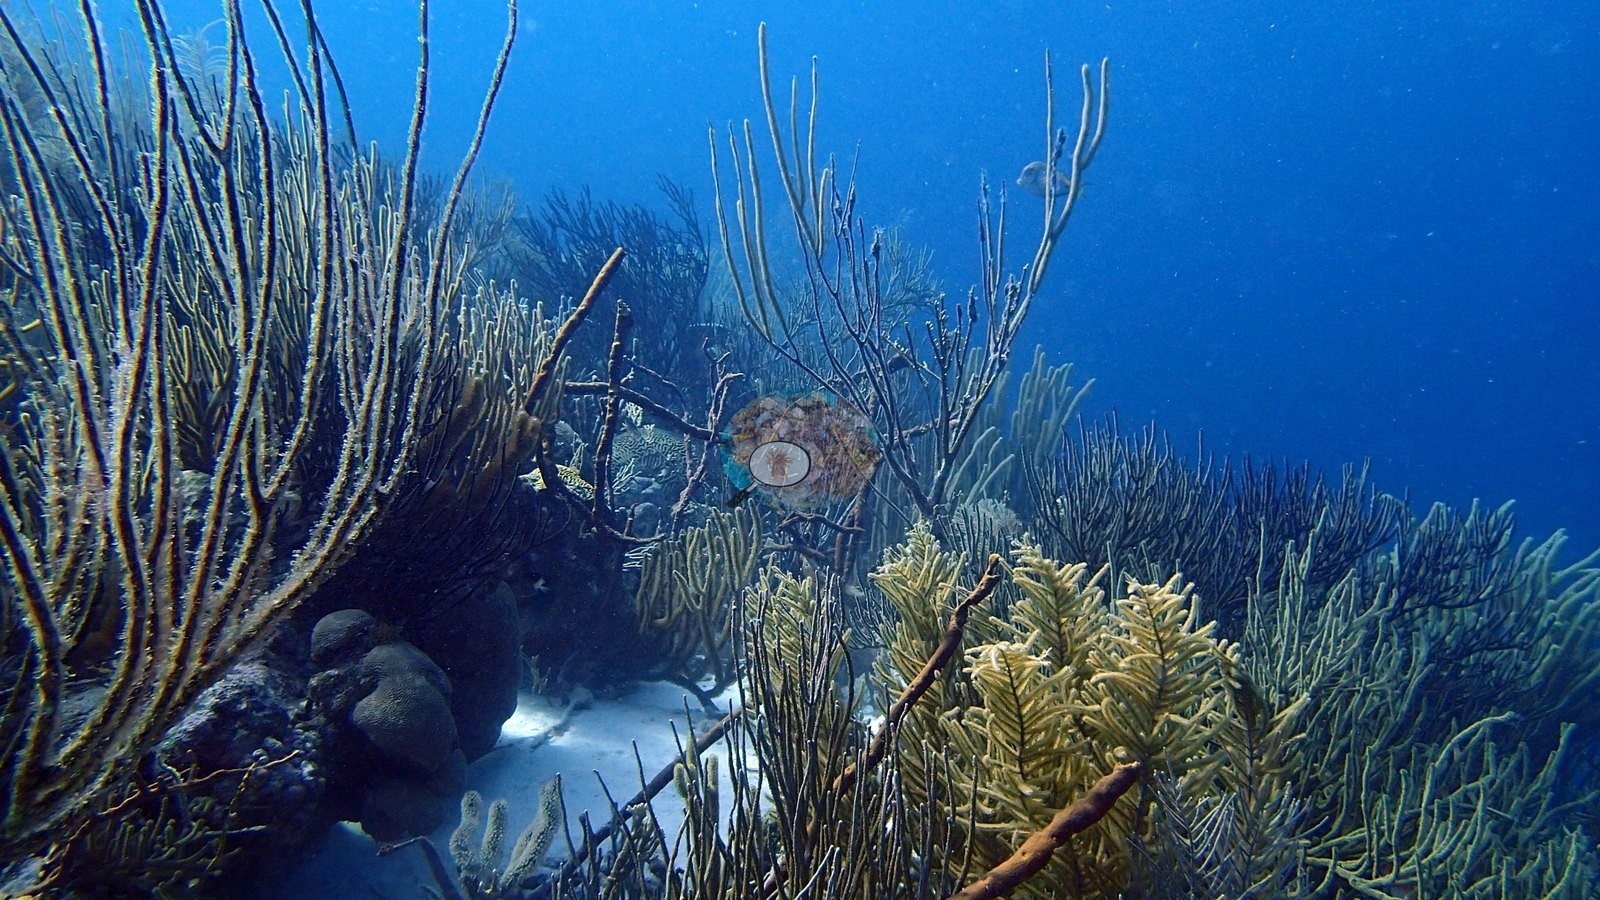
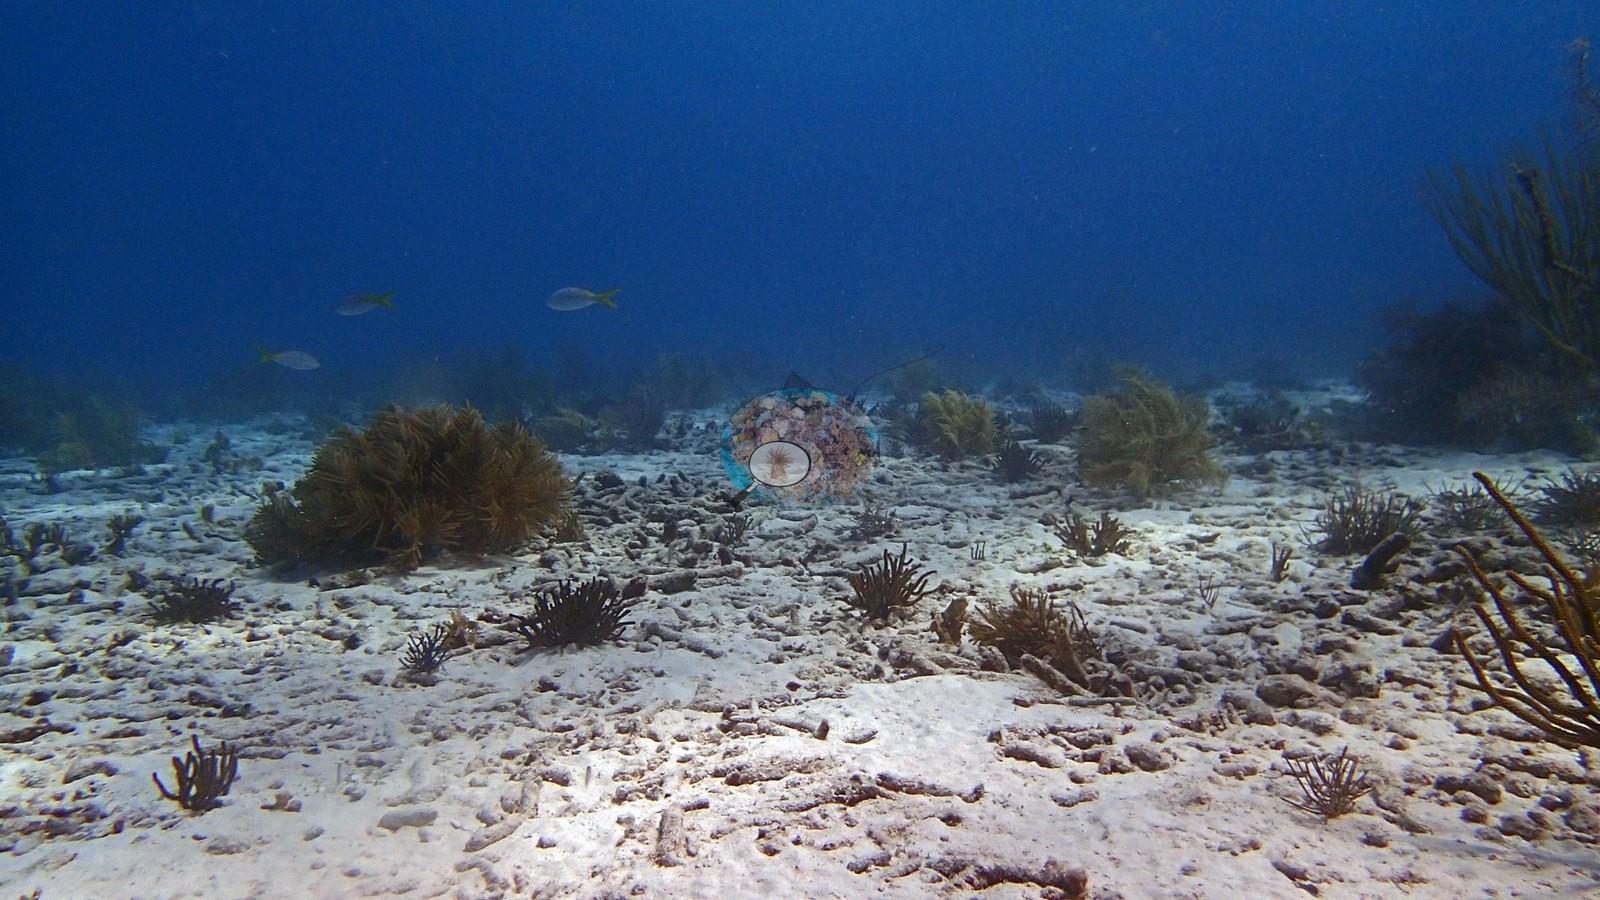
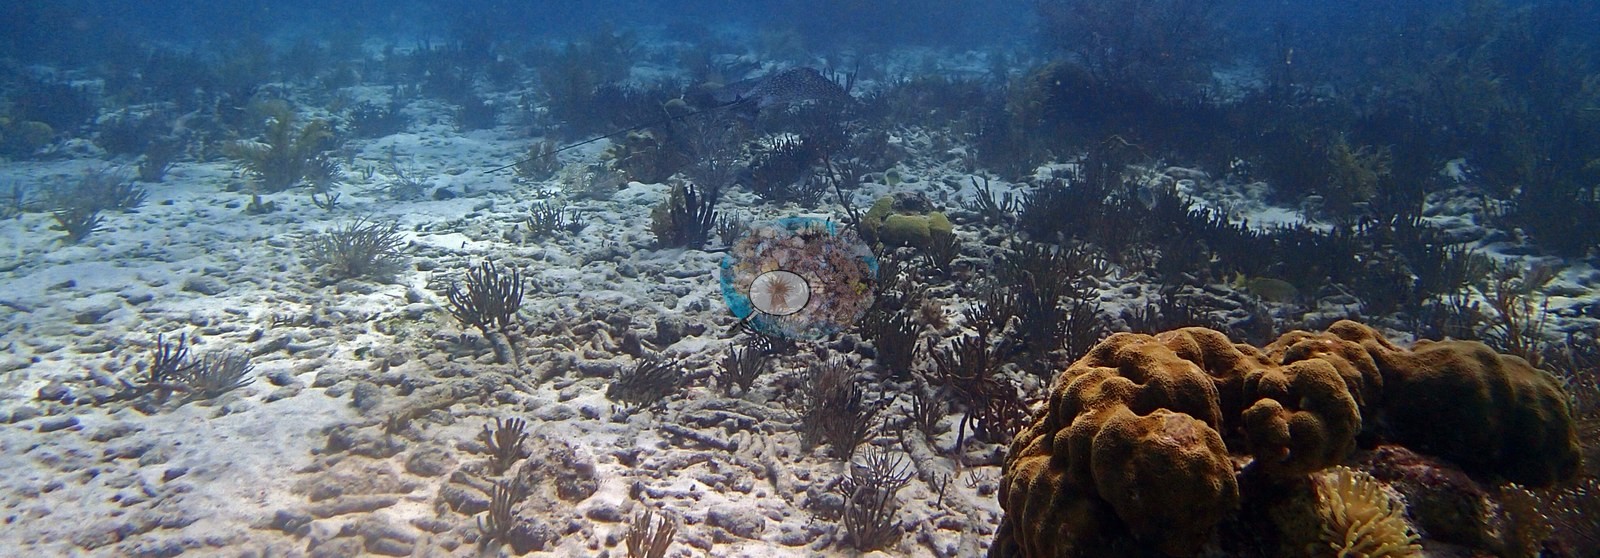
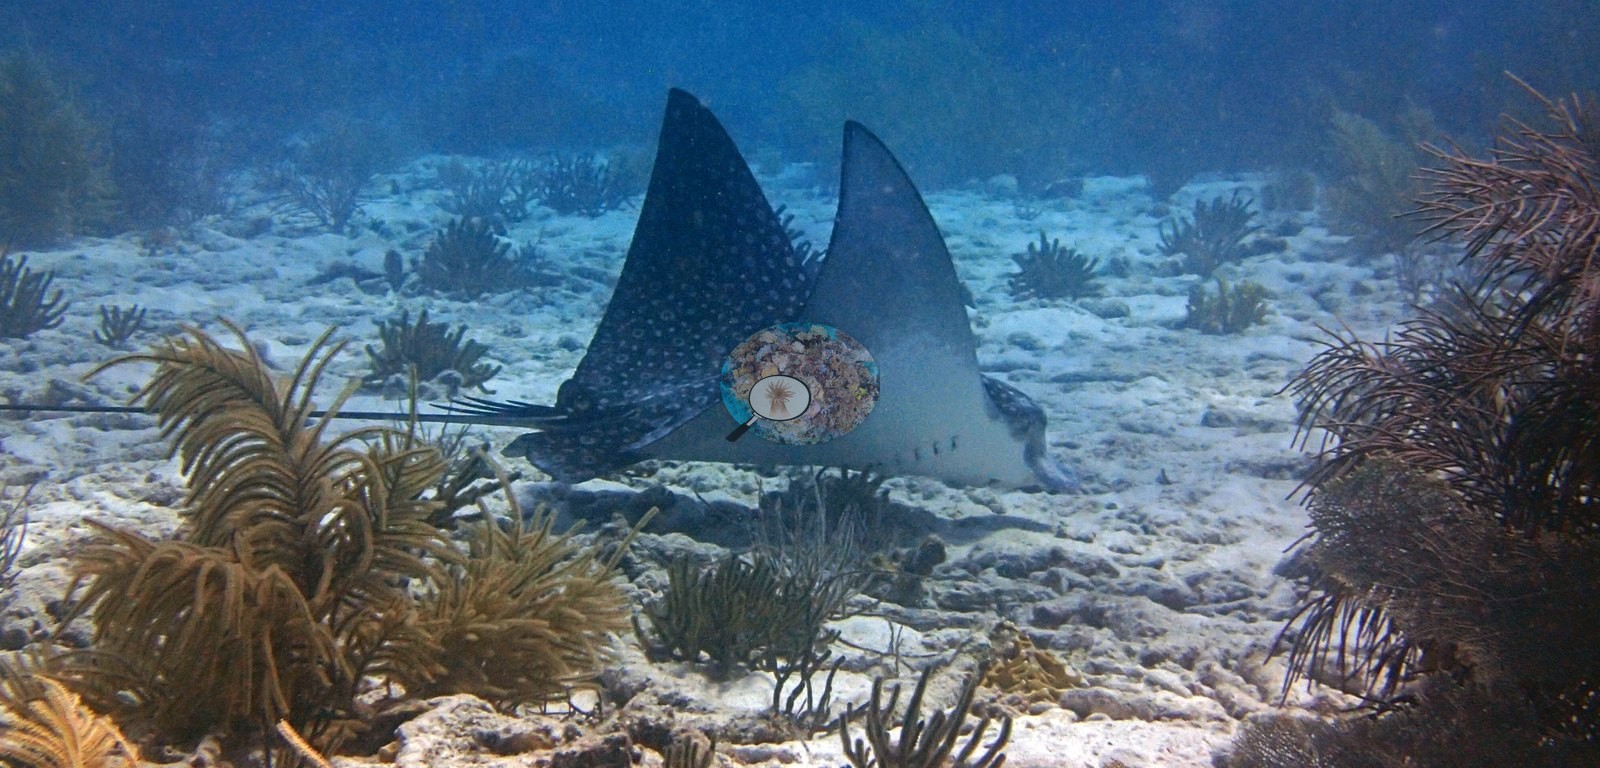
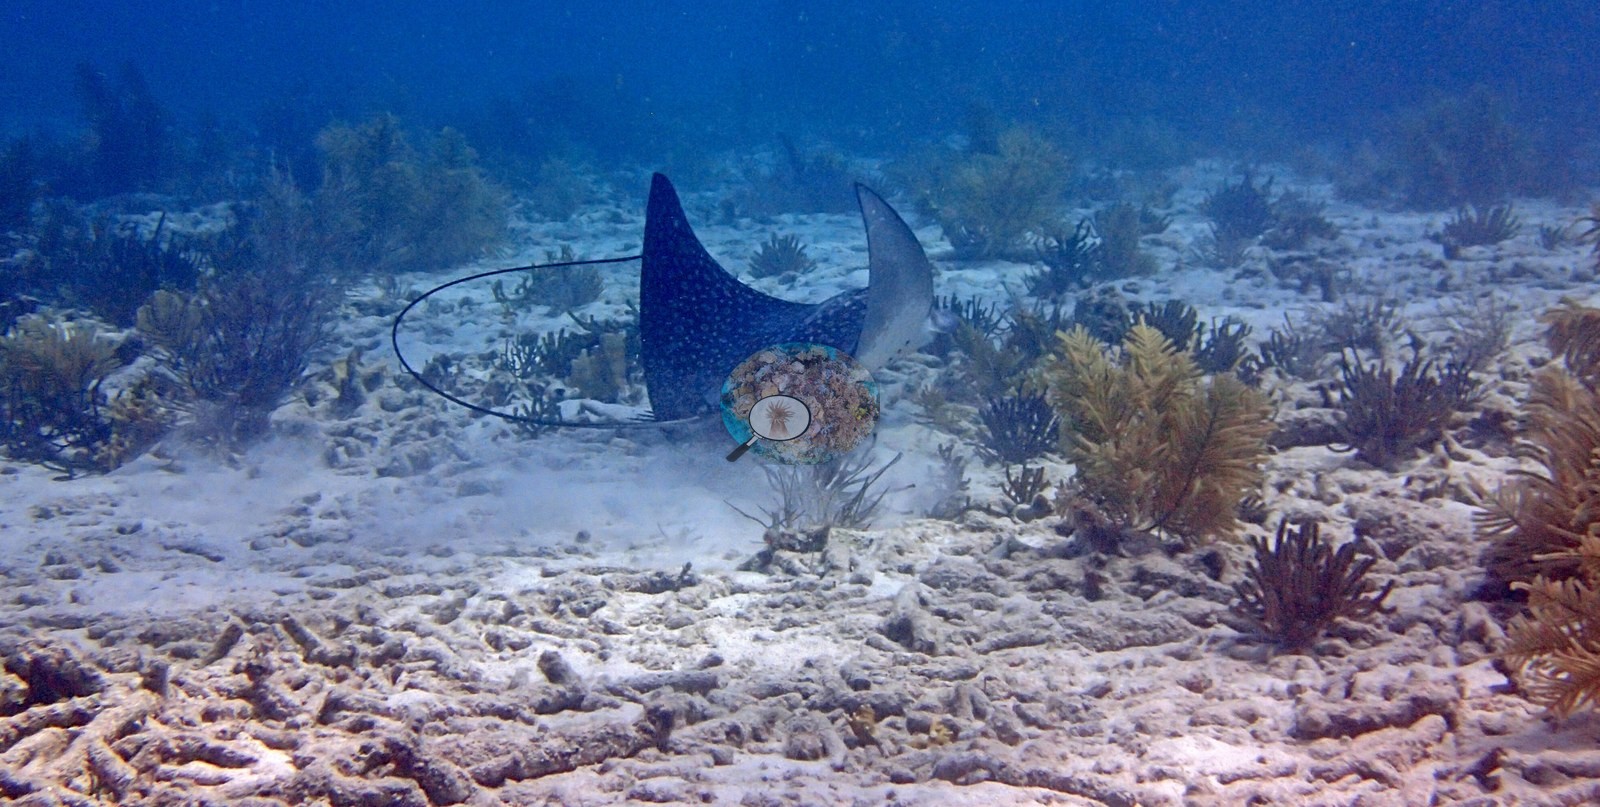
Aruba, Curacao, and Bonaire (NOAA CRW virtual station)Chogogo is a sandy-bottomed reef dominated by dense octocoral gardens — sea rods and plumes — between broad sand aprons, with scattered star, brain, and elkhorn coral, garden eels, and a pair of spotted eagle rays gliding over the sand. A blind Claude computer-vision point count puts coral cover around 10%.
Chogogo is een rif met een zandbodem, gedomineerd door dichte tuinen van octokoralen (zeestaven en zeeveren) tussen brede zandvlakten, met verspreide ster-, hersen- en elandsgeweikoralen, lintalen en een paar gevlekte adelaarsroggen die over het zand glijden. Een blinde puntentelling met Claude-computervisie schat de koraalbedekking op ongeveer 10%.
AI translation of this summary; the English is authoritative.
Two independent survey stations shown with the program’s logo — click one to see how far it is from this site.
Three other CRD dive sites with their own pages within 5 km shown in orange — click a marker to open its page.
8 of the 33 photographs on this page are shown beside the text that discusses them under "Site description" below.
Site description
Setting
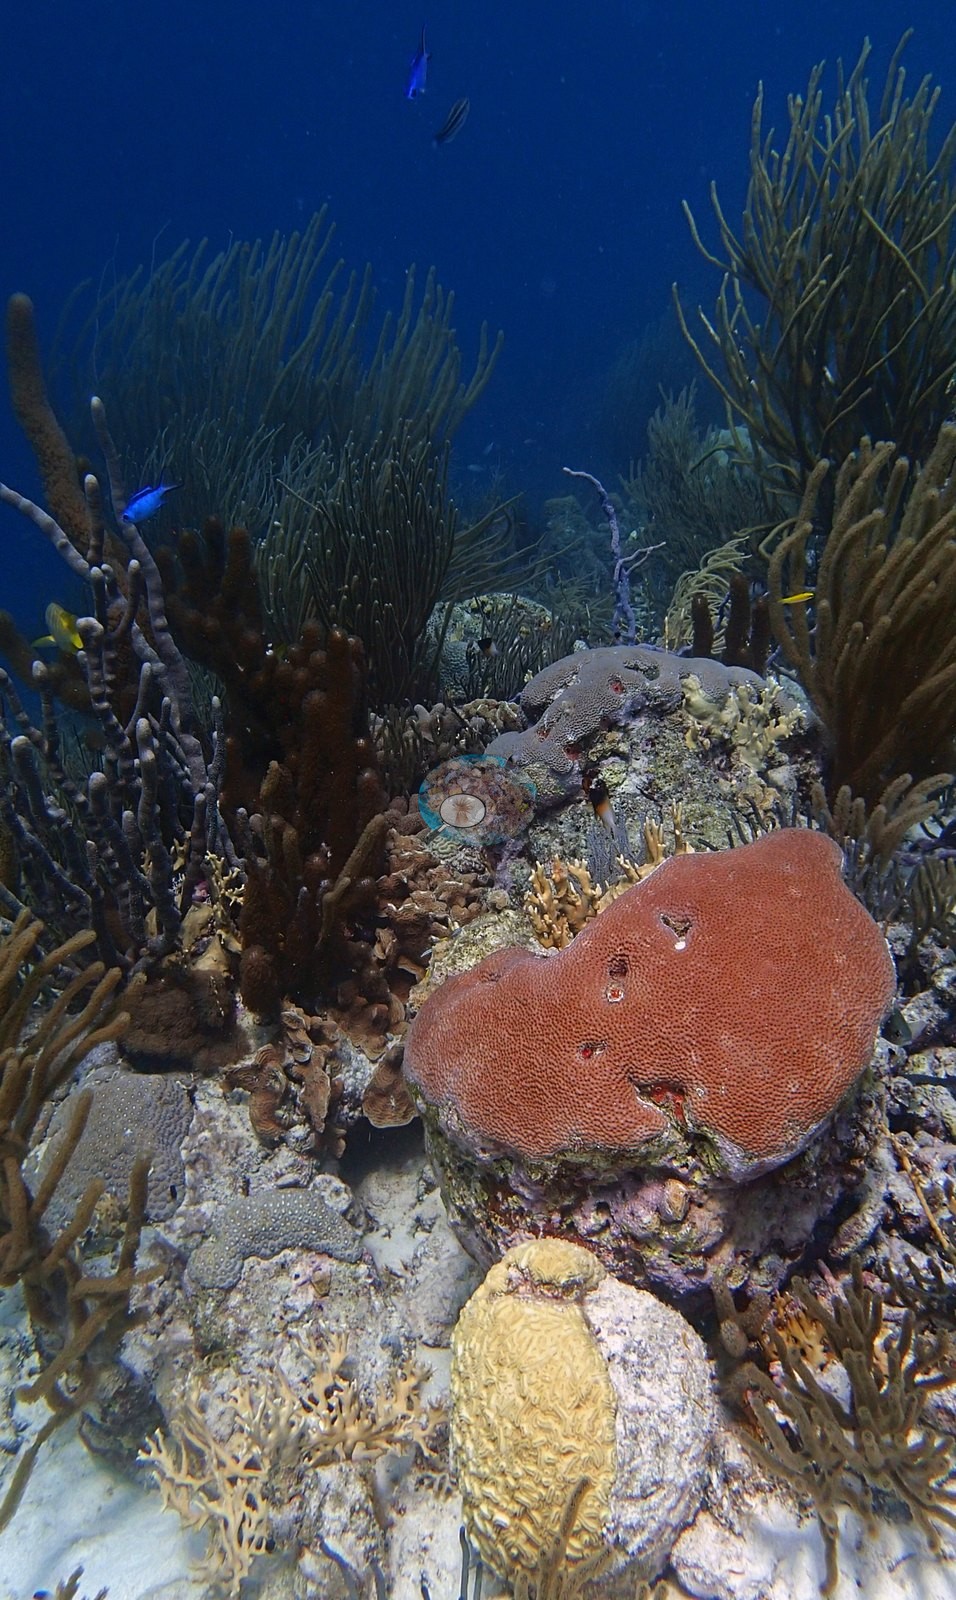
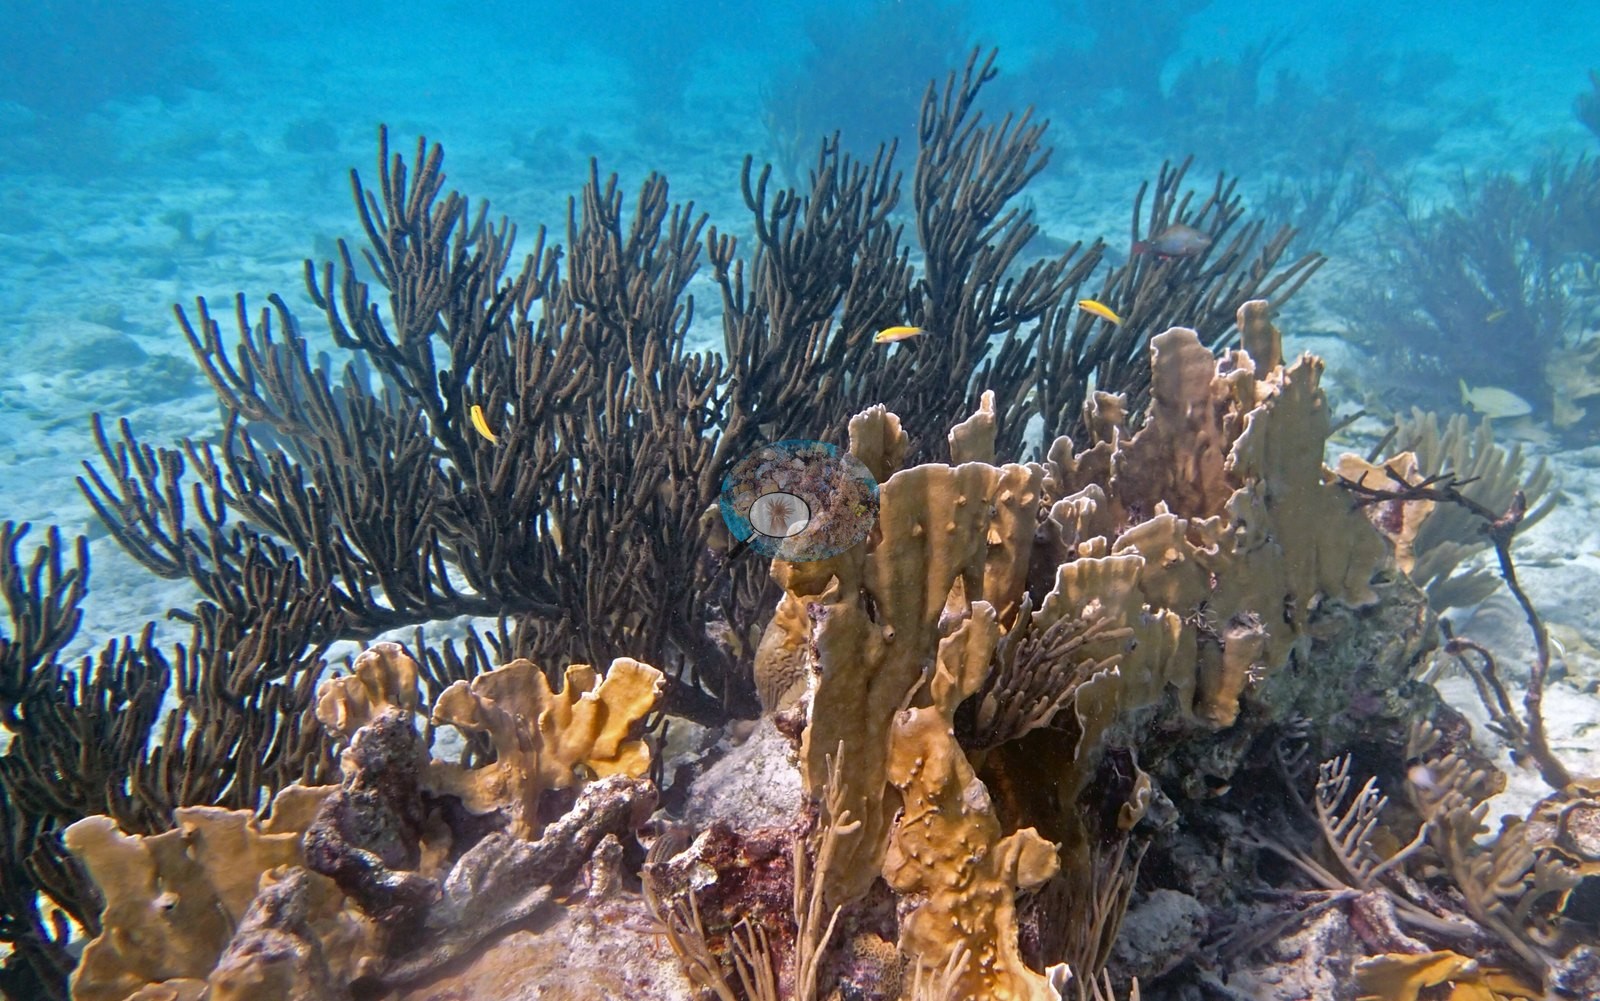
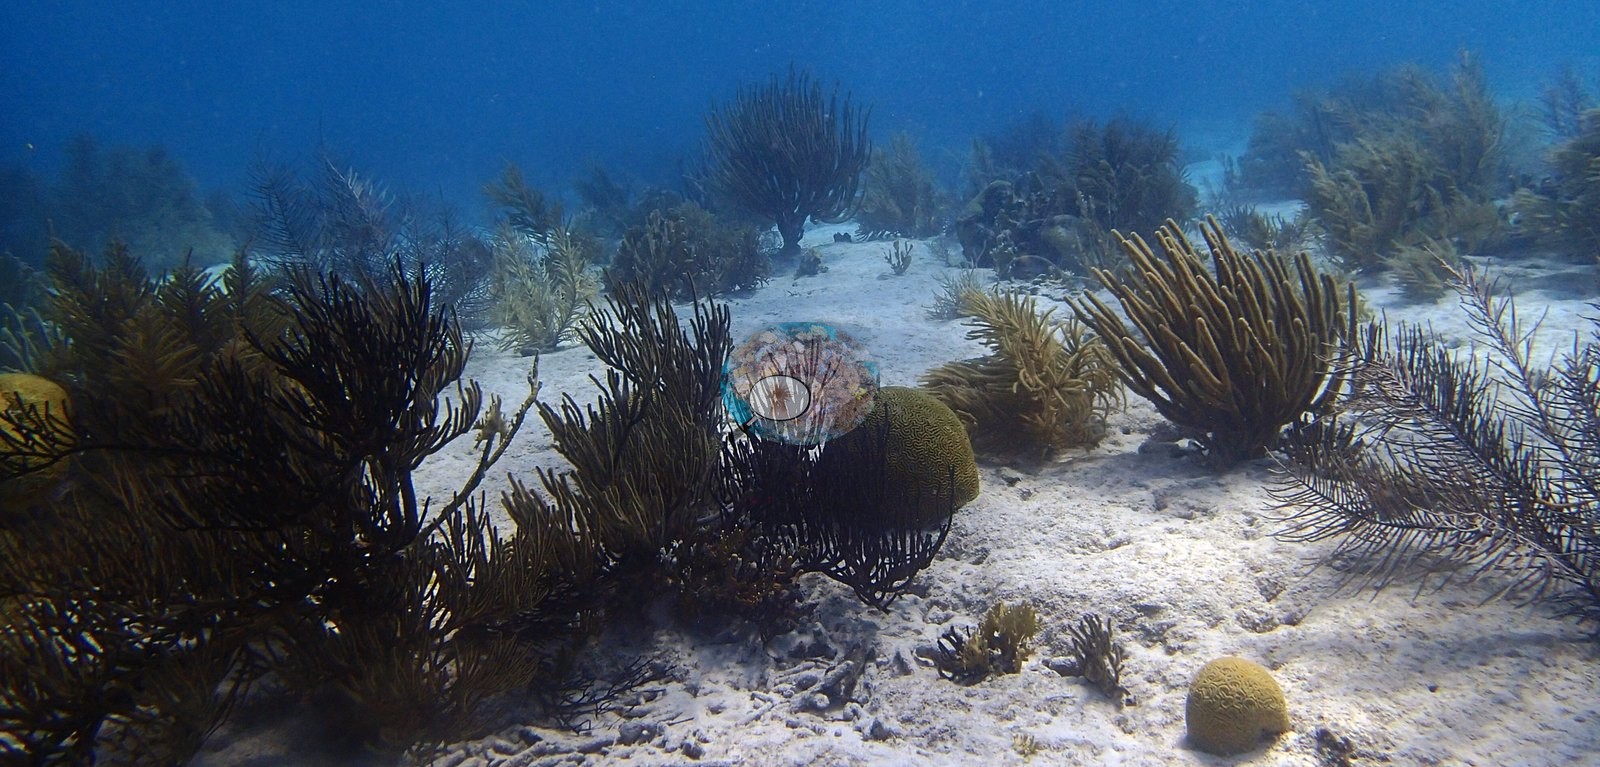
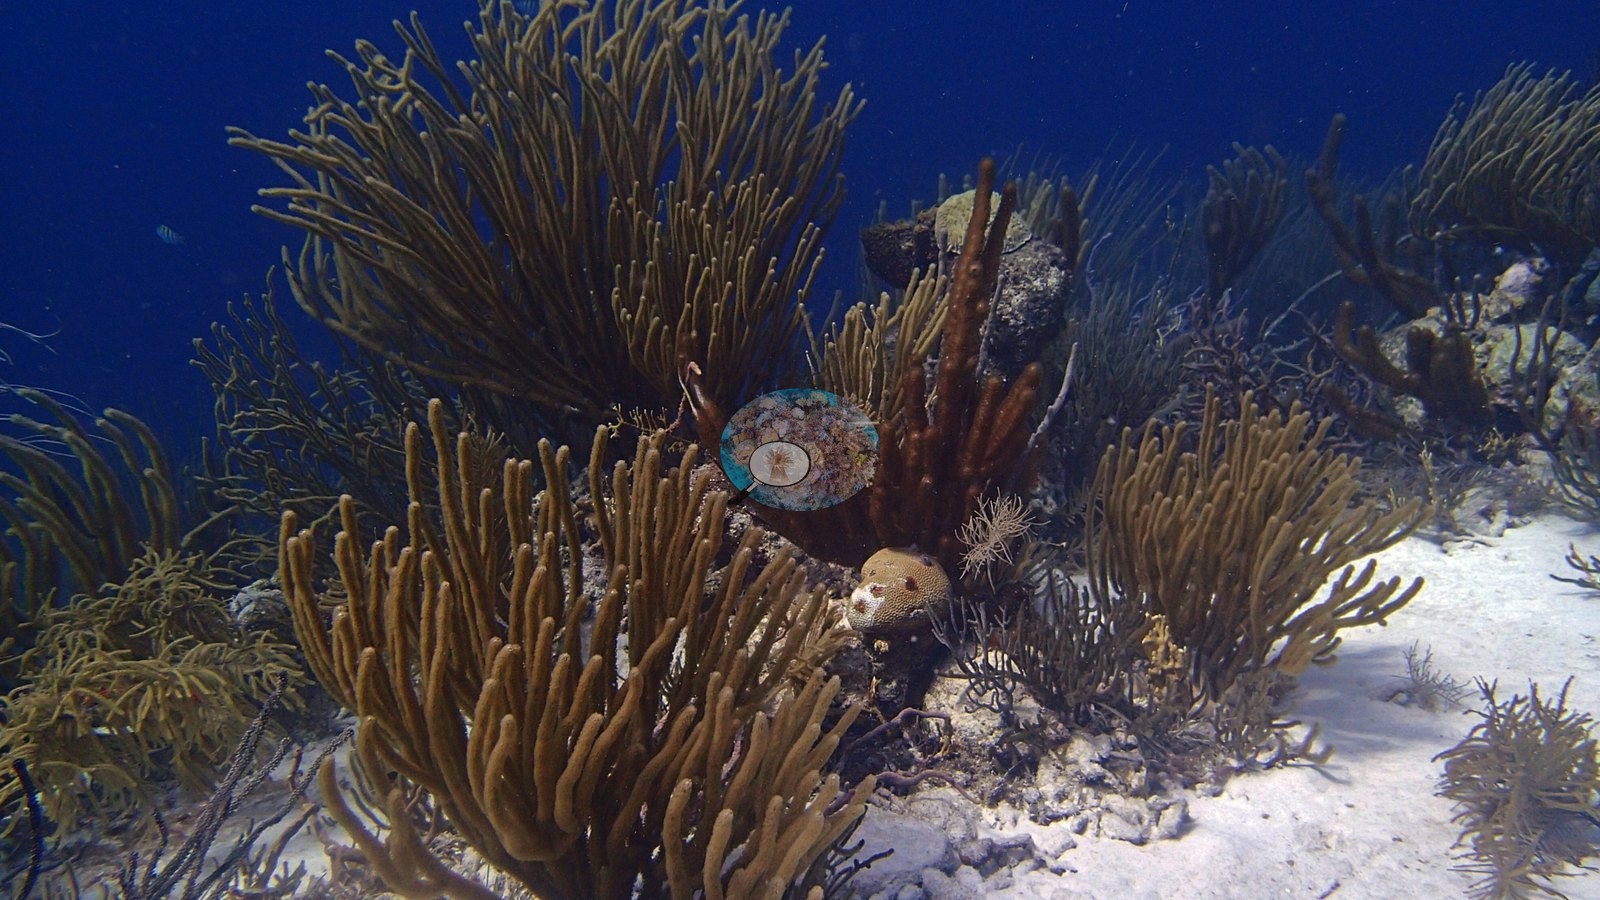
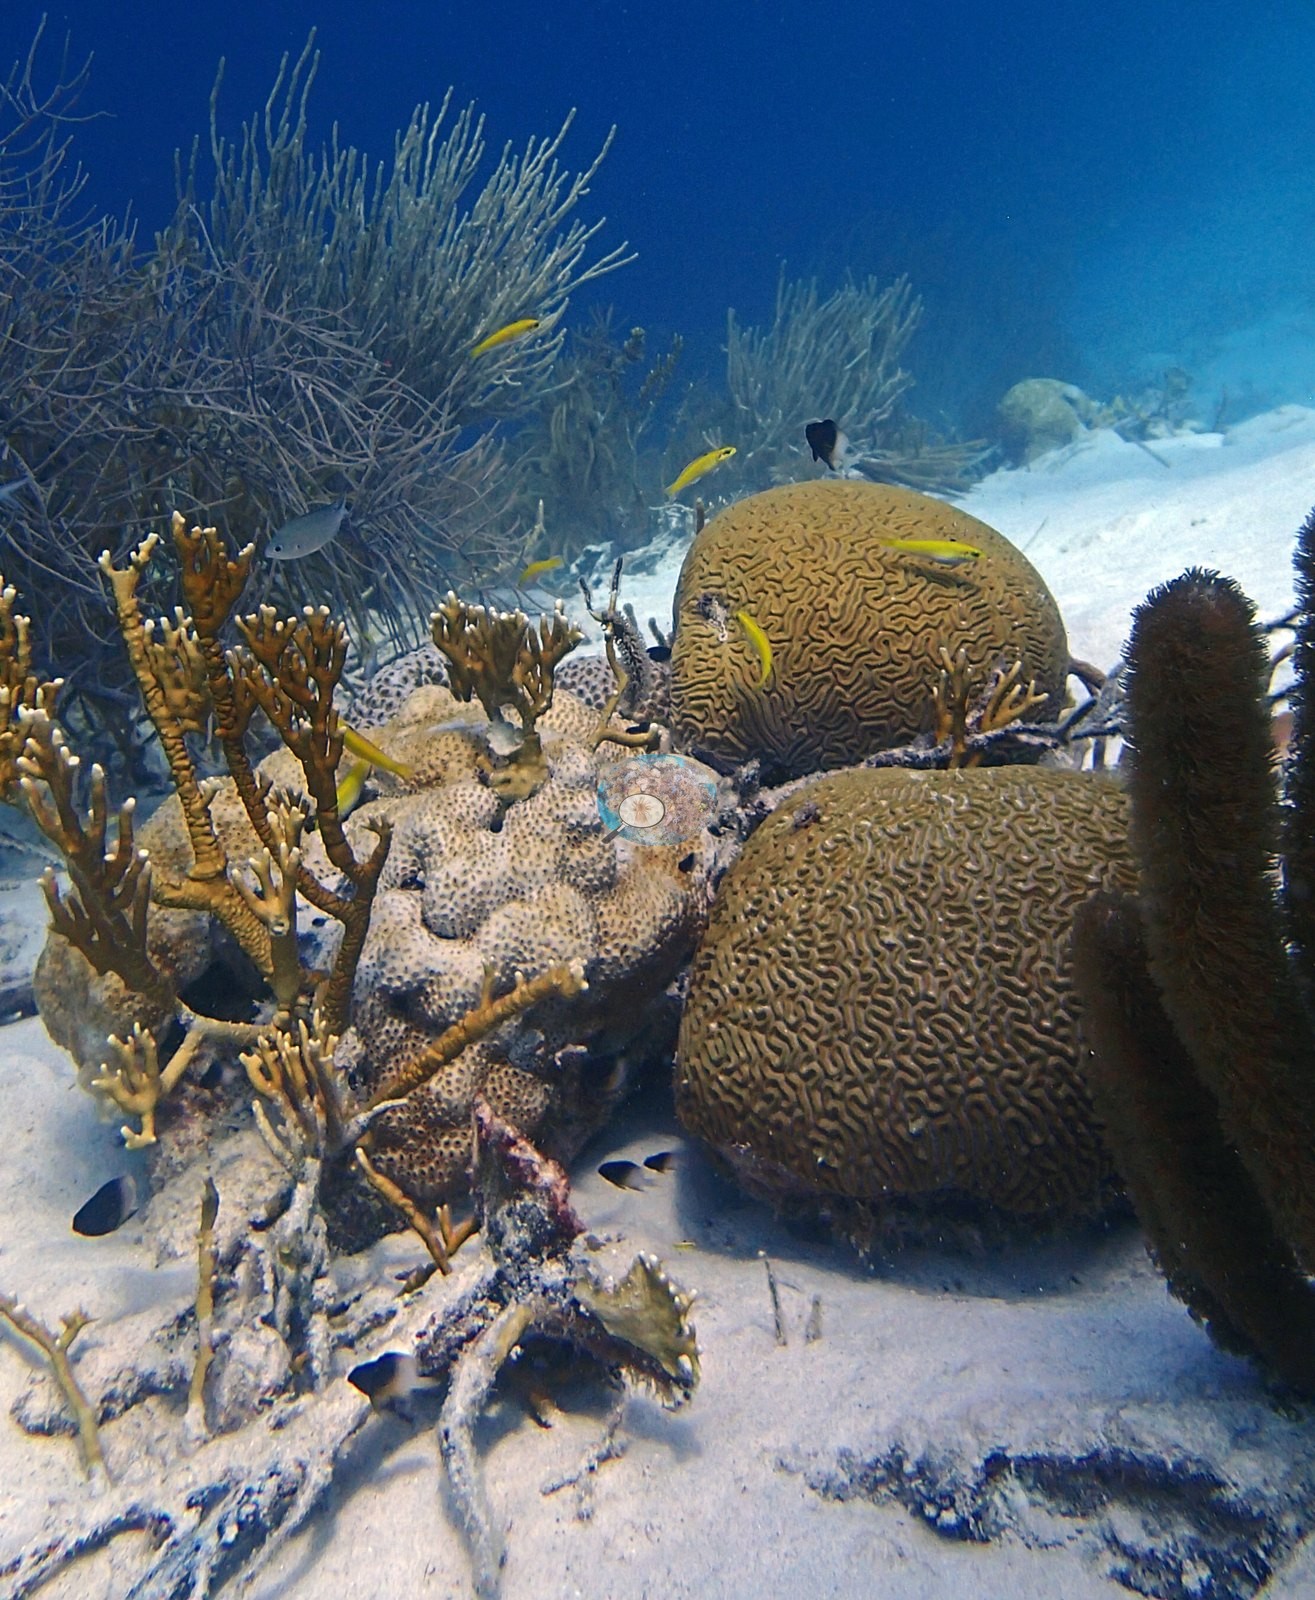
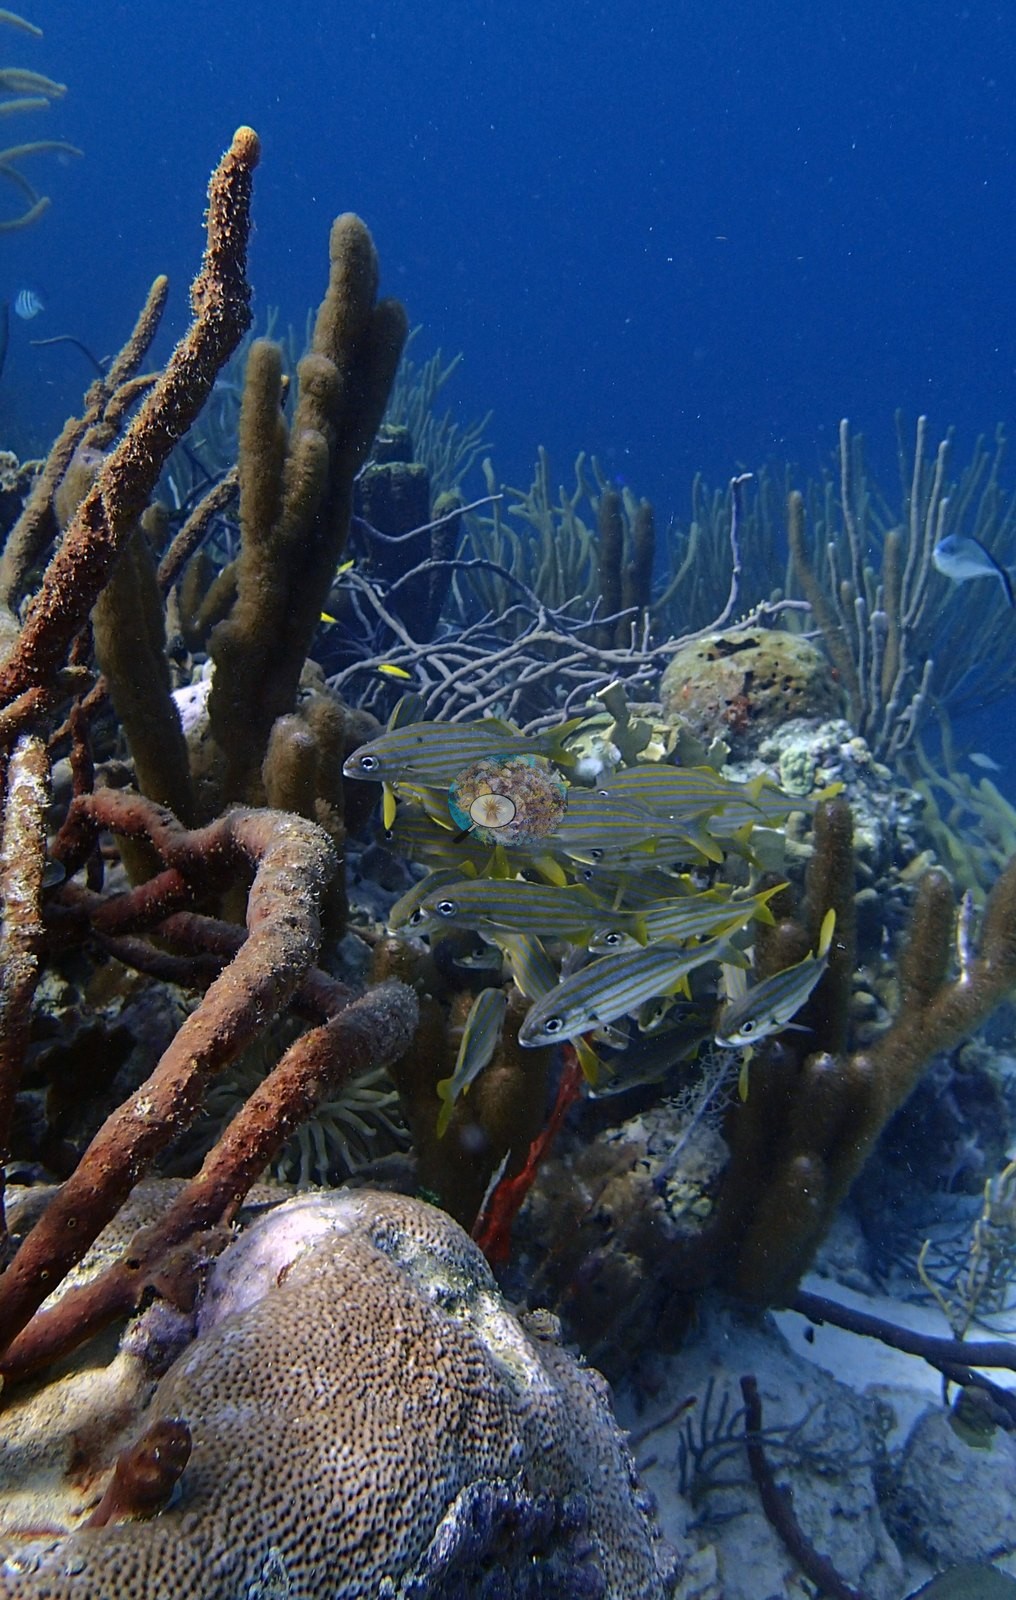
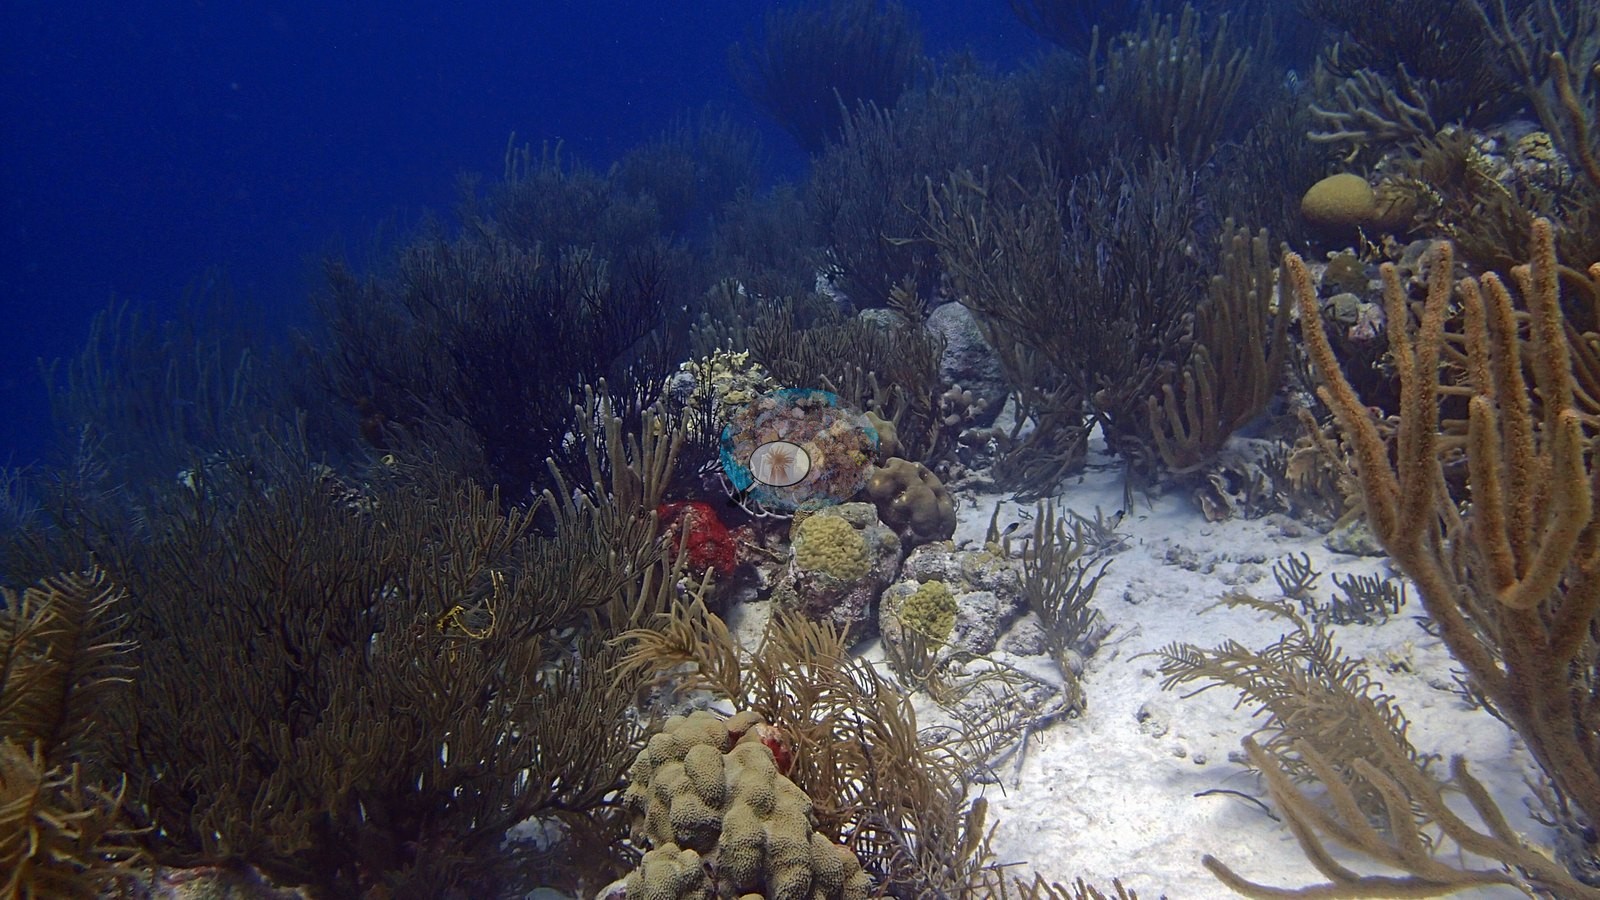
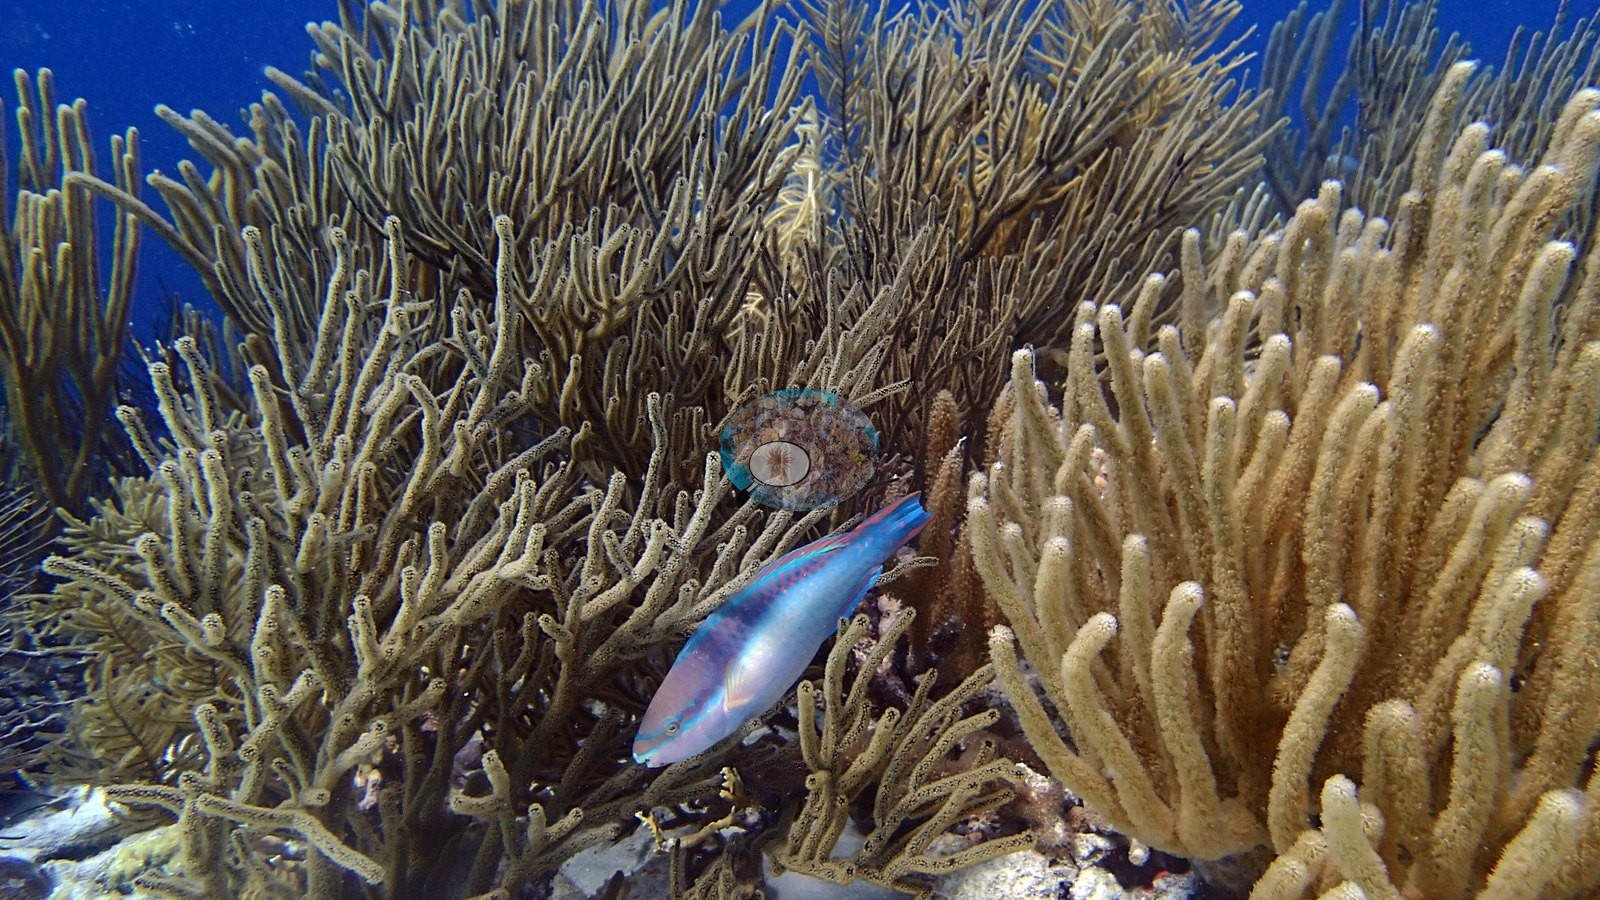
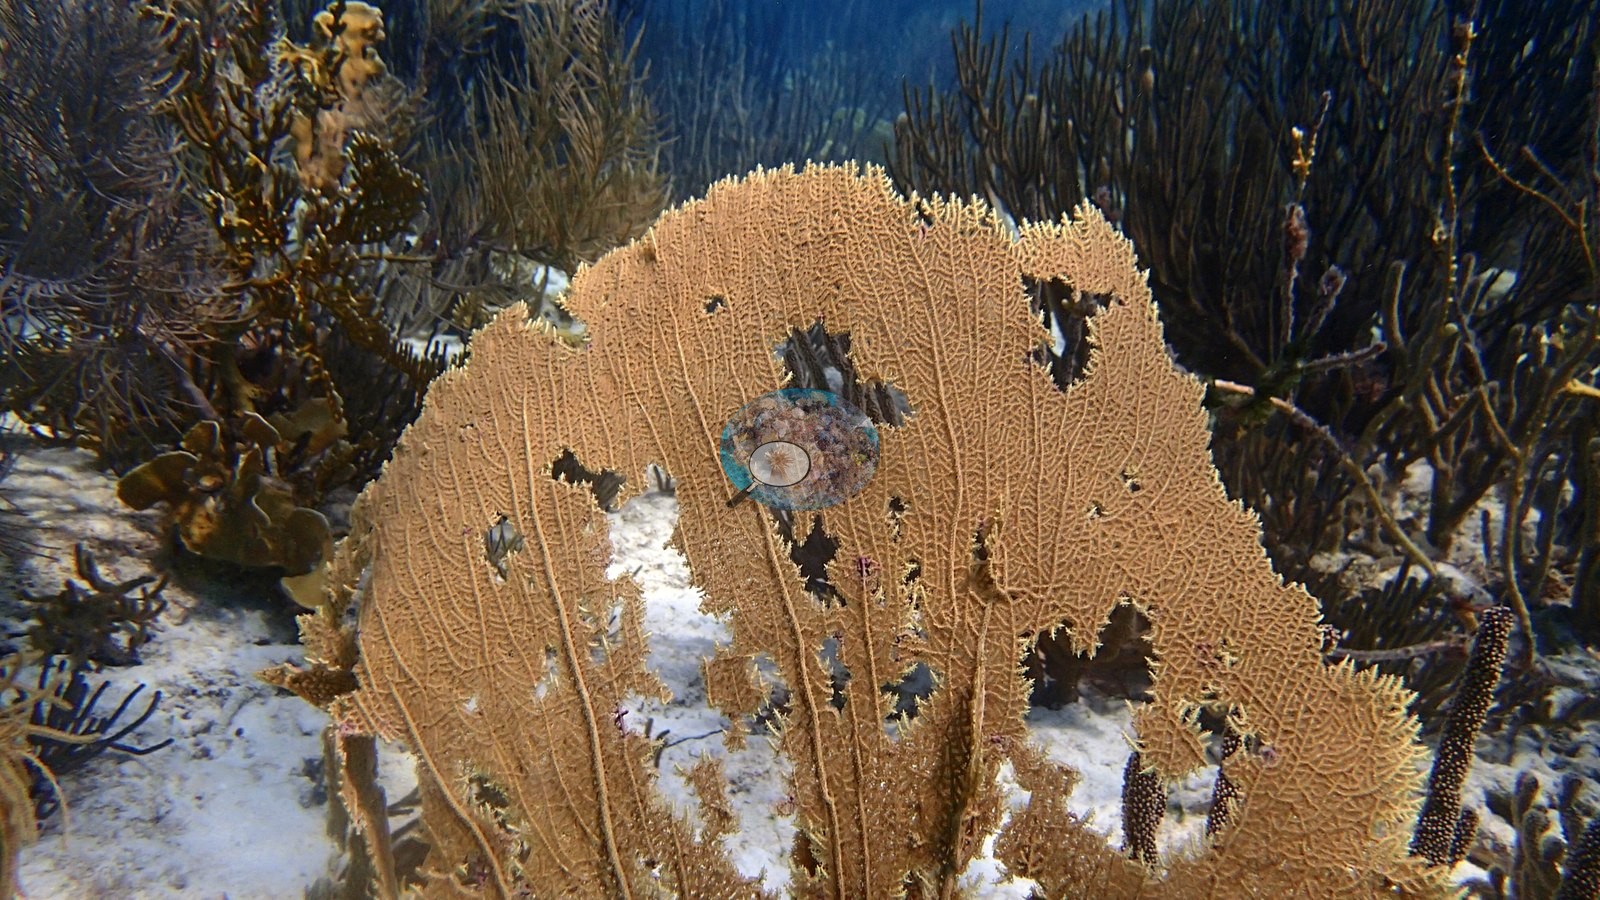
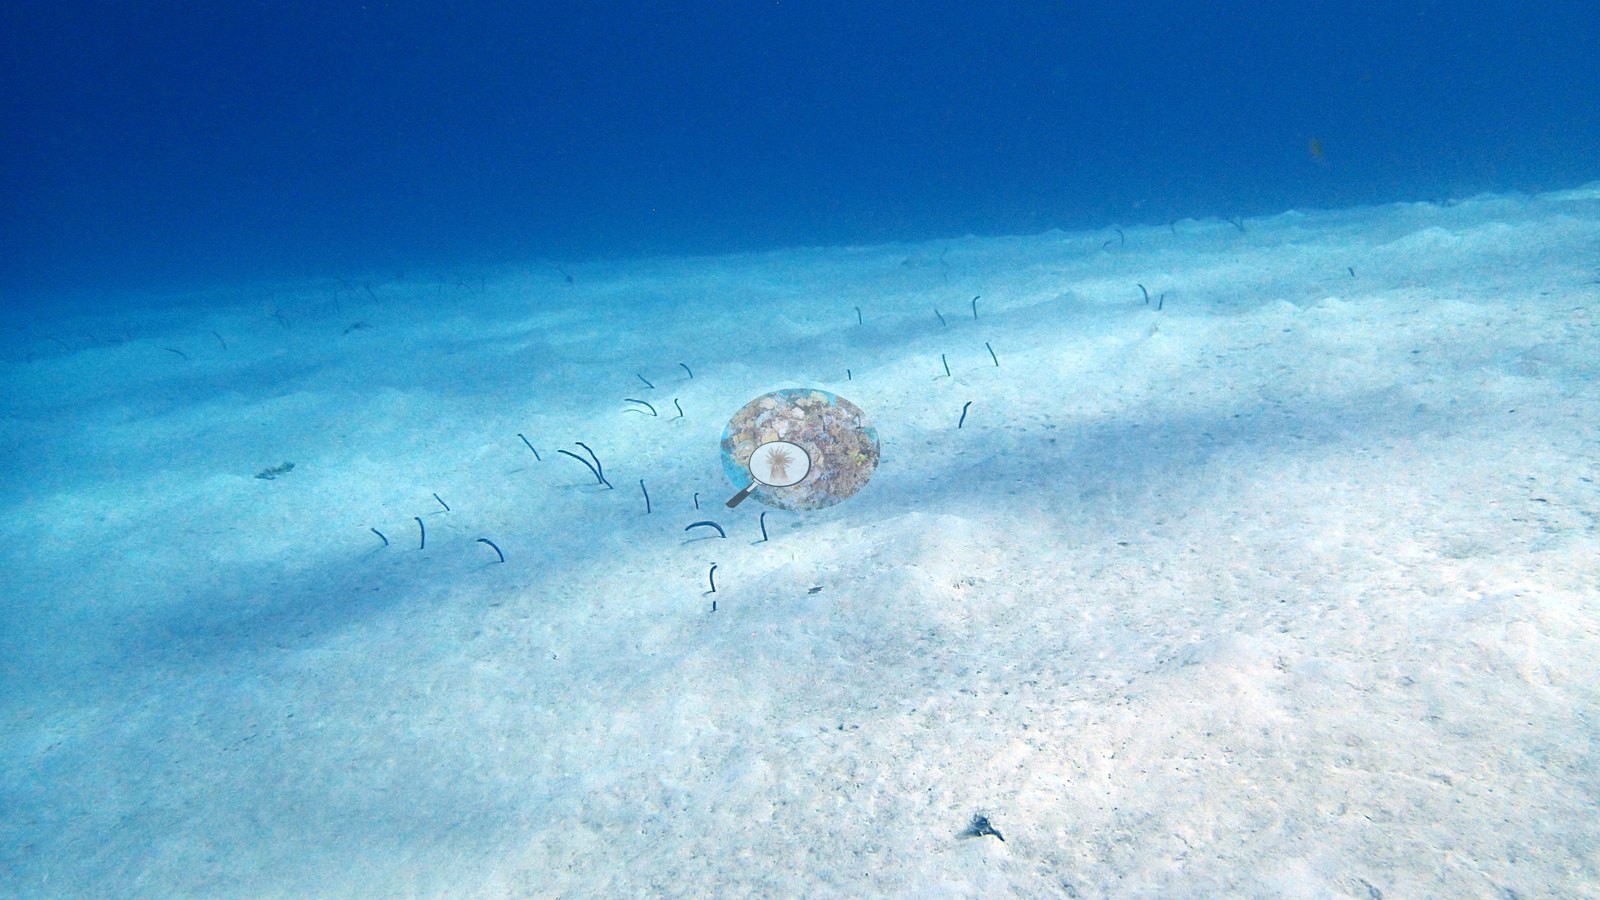
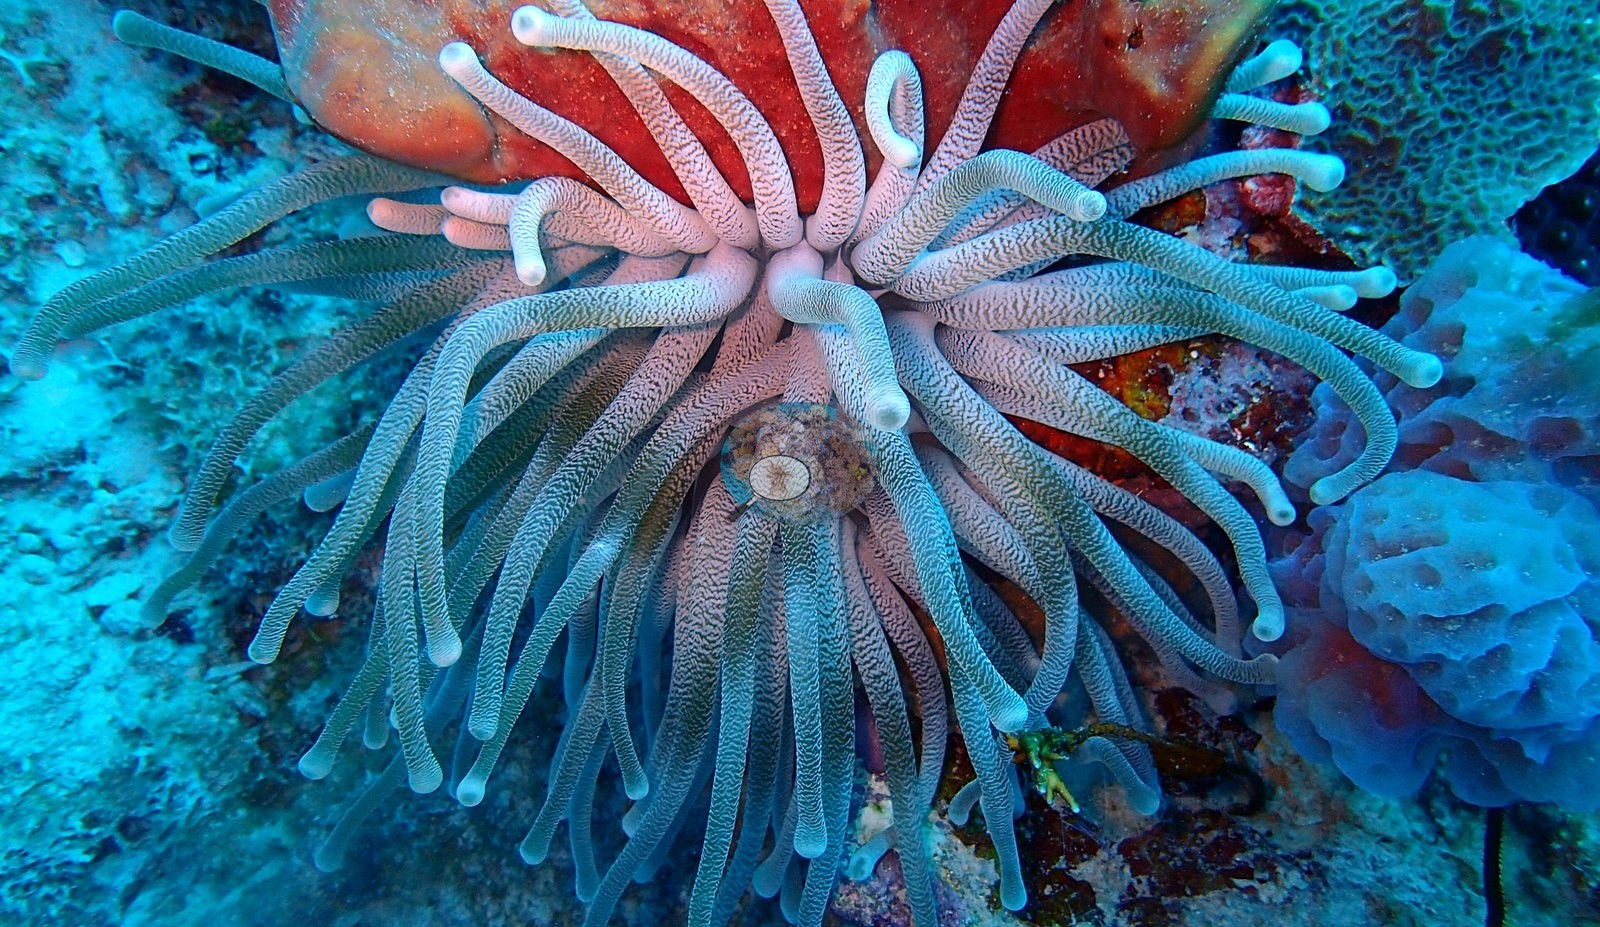
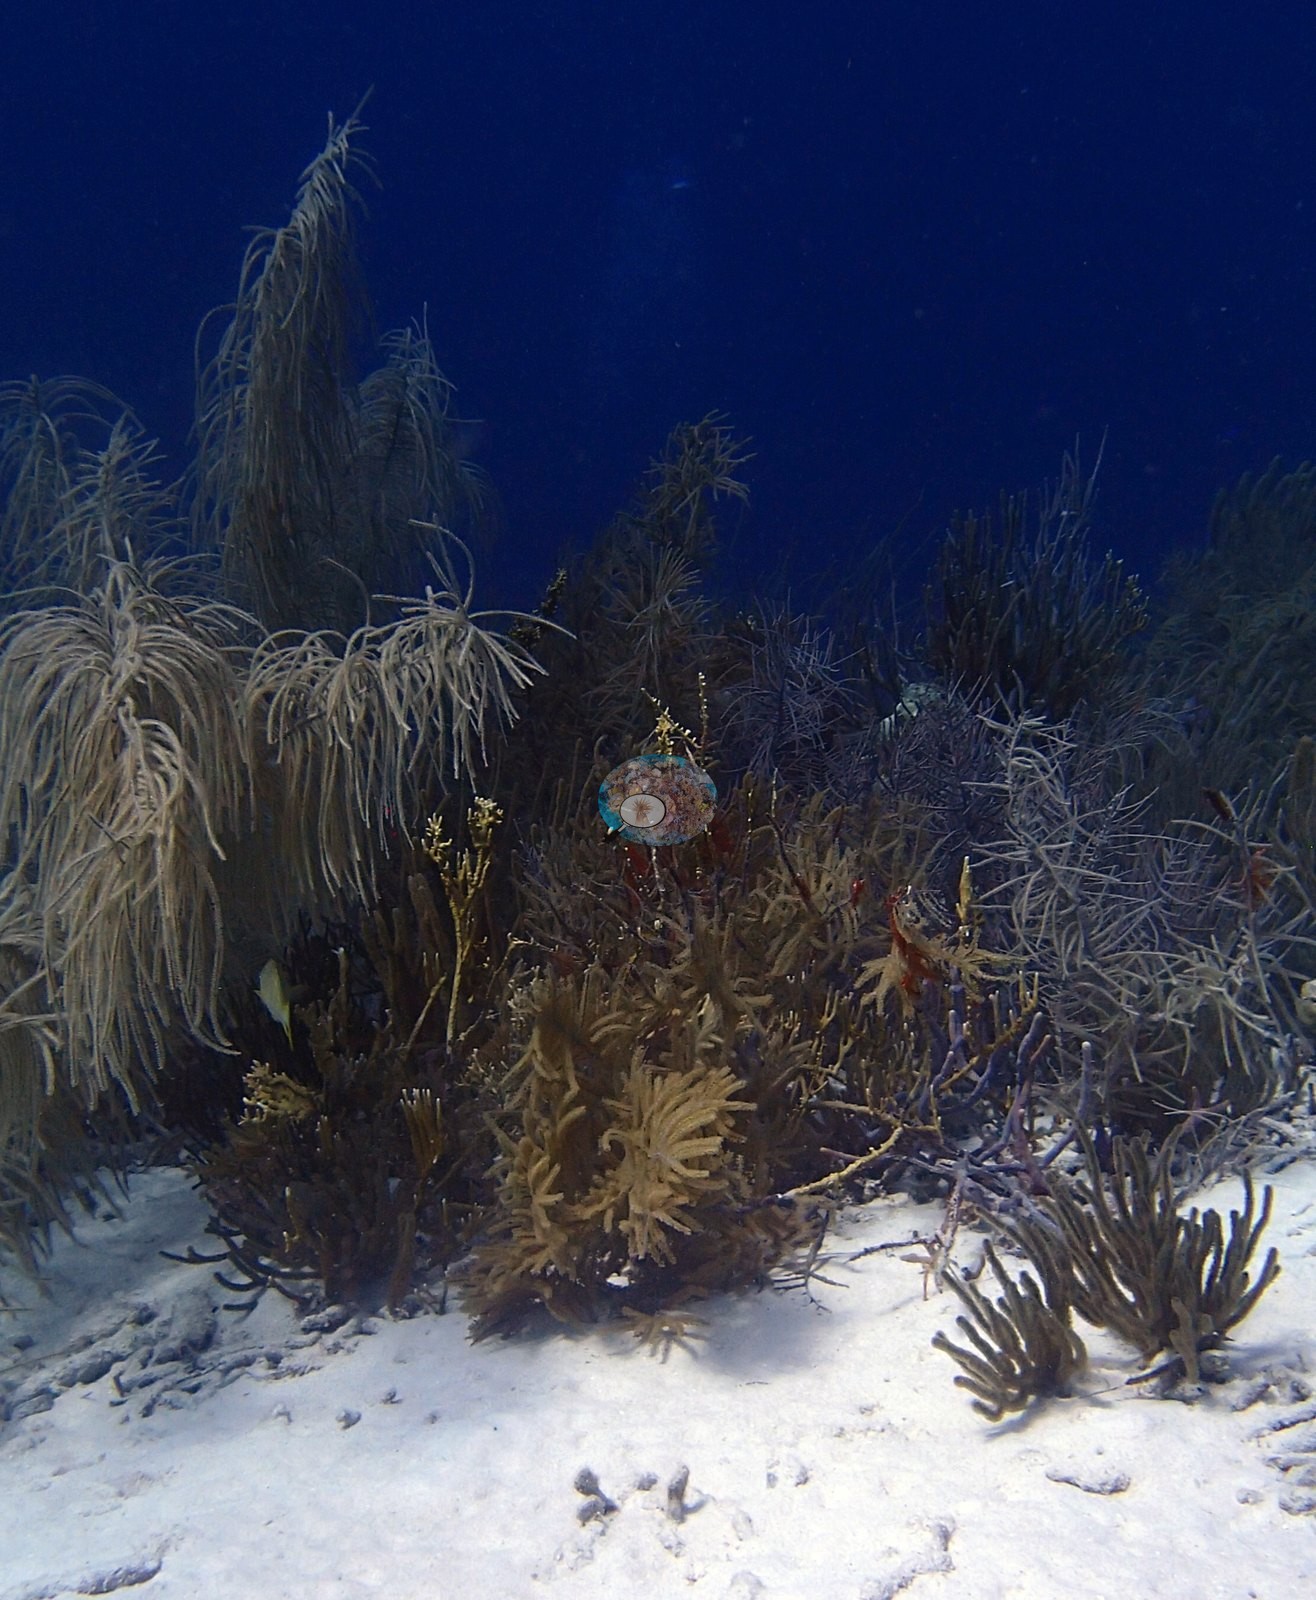
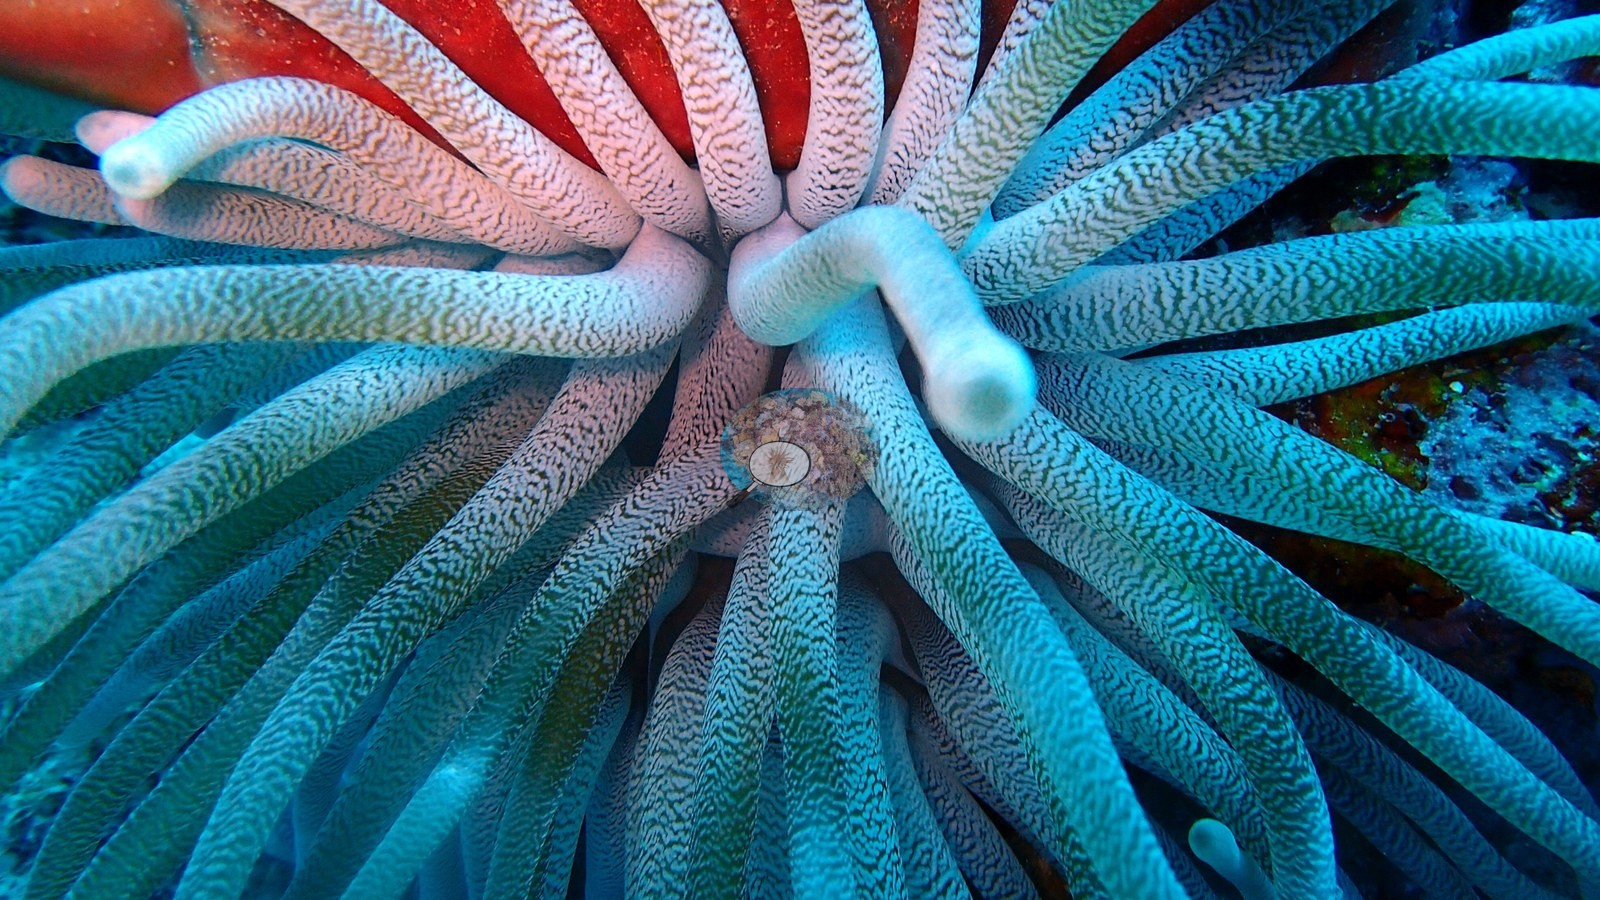
A sandy-bottomed reef with scattered coral outcrops of star and brain coral, elkhorn coral, and a dense gorgonian forest of sea rods and sea plumes, plus a vivid pink and blue giant anemone tucked in a sponge (e.g., Image 2, Image 3).
General benthic features
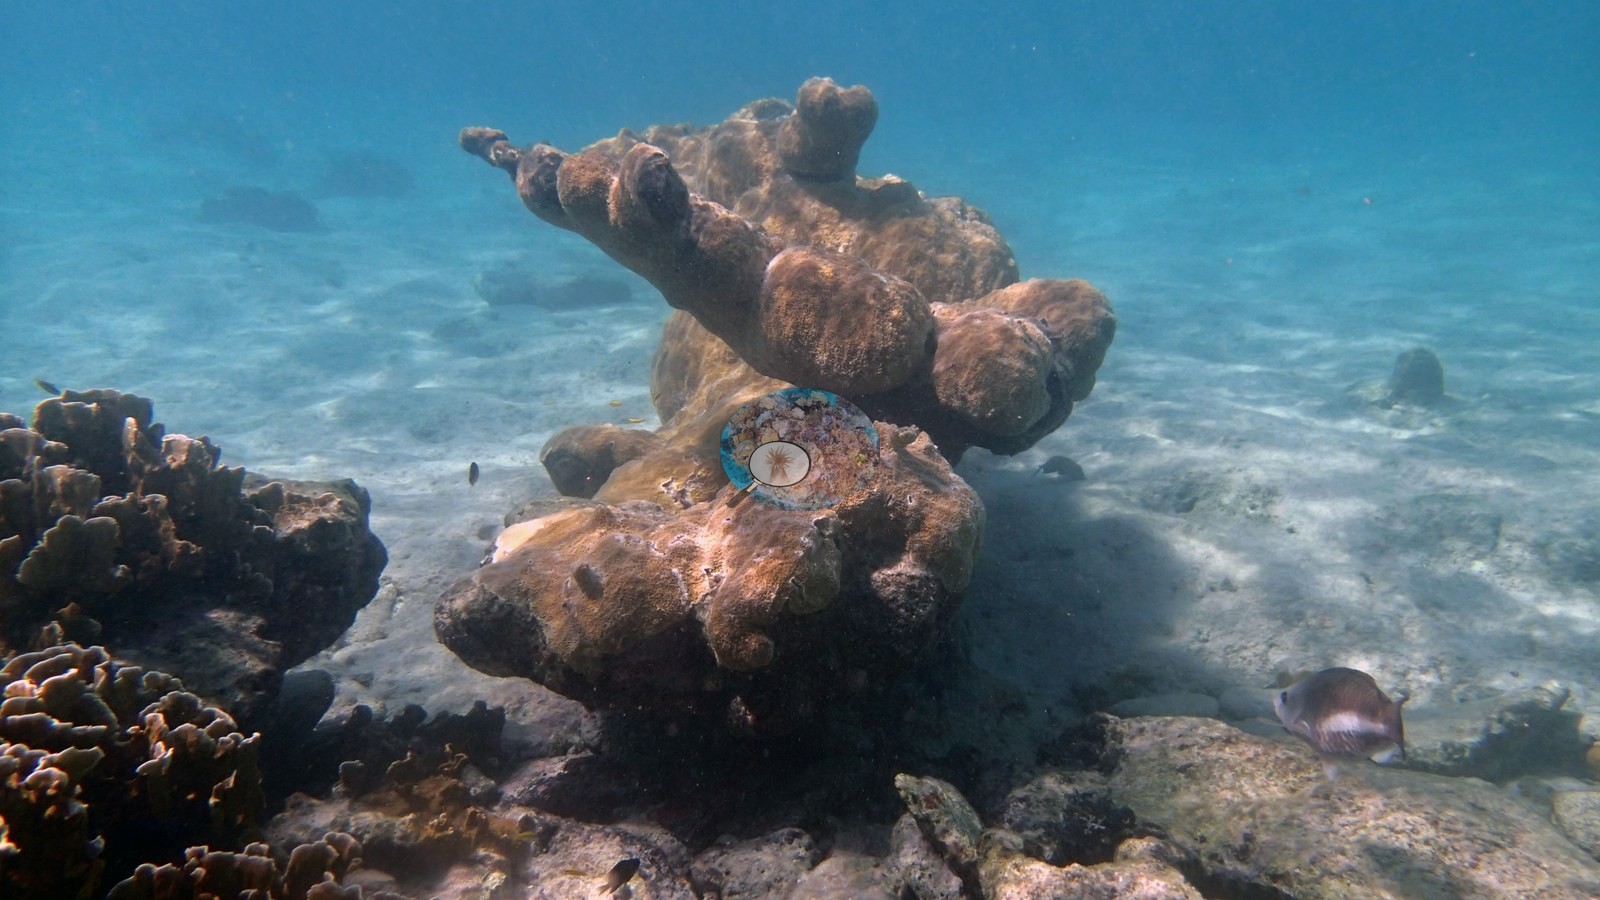
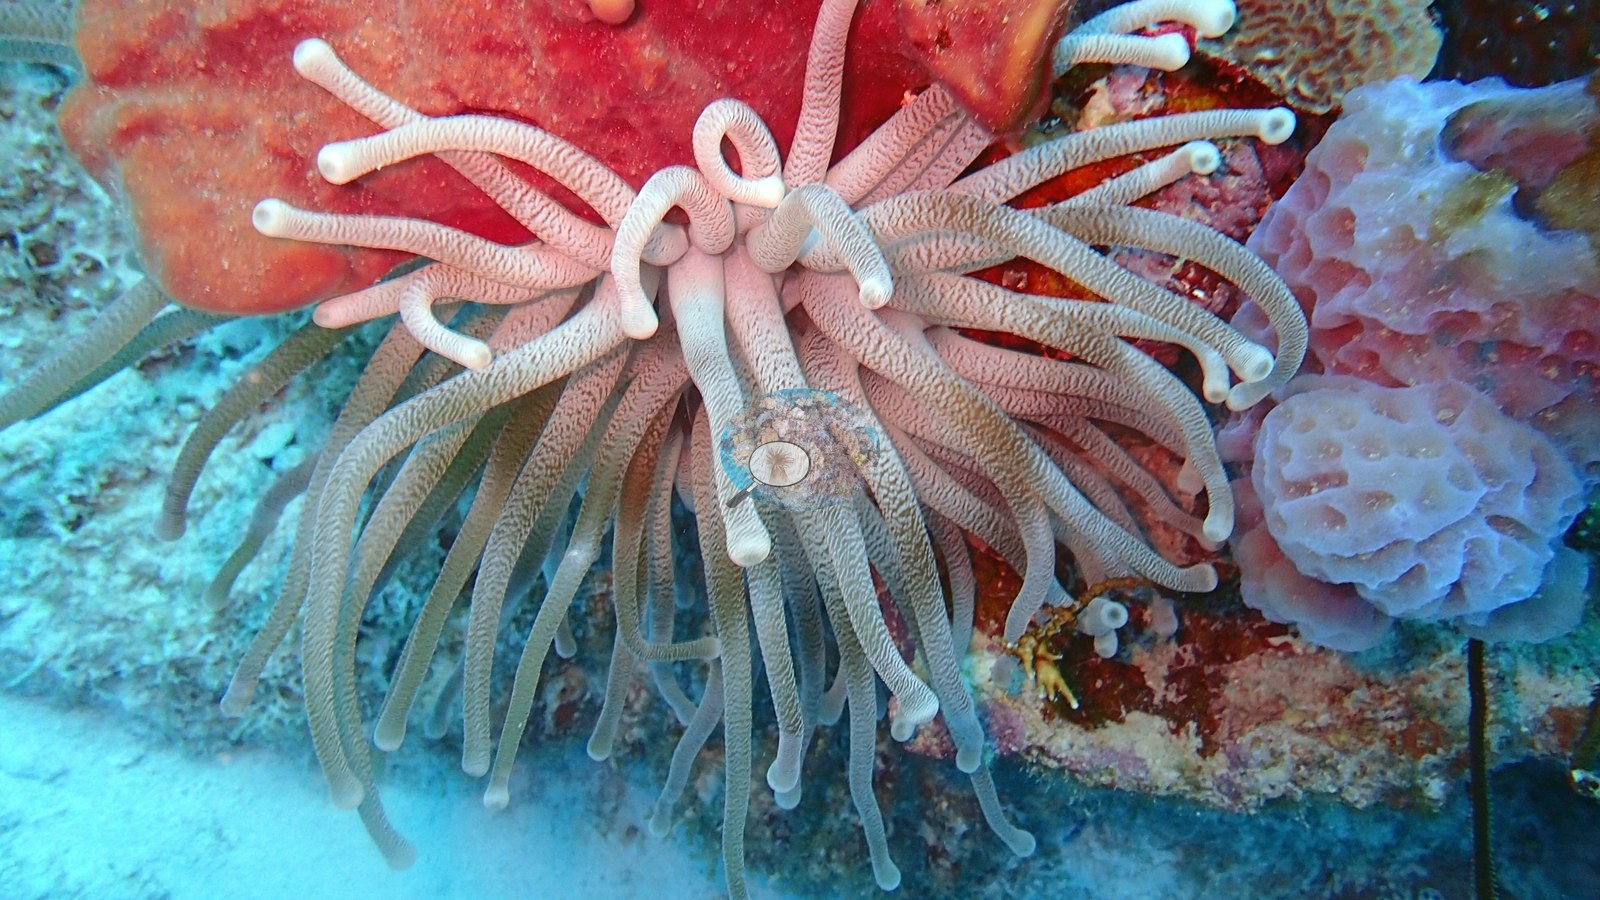
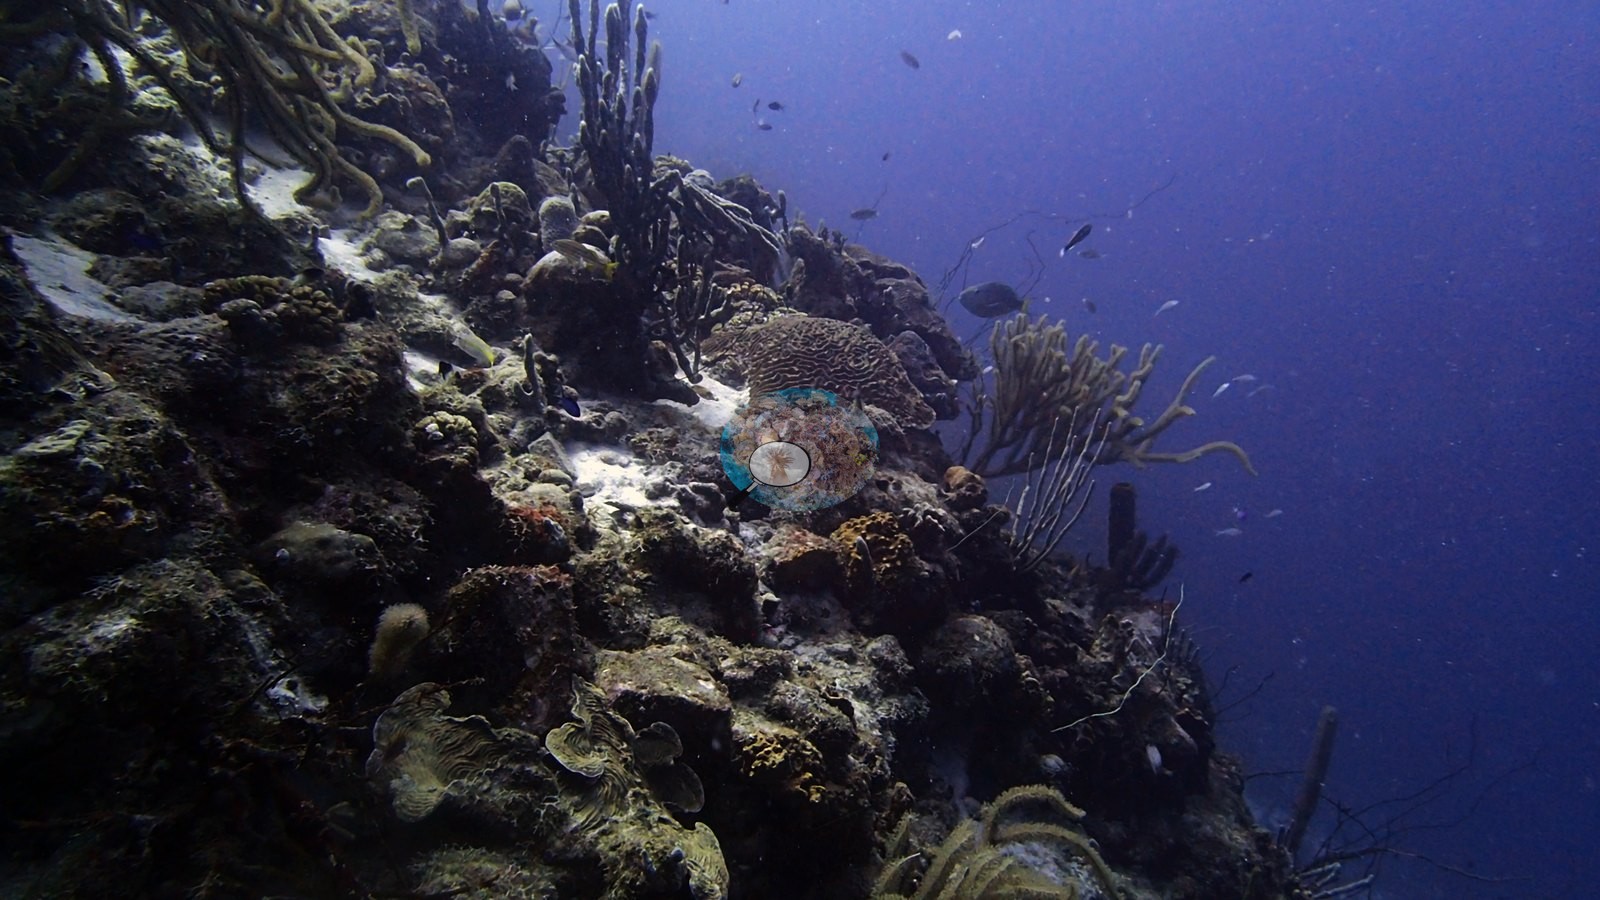
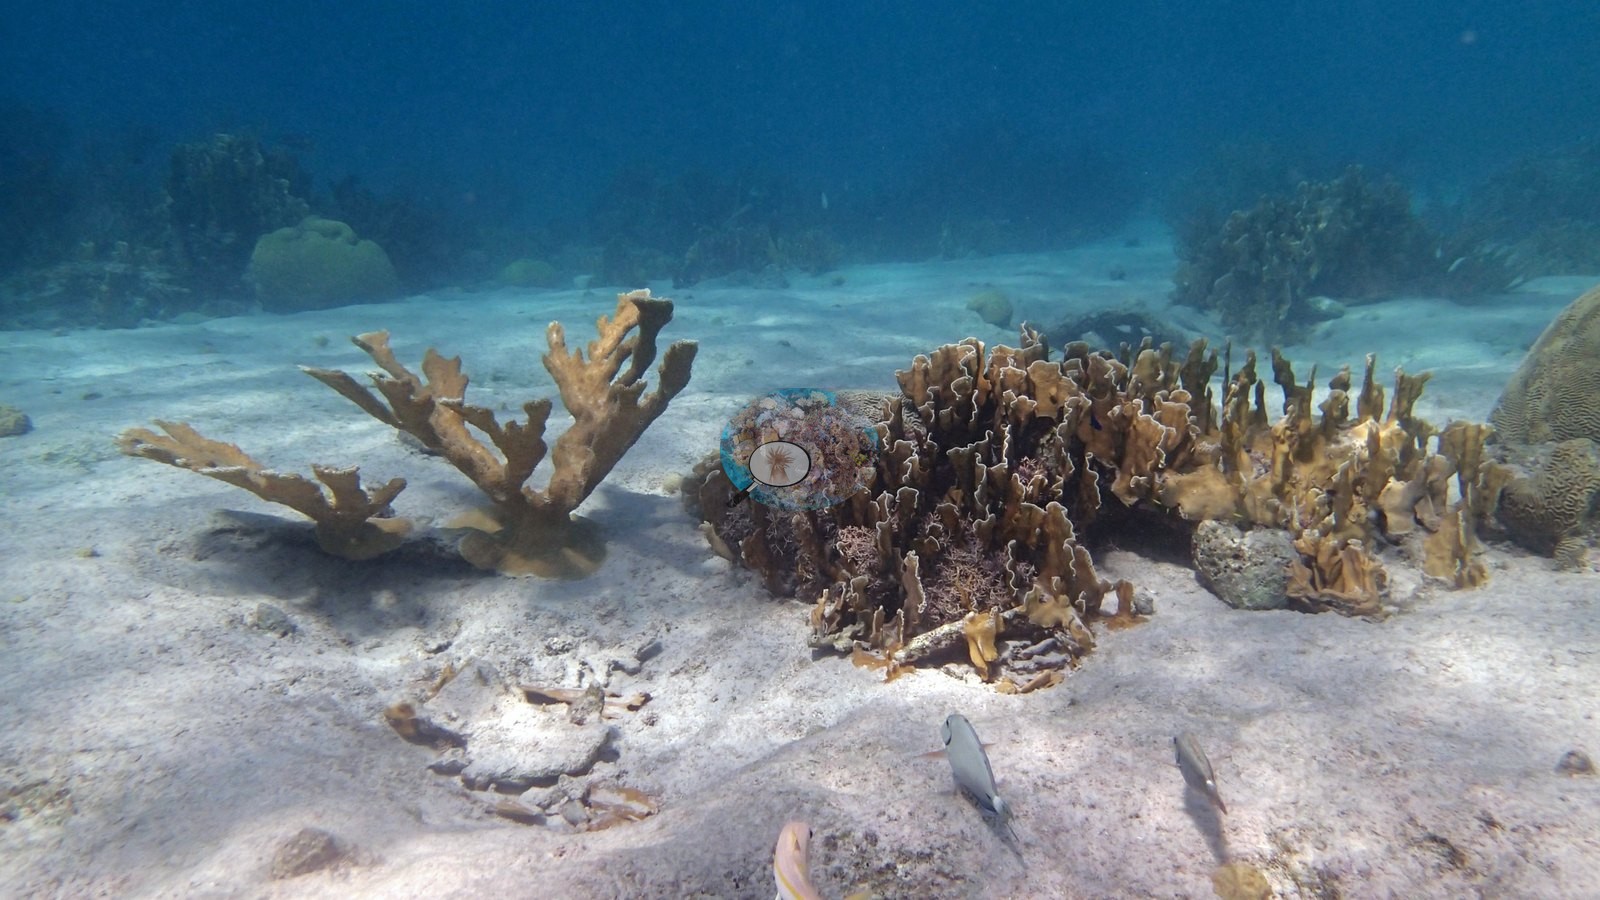
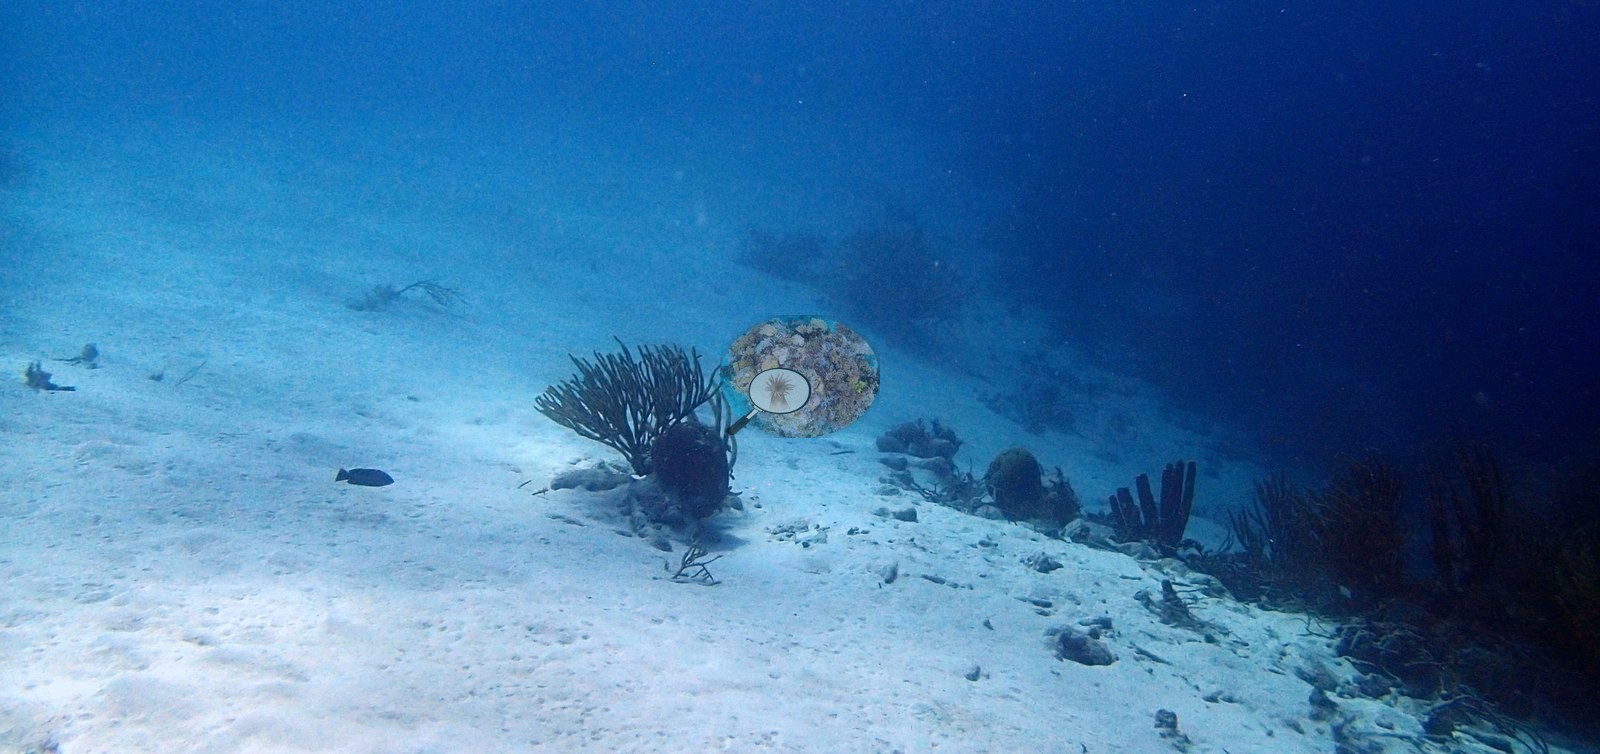
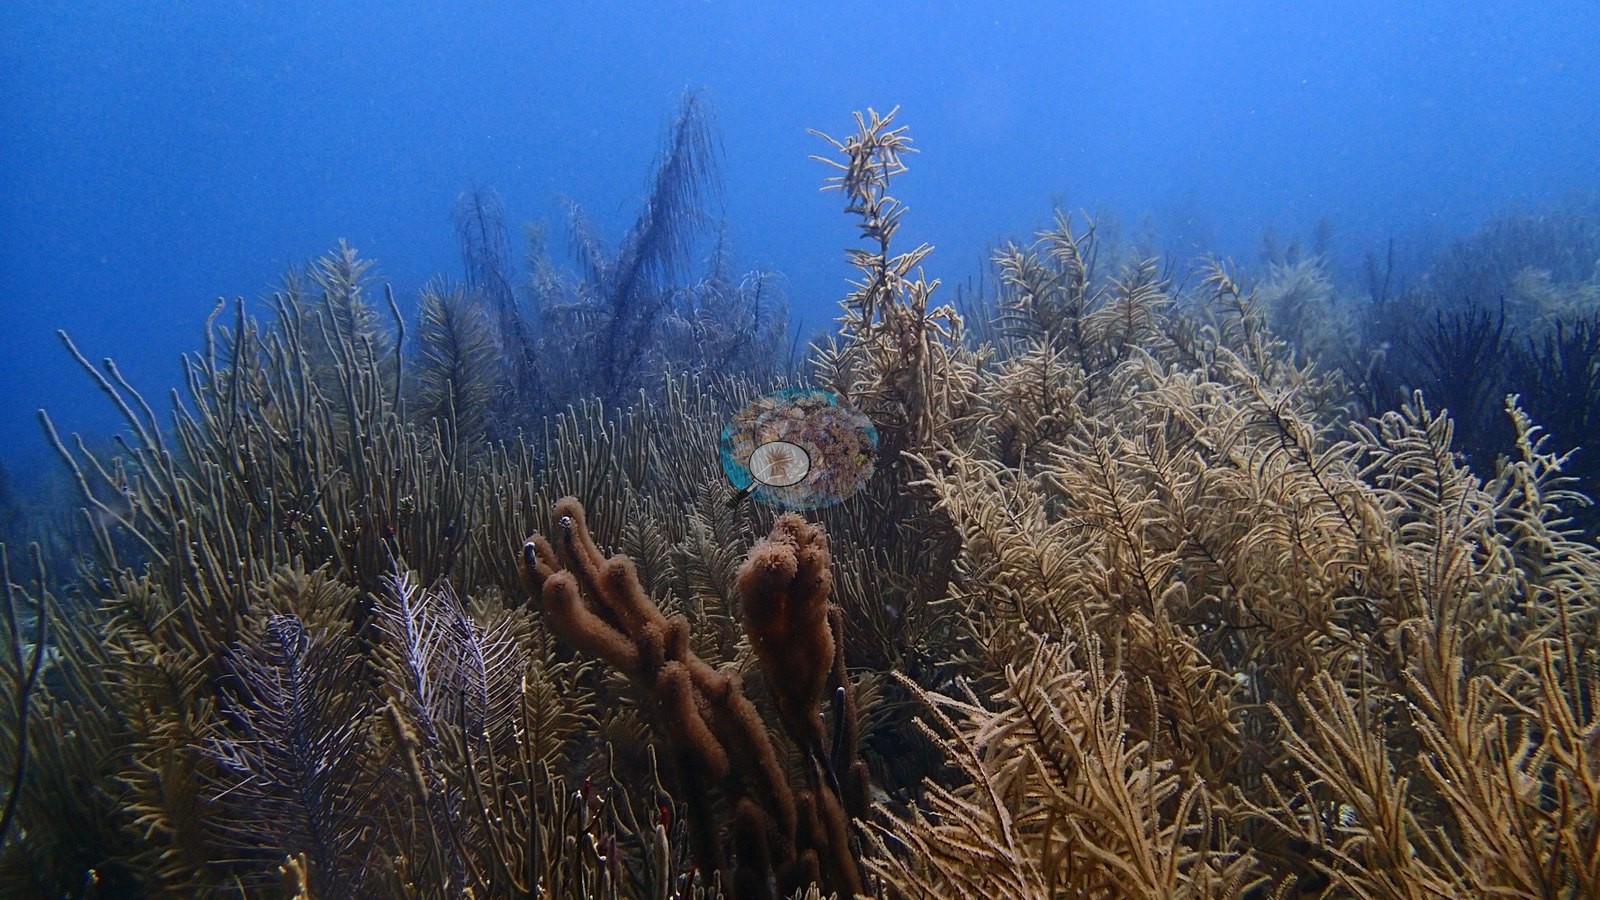
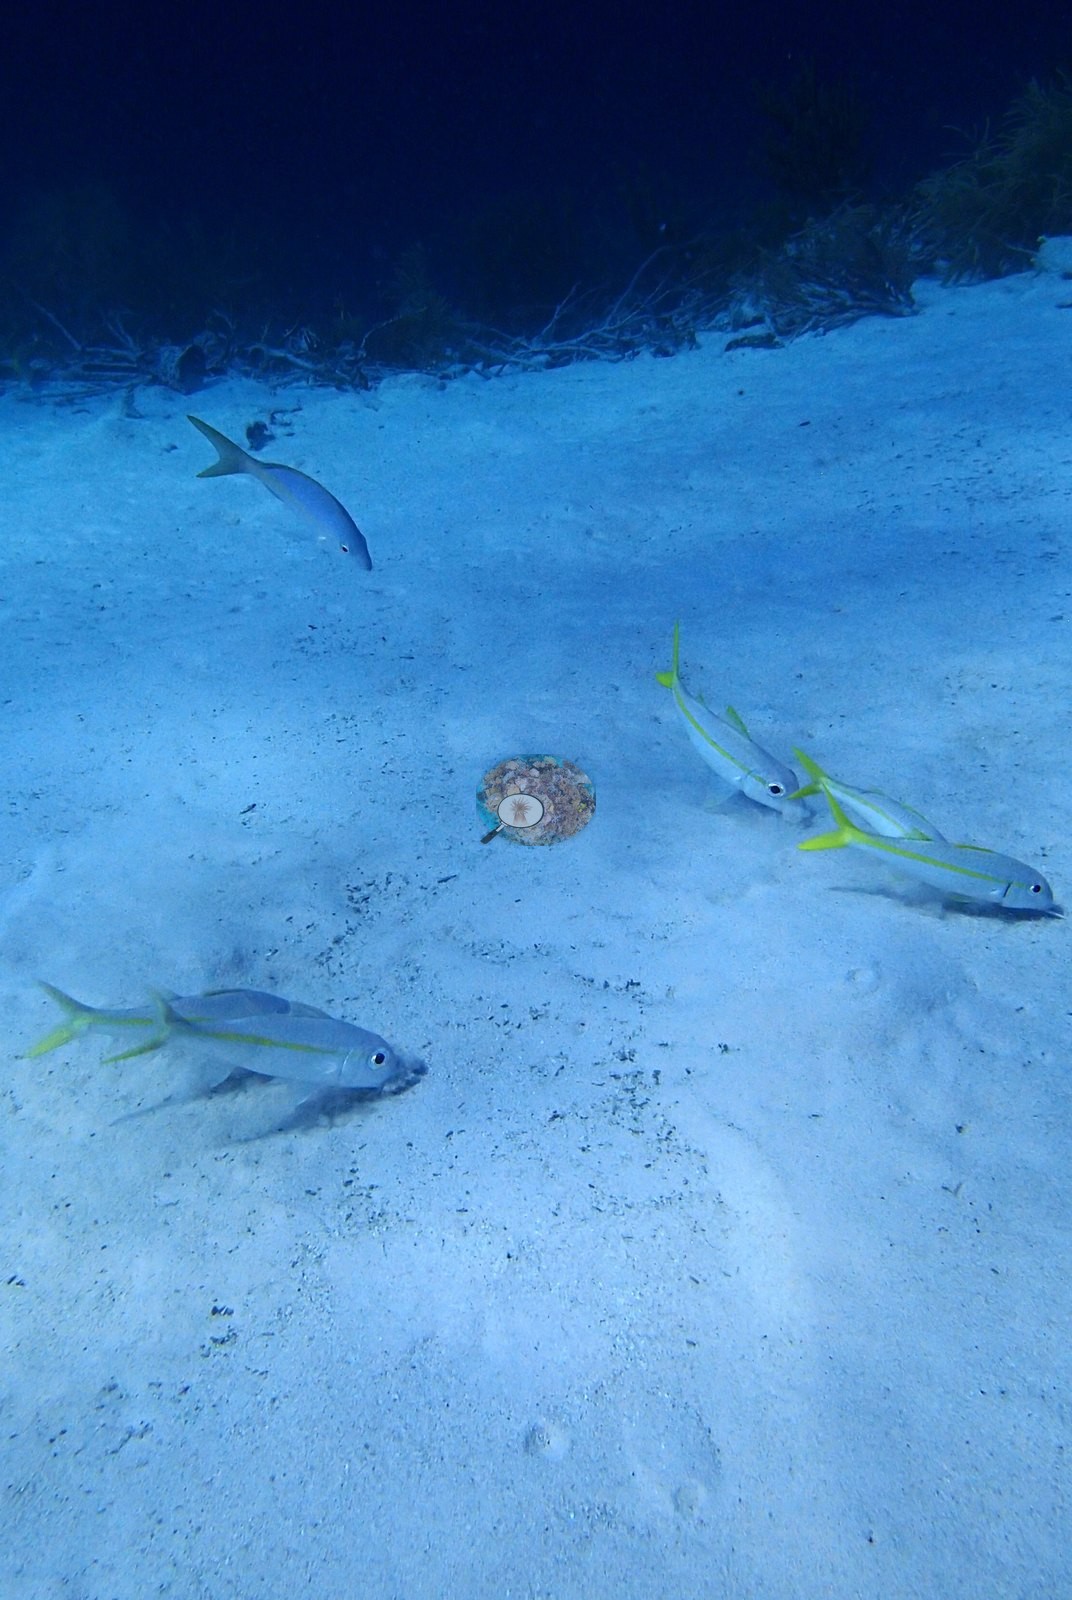
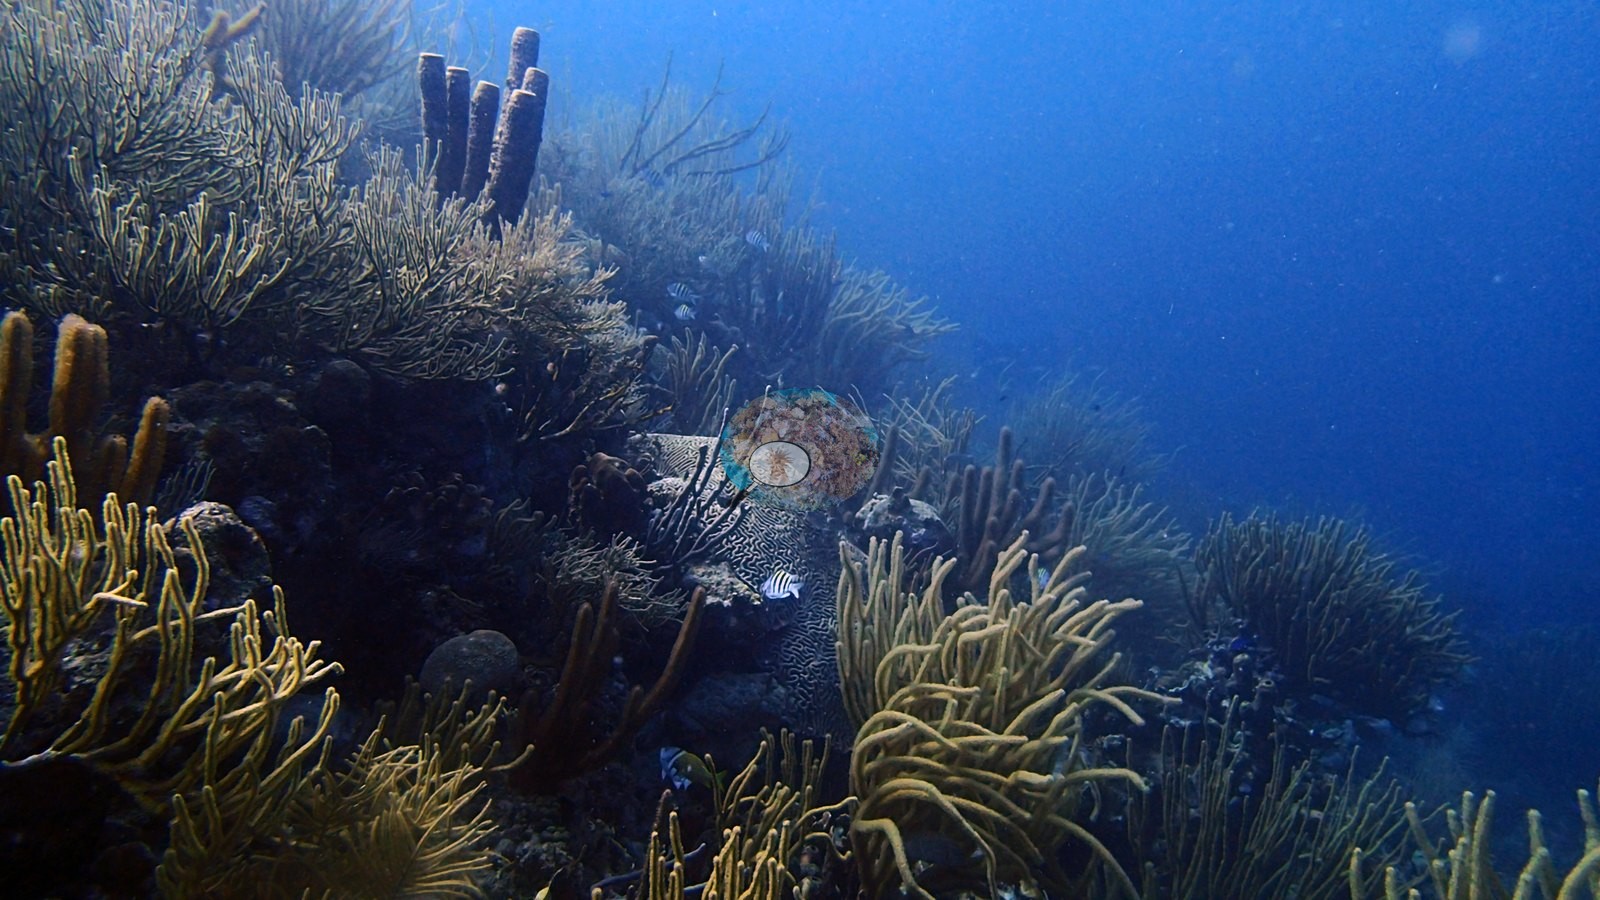
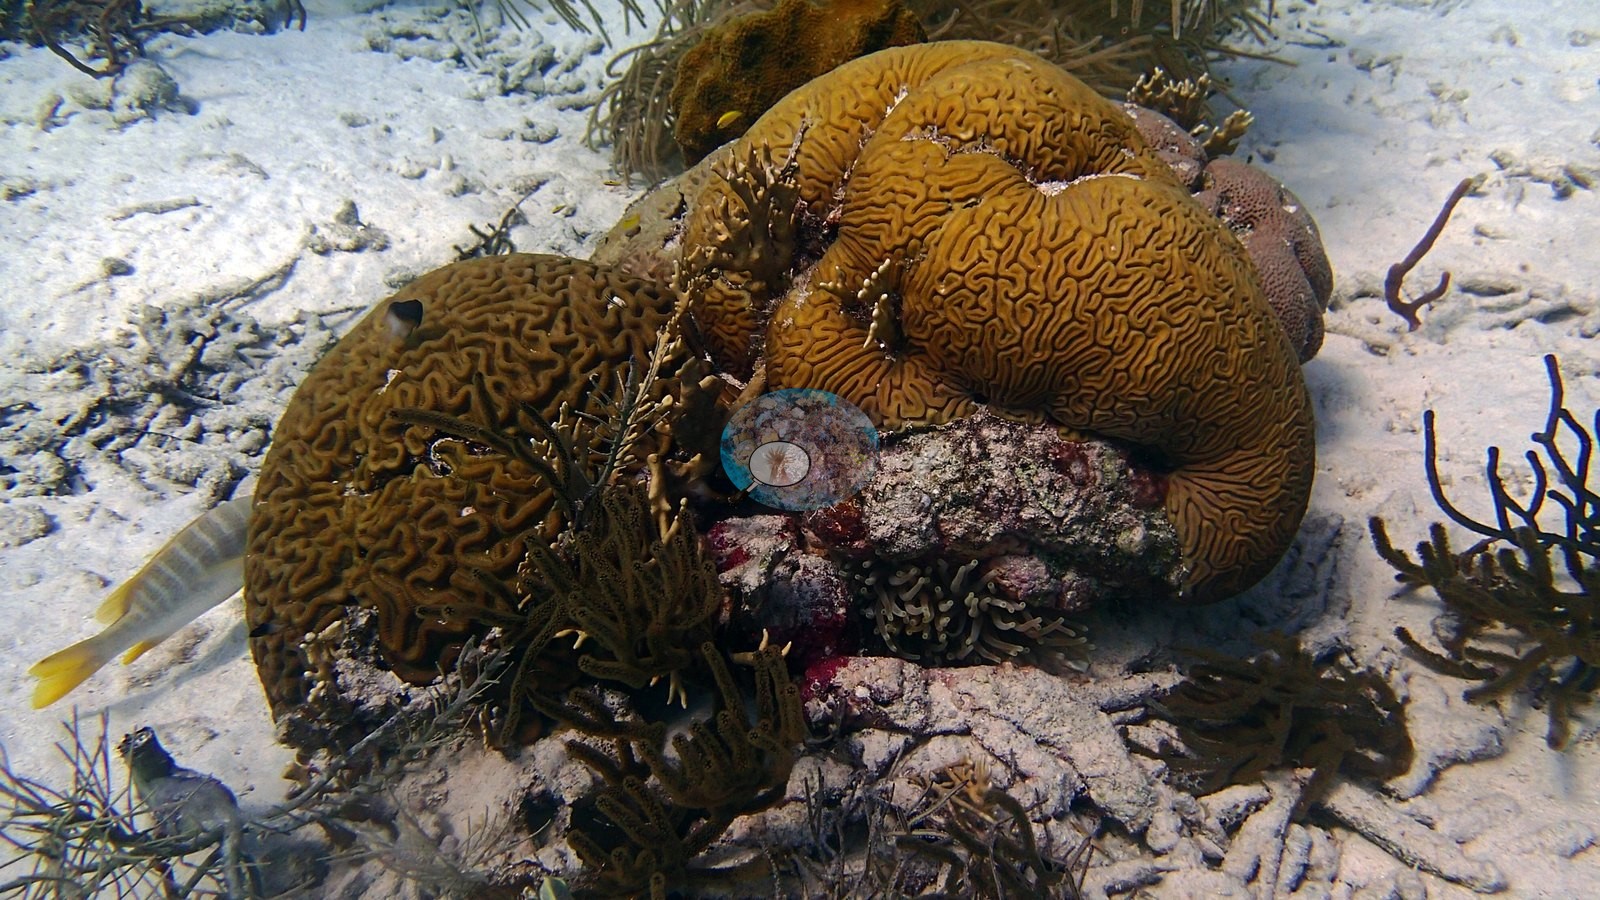
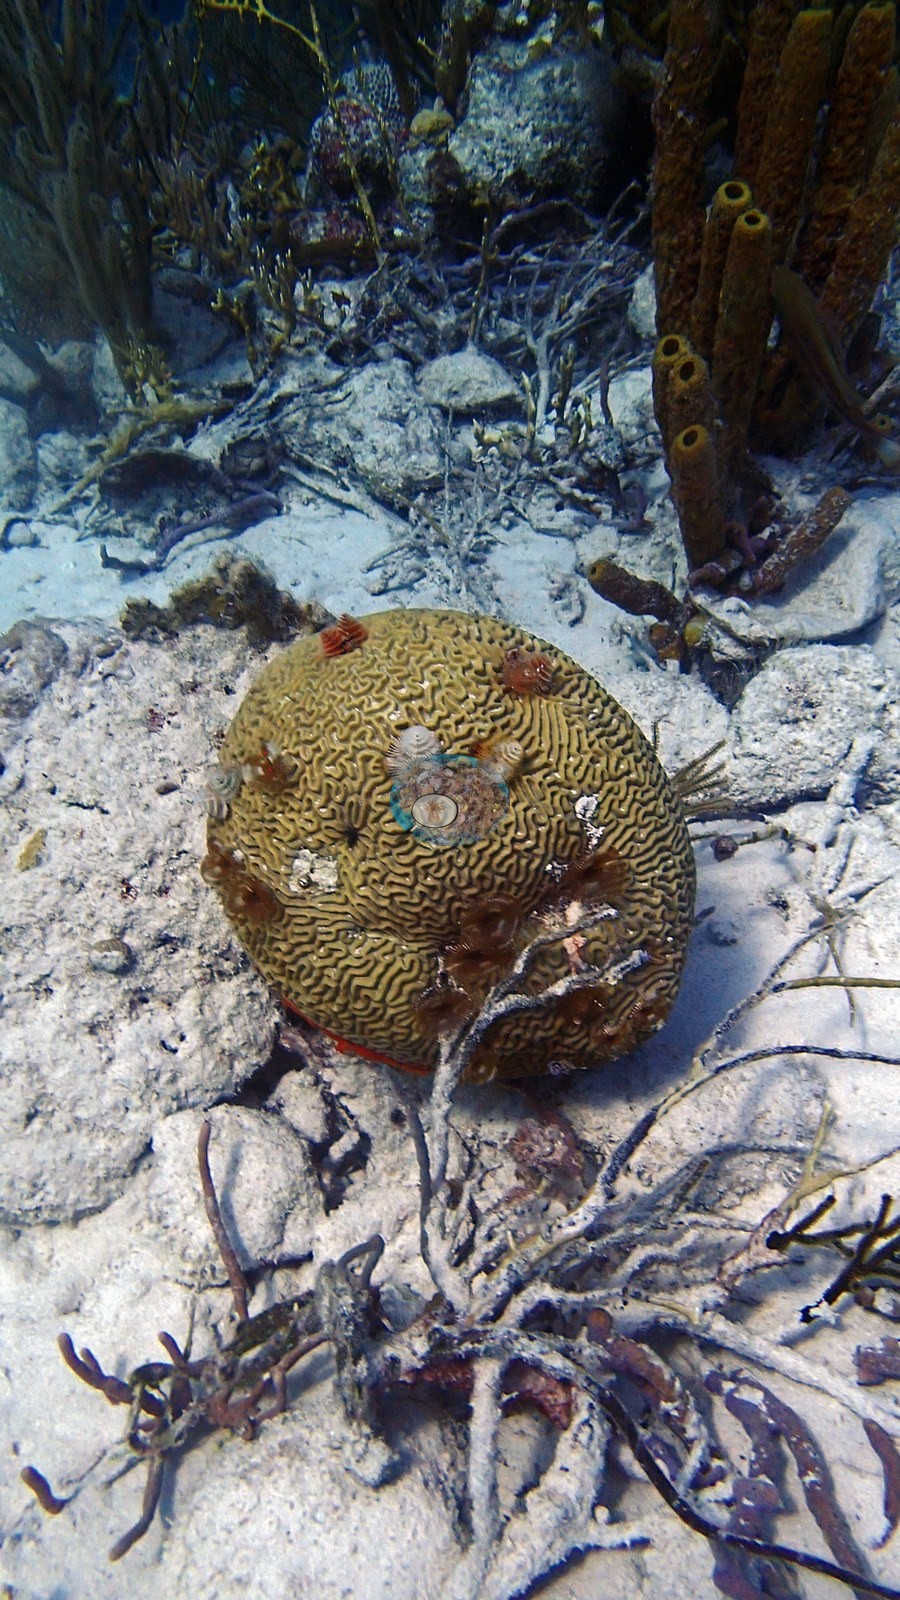
Chogogo is visually dominated by dense octocoral gardens separated by broad sand. Sea rods, whips, and other soft corals provide much of the structure, with scattered massive and brain corals, sponges, and an Acropora palmata remnant or colony (e.g., Image 1, Image 4).
Coral cover
- Reference: Claude CV point count (this site's photos)
- Coral cover: 10% — a blind Claude computer-vision point count of 24 of Anderson's edited photographs (20 points per photo; water, fish, and obstructions excluded). Other computer-vision methods are listed in the method table.
Stressors
No broad hard coral bleaching pattern is visible. Some shallow framework is open or low in hard coral occupancy, but the selected habitat is naturally sand- and octocoral-dominated. The pale anemone is a normally patterned anemone under flash rather than evidence of coral bleaching. Octocoral color alone is not a reliable tissue-condition indicator. No corallivores were evident.
Fish and other fauna
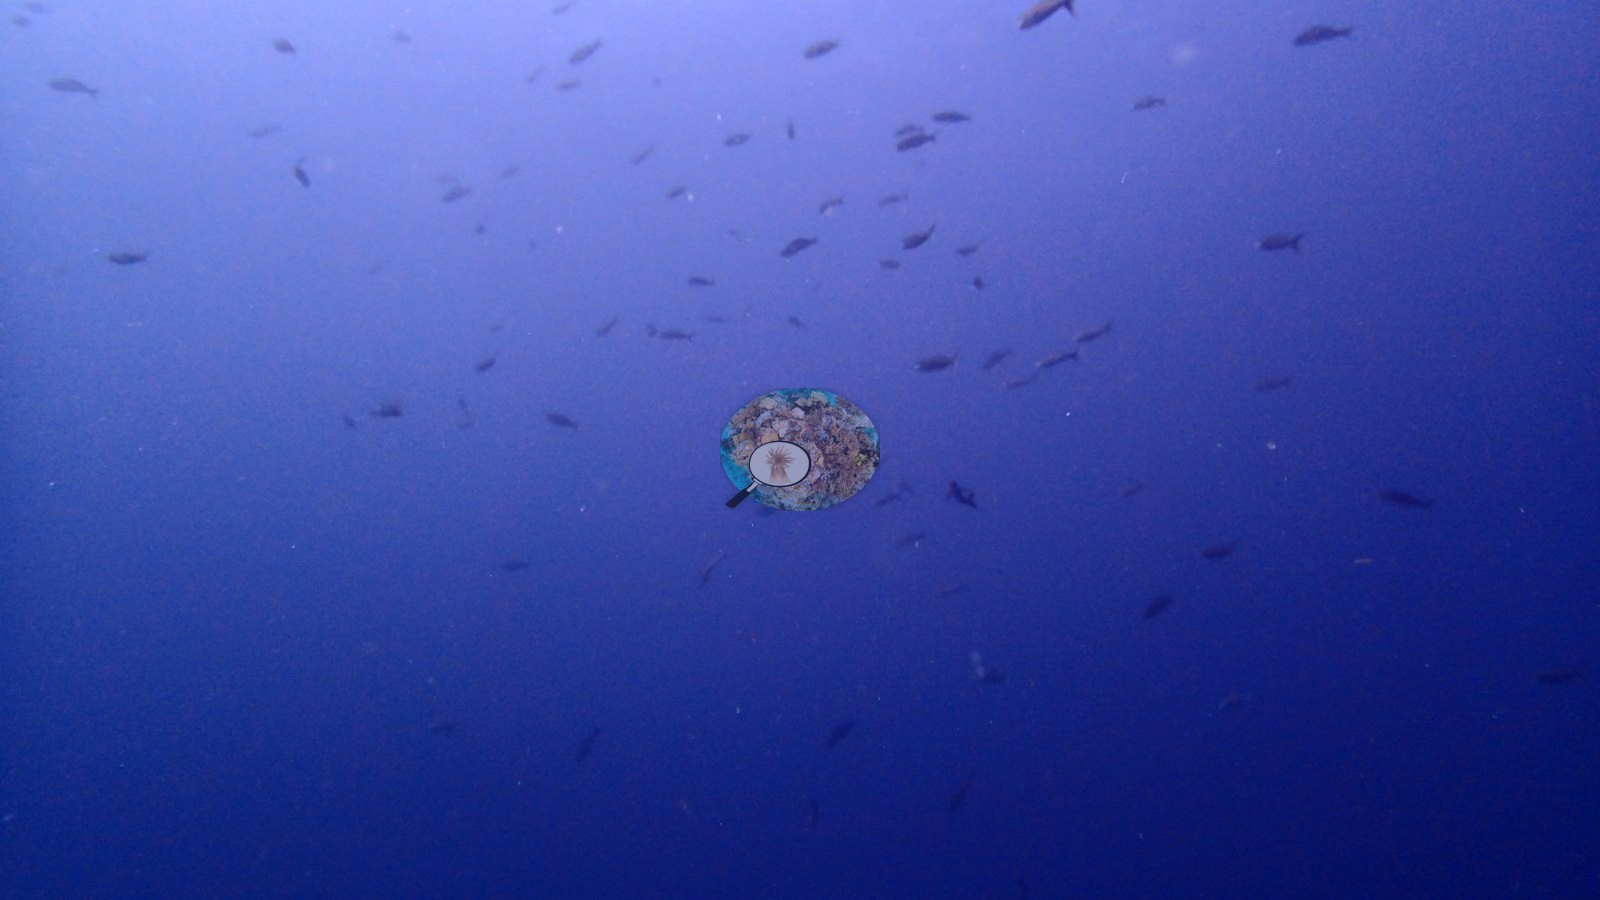
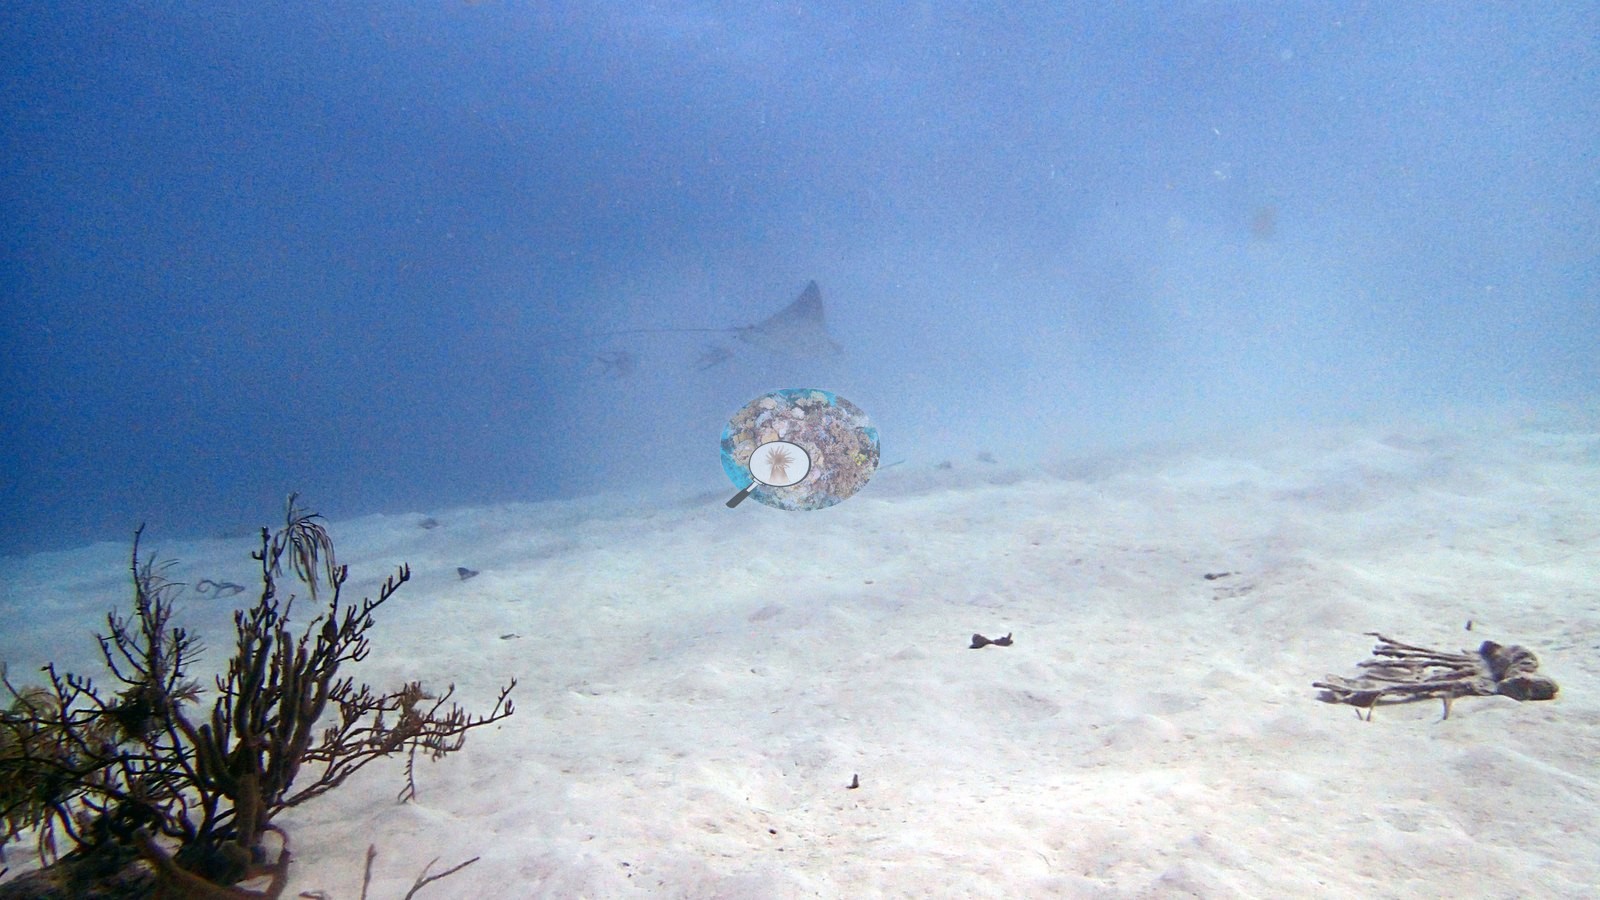
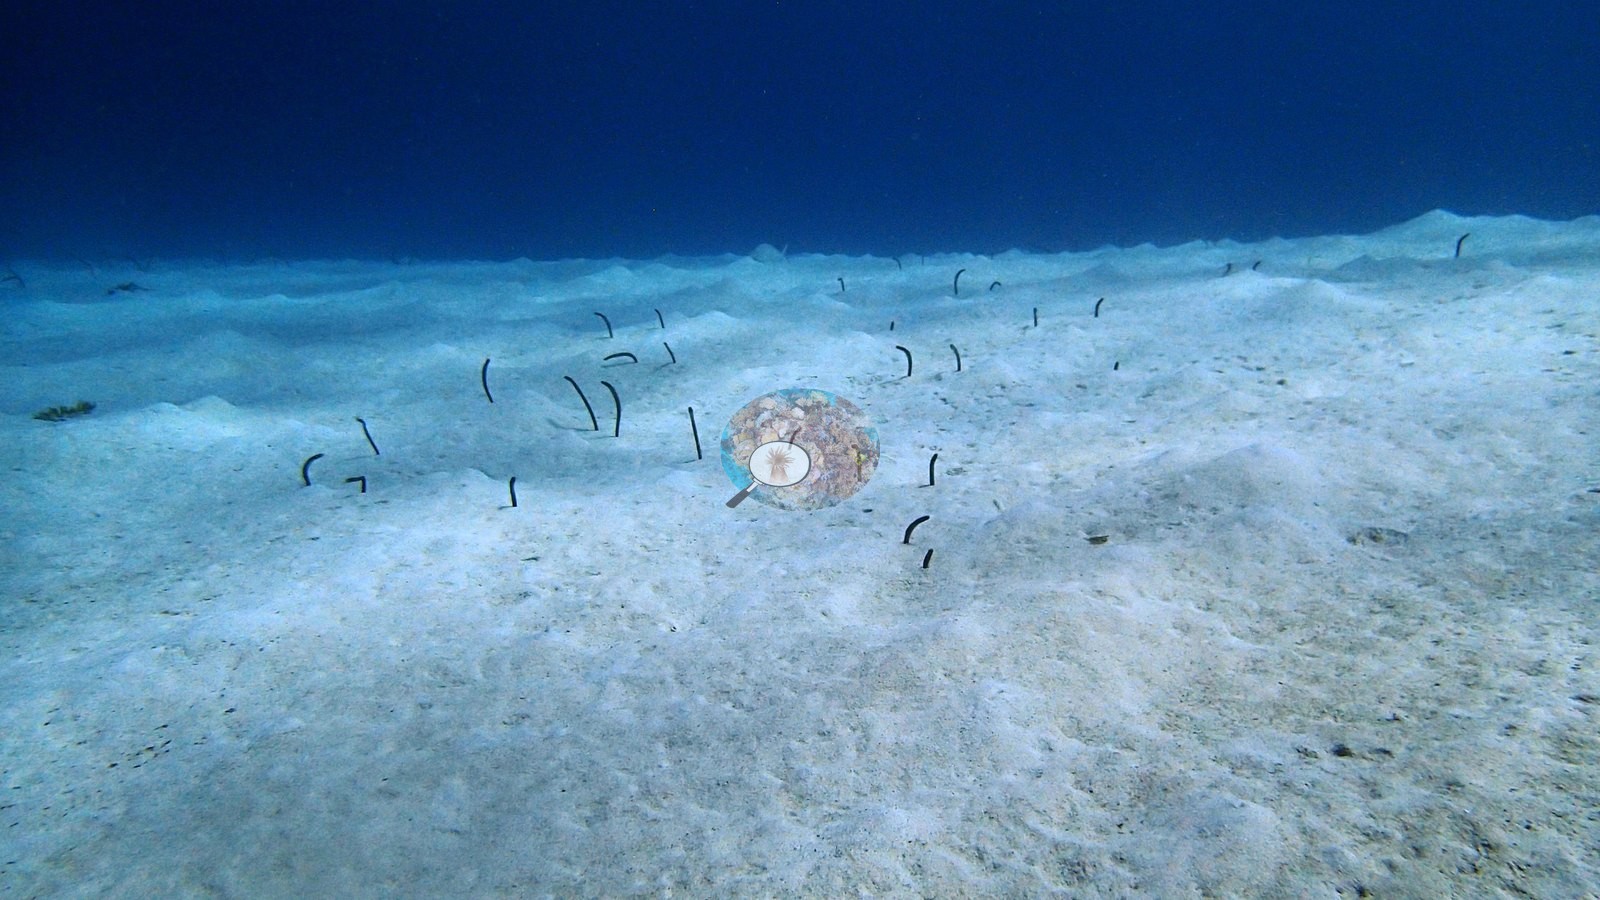
A pair of spotted eagle rays glided low over the open sand alongside a garden eel colony and a passing turtle (e.g., Image 11, Image 21, Image 23).
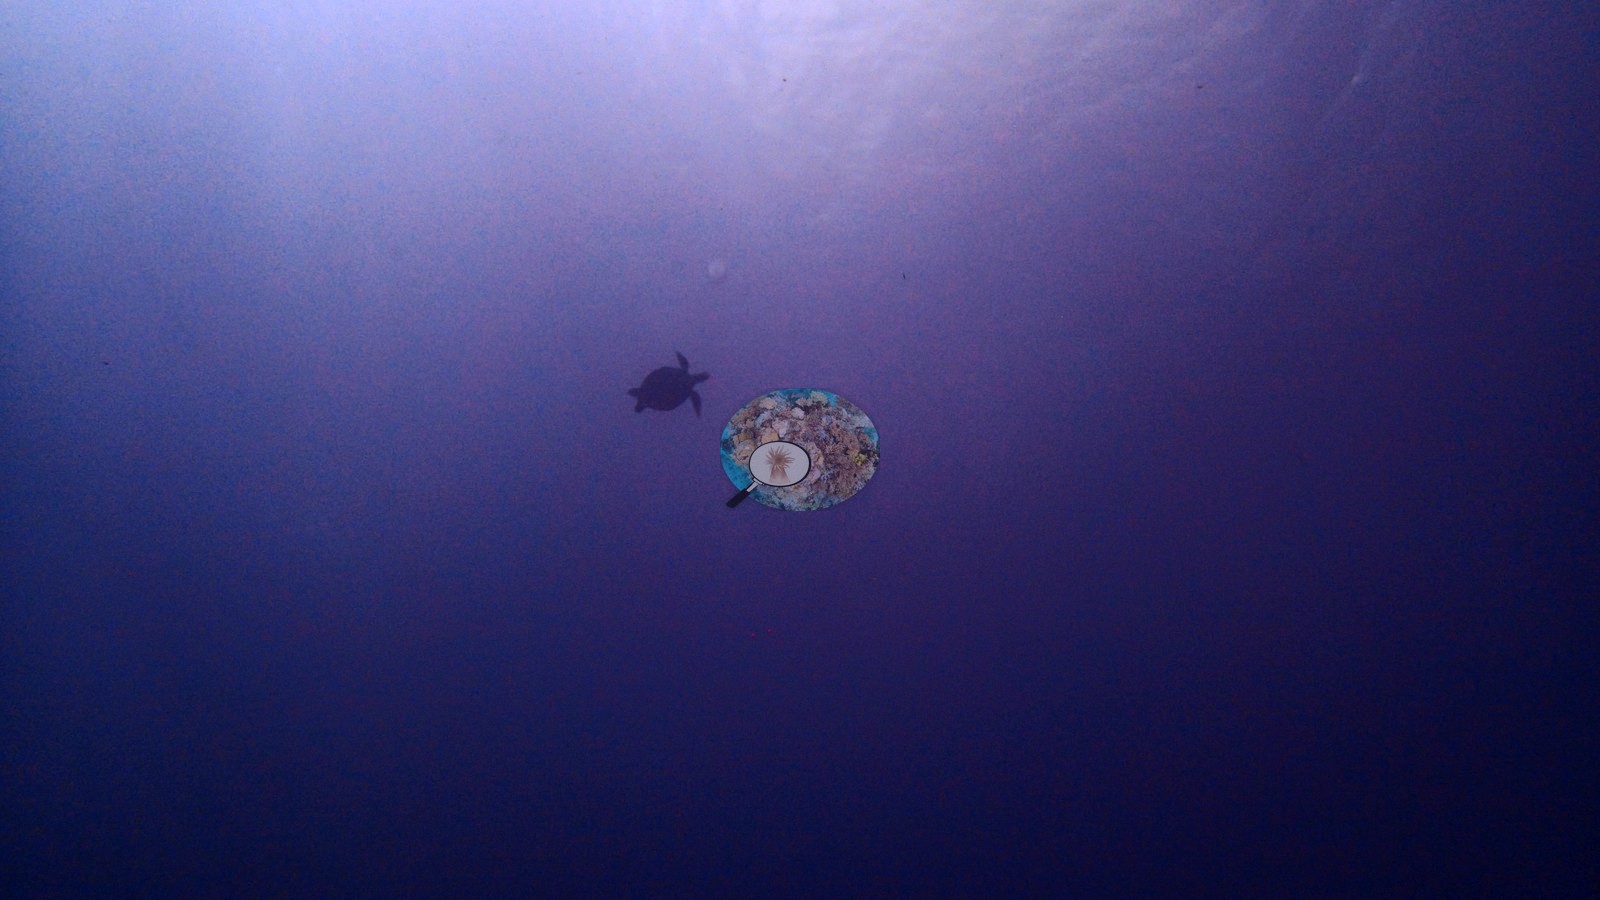
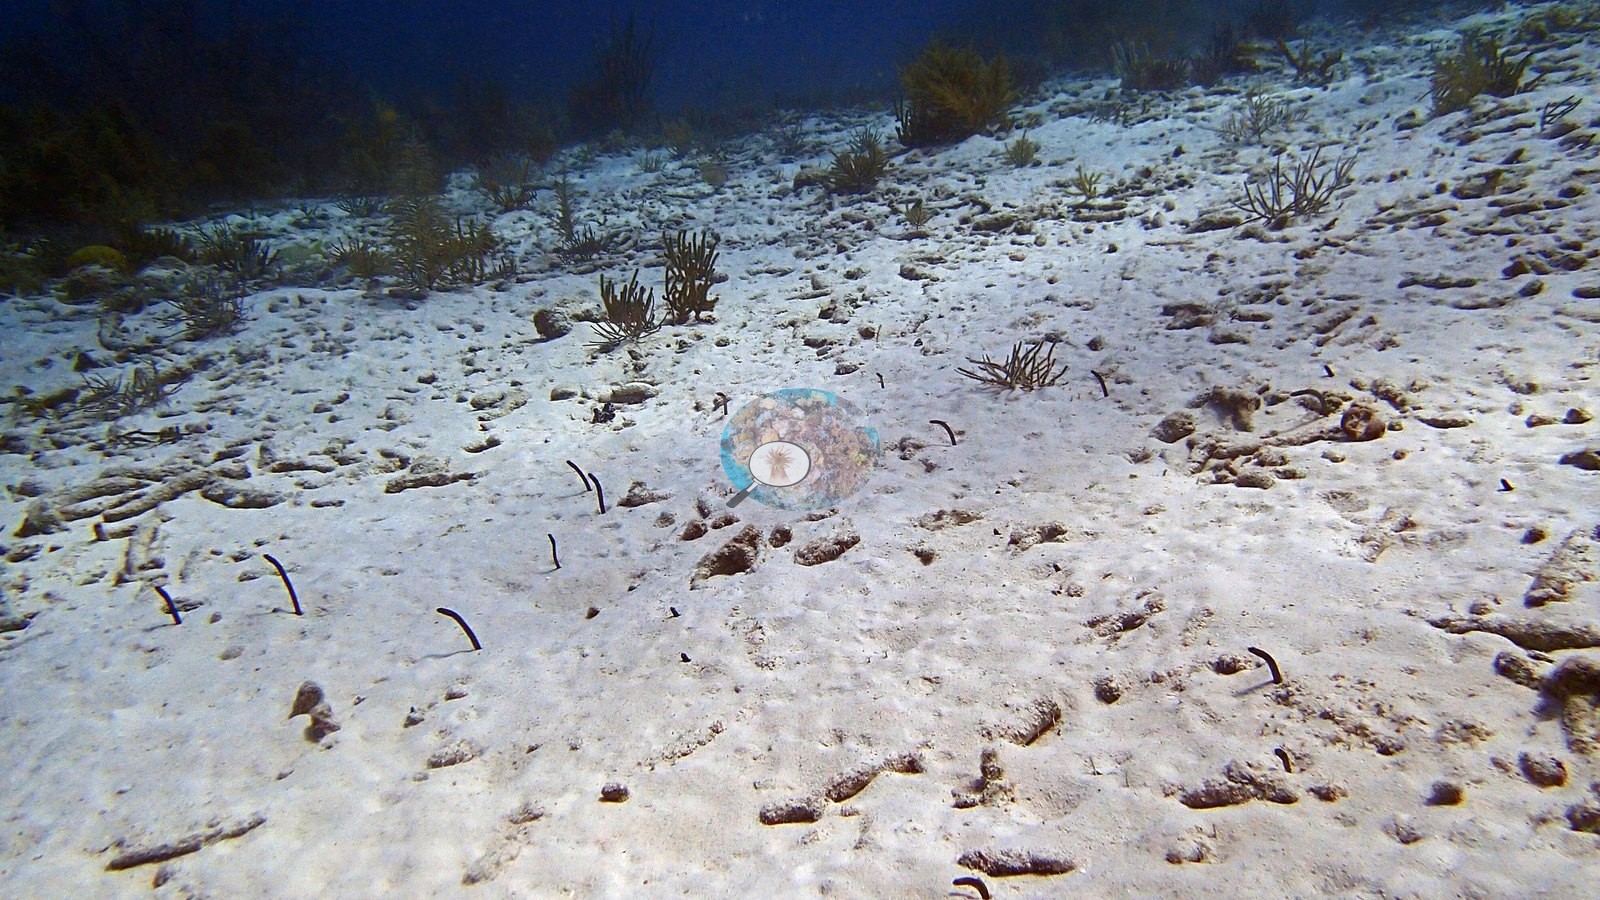
Garden eels occupy the sand apron, while spotted eagle ray, turtle, and reef fishes are prominent mobile fauna (e.g., Image 5).
Comparisons with other data
de Bakker et al. (2019) surveyed a nearby station (station 2), 0.23 km from the pin. Within 5 km, two XL Catlin Seaview Survey stations recorded station-year means of 12–14% hard coral cover in 2013; the nearest of these, XL Catlin Seaview Survey at transect 17040, 1.63 km away, read 12% in 2013.
CV model comparison
More info
A few colony-focused photos raise the mean; the median is the typical photo. No computer-vision method yet estimates coral cover accurately on new images, so treat this as indicative rather than a measurement; it is revised as the methods improve.More info
Other rows are for comparison only and are never averaged. No diver transect exists for these photos, so agreement between rows is not accuracy.| Method | Hard coral cover (%) | Photos (n) ± SE |
|---|---|---|
| CoralSCOP edited | 23.7 | n = 32 · SE 3.4 |
| Claude (edited photos) | 10.4 | n = 24 · SE 3.2 |
CoralSCOP (edited photos) reads 23.7%, 13.3 pp above Claude's blind point count (10.4%); the headline stays Claude's blind point count because no transect or manual count exists here.
See a more detailed, stand-alone version of this table.
Independent surveys nearby
Within 5 km, 2 independent survey stations recorded hard coral cover in 2013. The most recent nearby survey is from 2013, so these values predate recent heat stress. This site's own estimate (10%) sits 2 points below the one survey station up to 2 km away (12%), inside the 7-point method-noise floor (inconclusive); the methods differ, so the comparison is context, not a like-for-like test.
Collected by other programs using different methods (the XL Catlin Seaview Survey uses photo-transects with automated image annotation), so these are context for the figures above, not a like-for-like comparison. Where a station was surveyed more than once, the cell shows either the range of its values or, as a single value, the mean of surveys made in one year. Station names are not dive-site names.
| Agency | Site / location | Date | Hard coral cover (%) | Distance | Link |
|---|---|---|---|---|---|
| XL Catlin Seaview Survey | transect 17040 | 2013 | 12% | 1.63 km | doi:10.14264/uql.2019.930 |
| XL Catlin Seaview Survey | transect 17041 | 2013 | 14% | 4.79 km | doi:10.14264/uql.2019.930 |
Data & links
All images from Coral Reef Diagnostics. Data are from Coral Reef Diagnostics and the organizations named in the data sources above.
© Coral Reef Diagnostics.
References
- de Bakker DM, van Duyl FC, Perry CT, Meesters EH (2019). Extreme spatial heterogeneity in carbonate accretion potential on a Caribbean fringing reef linked to local human disturbance gradients. Global Change Biology 25:4092-4104. DOI
- Gonzalez-Rivero M, et al. (2019). Seaview Survey photo-quadrat and image classification dataset. The University of Queensland (UQ eSpace) data collection. DOI