
Anguilla - The Pipe
Part of the regional summary: Anguilla
More about this place: Anguilla on Wikipedia
More info
Leeward Caribbean Islands (NOAA CRW virtual station) · Eastern Caribbean ecoregion mean=13.1°C-heating weeksThe Pipe is a colonized concrete conduit turned reef, its length studded with boulder and brain corals, encrusting and tube sponges, a giant anemone, and a grazing queen conch. A blind Claude computer-vision point count puts coral cover around 6.6%.
One independent survey station shown with the program’s logo — click one to see how far it is from this site.
One other CRD dive site within 5 km shown in orange — click a marker to open its page.
18 of these 52 photographs are shown beside the text that discusses them under "Site description" below.
Site description
Setting
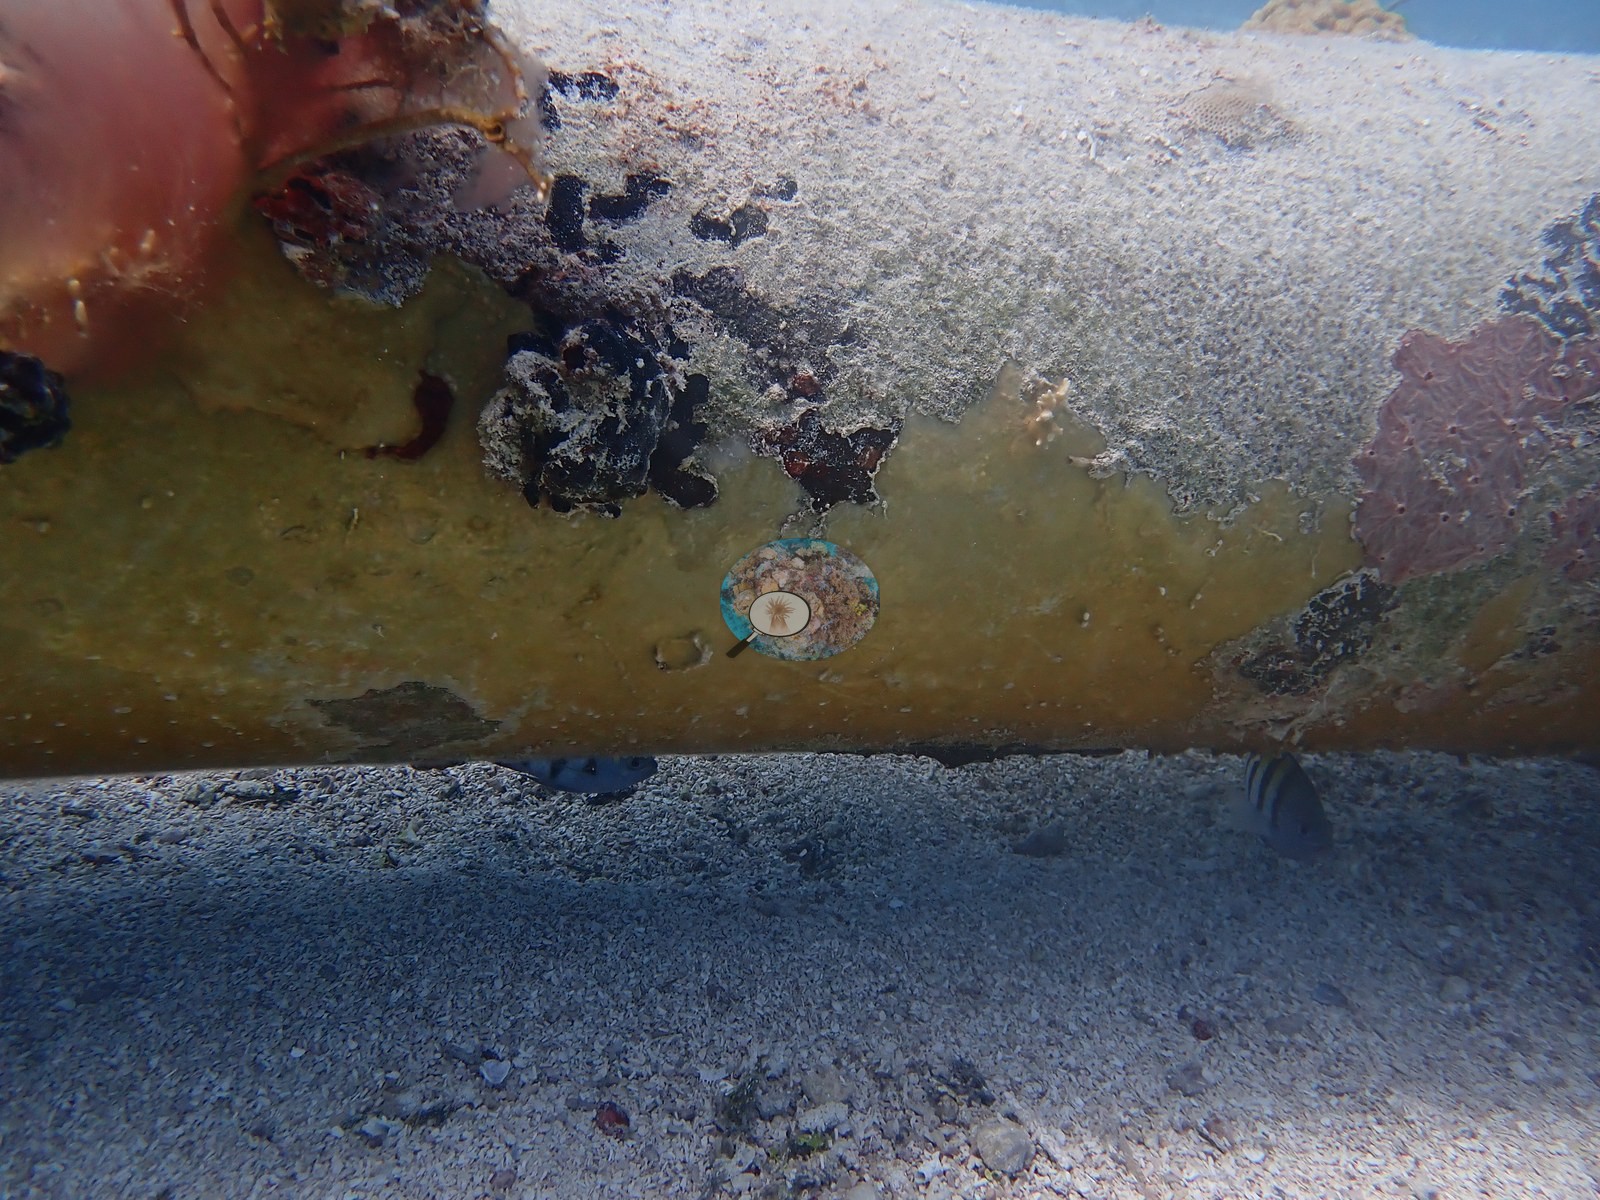
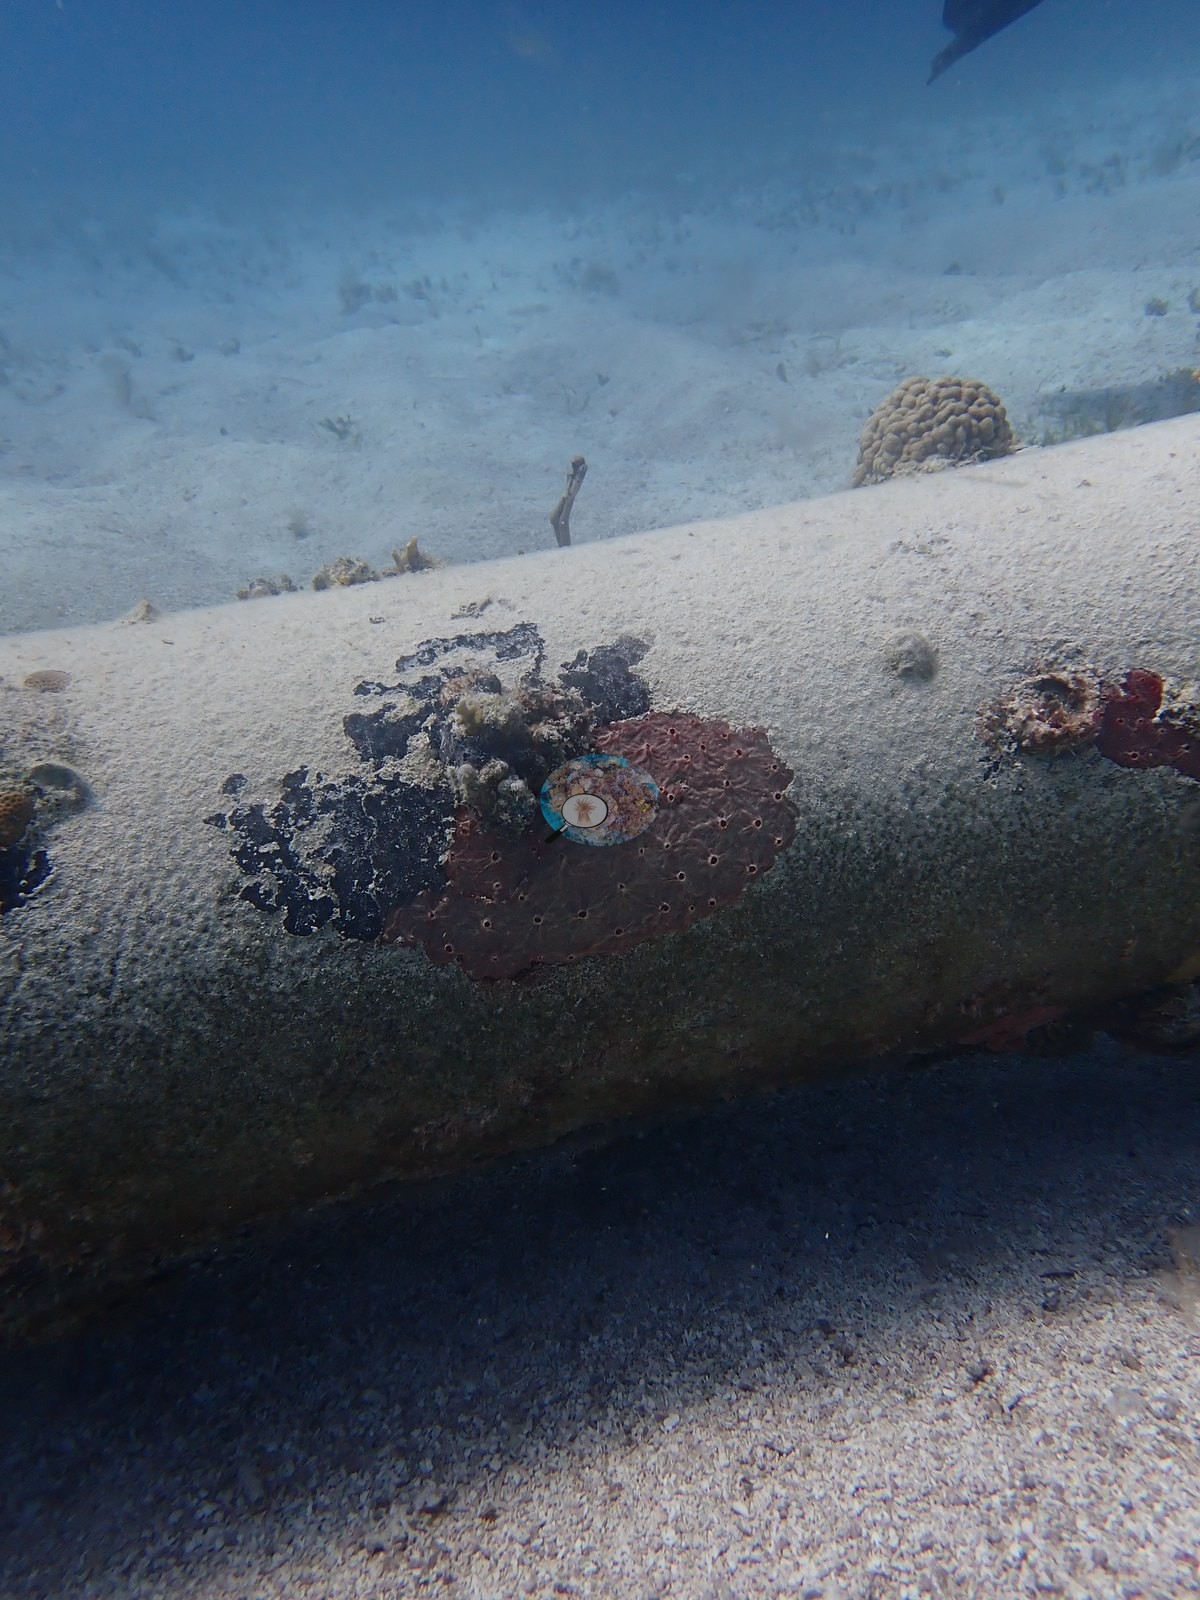
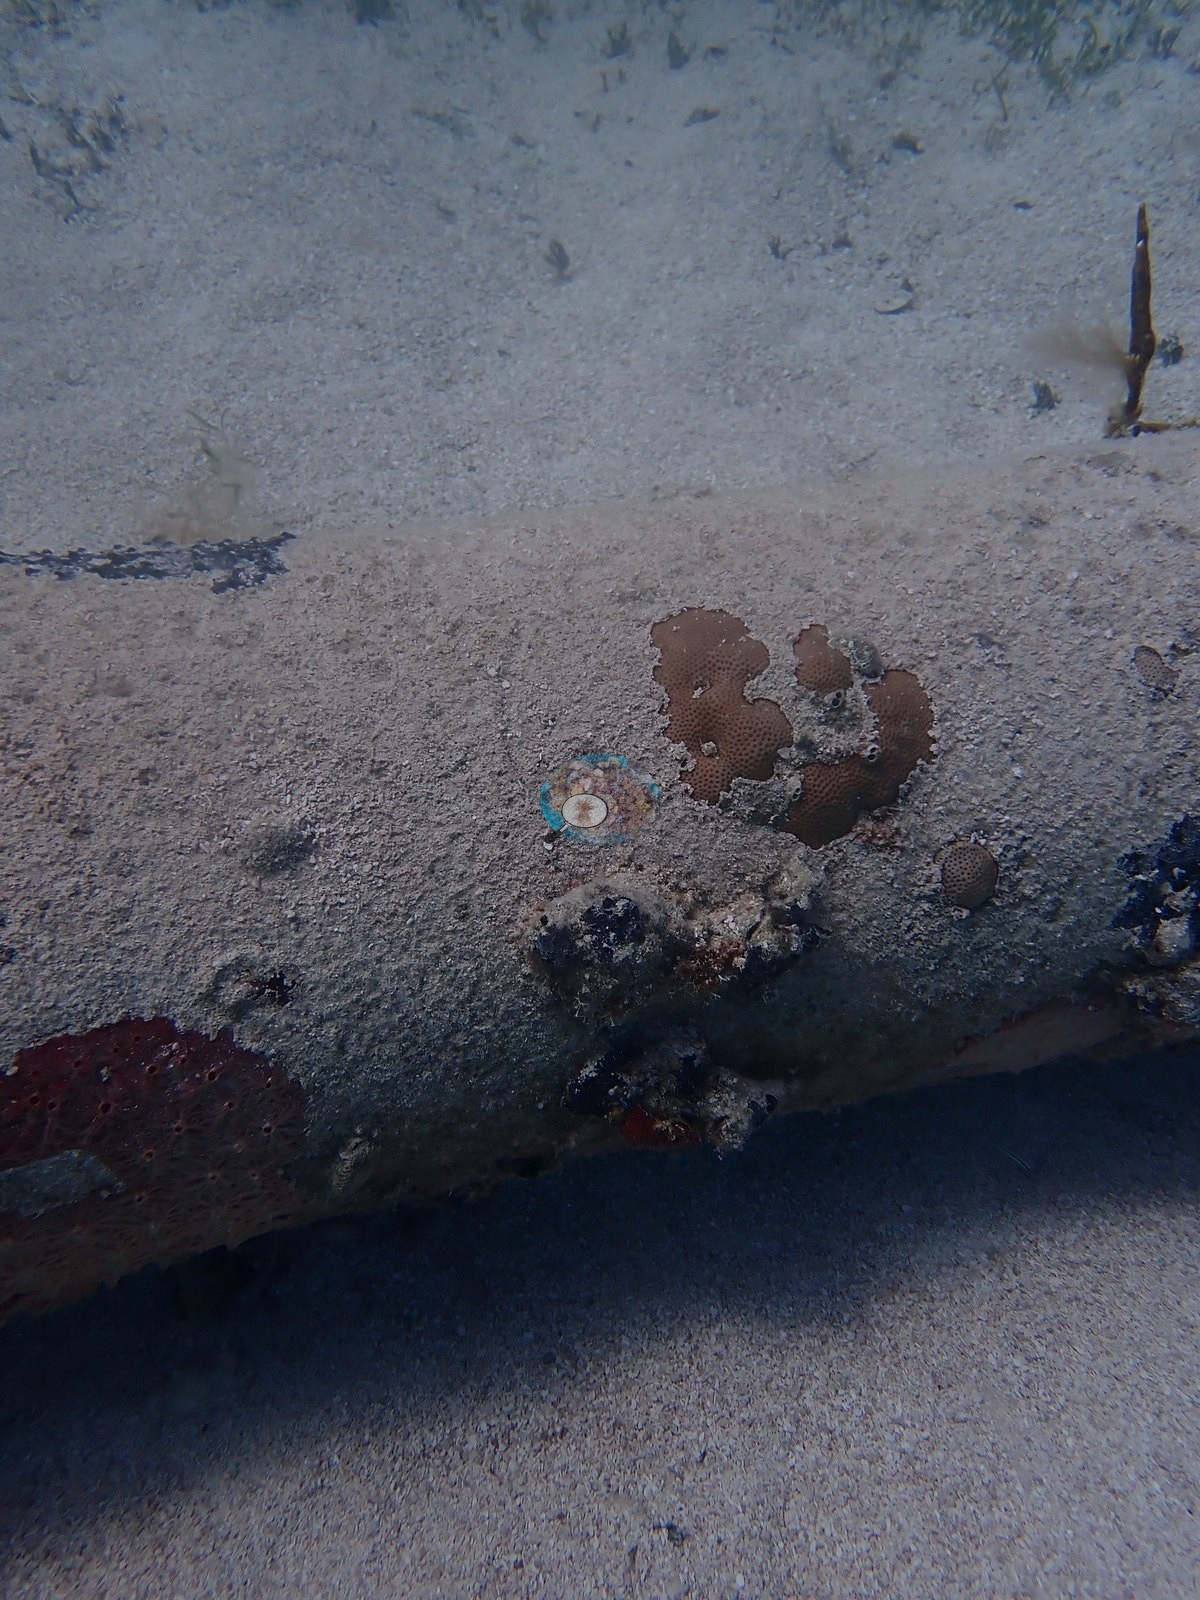
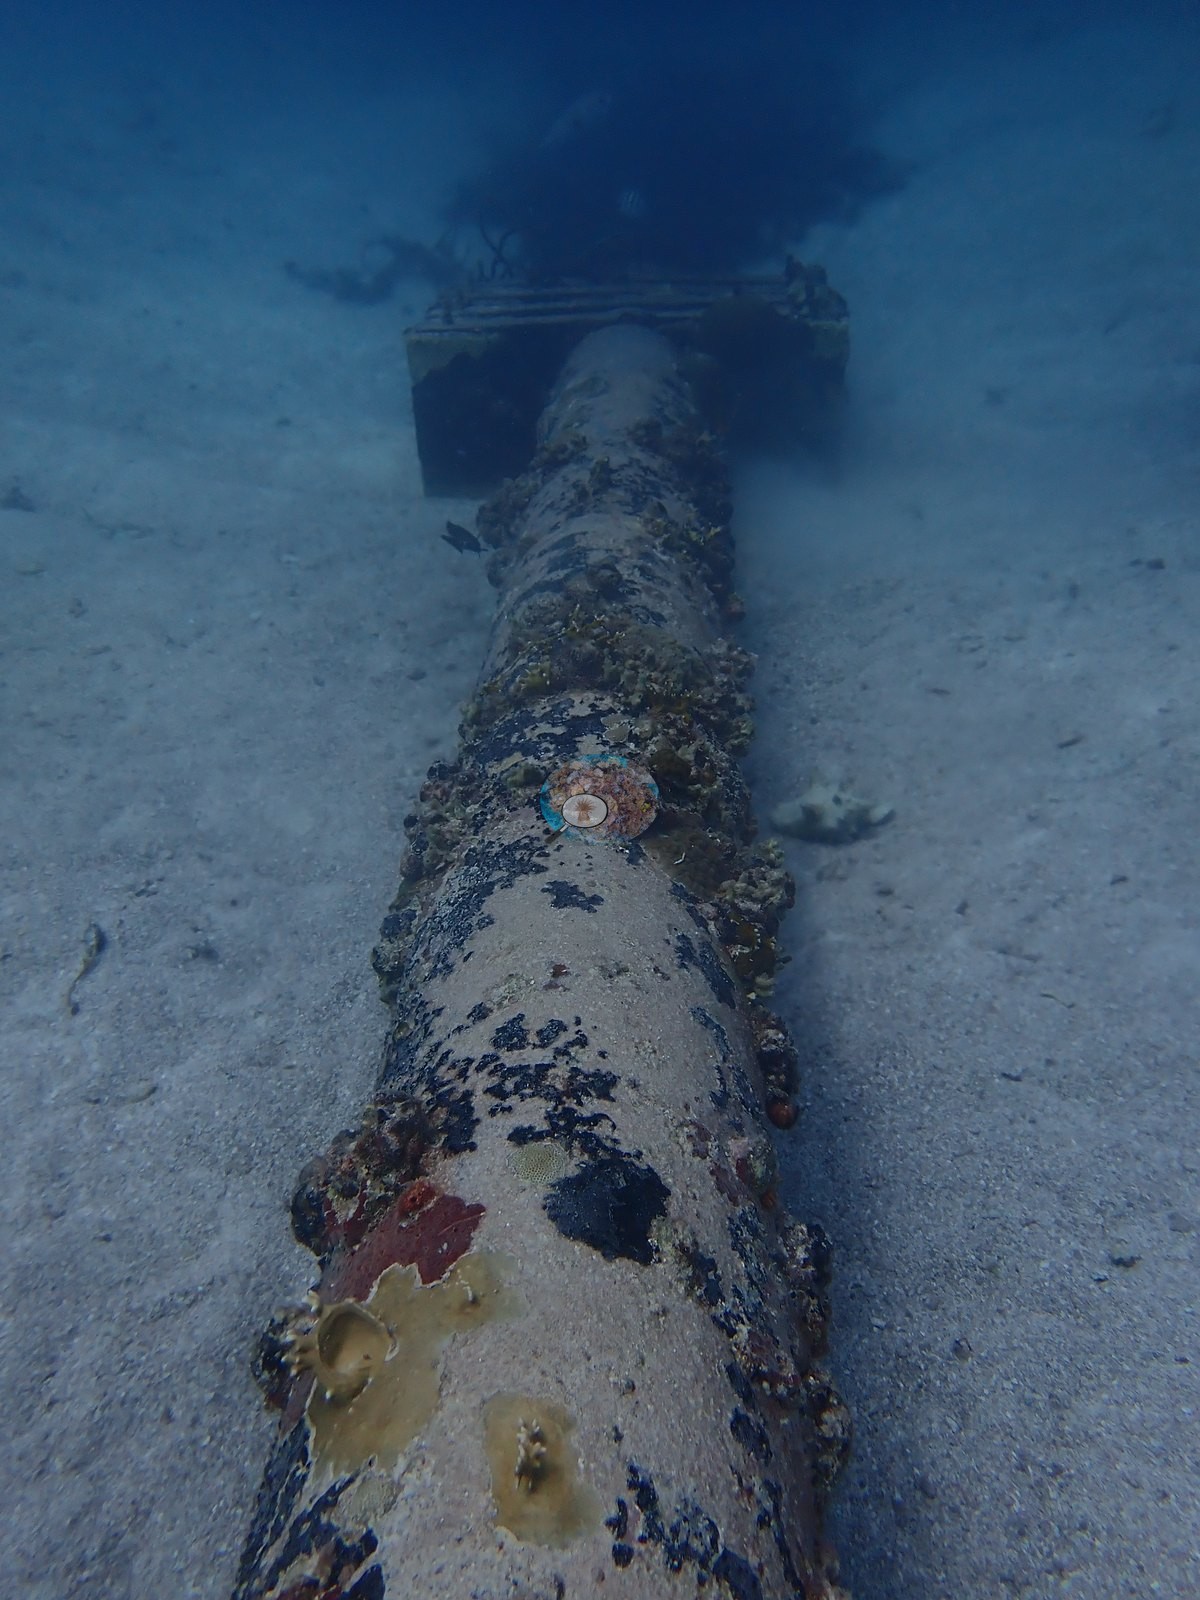
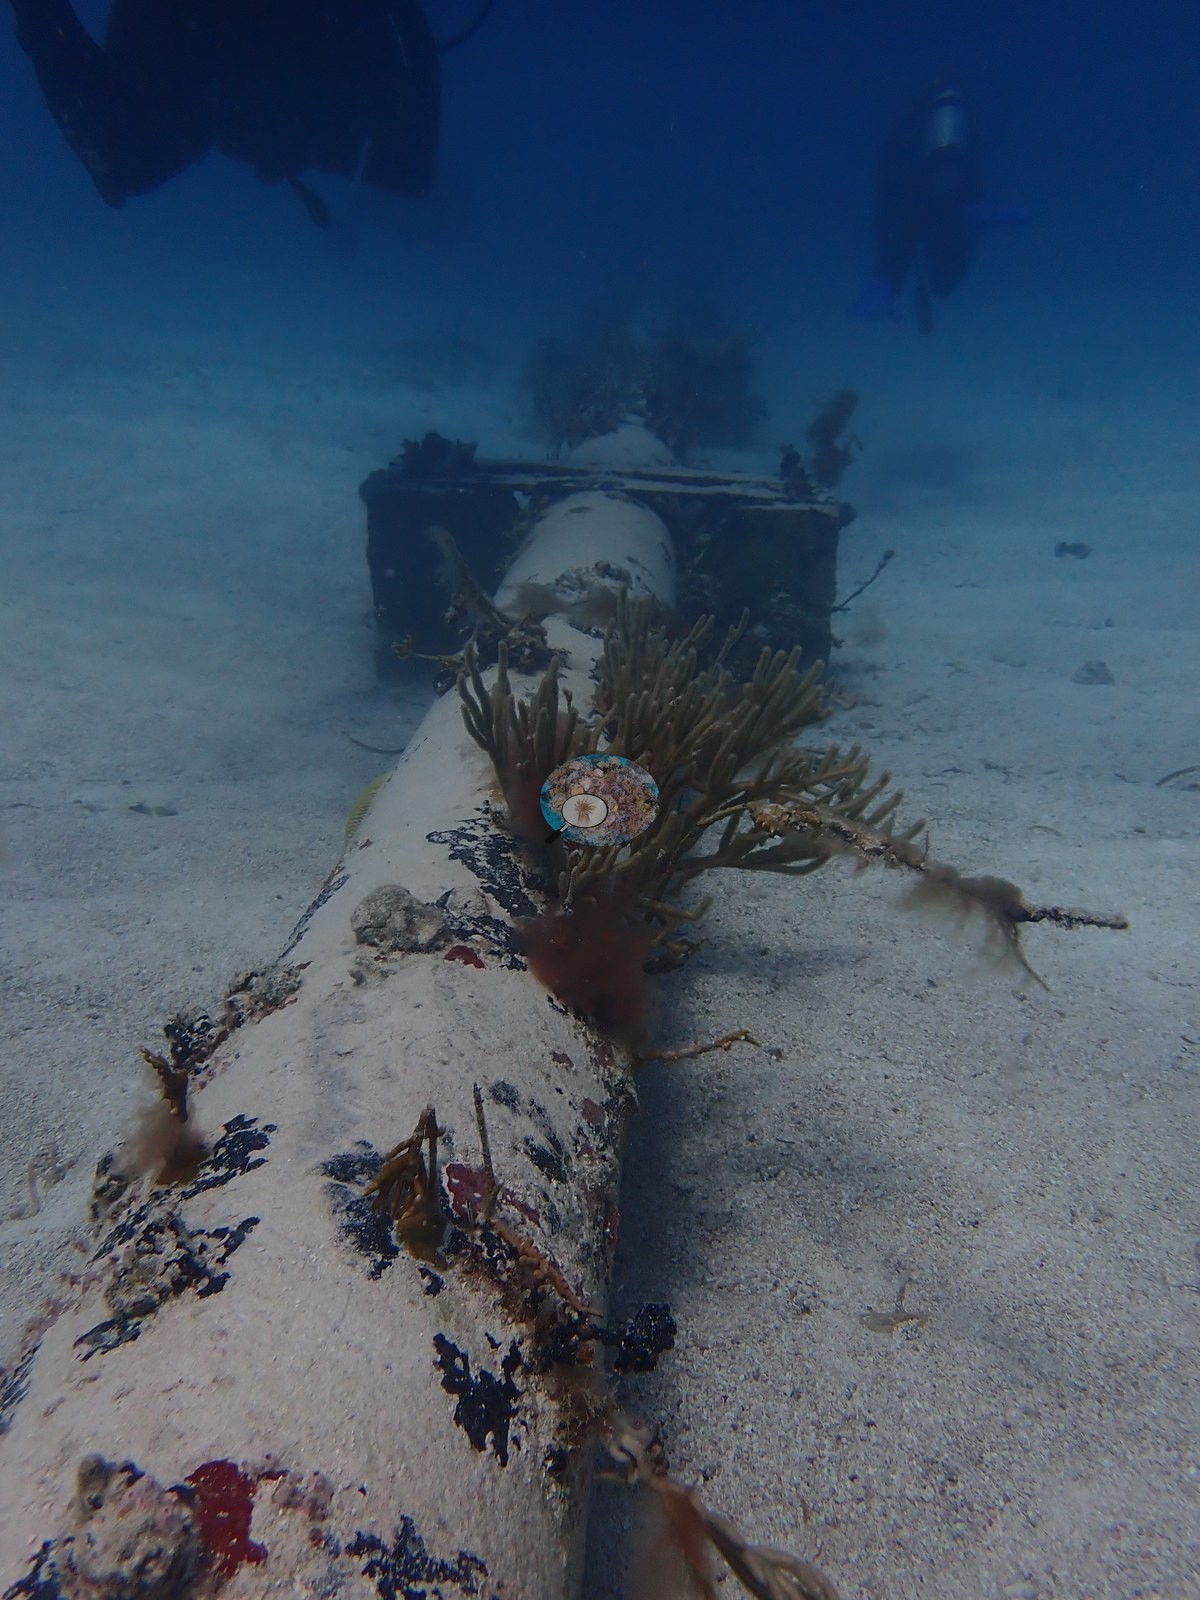
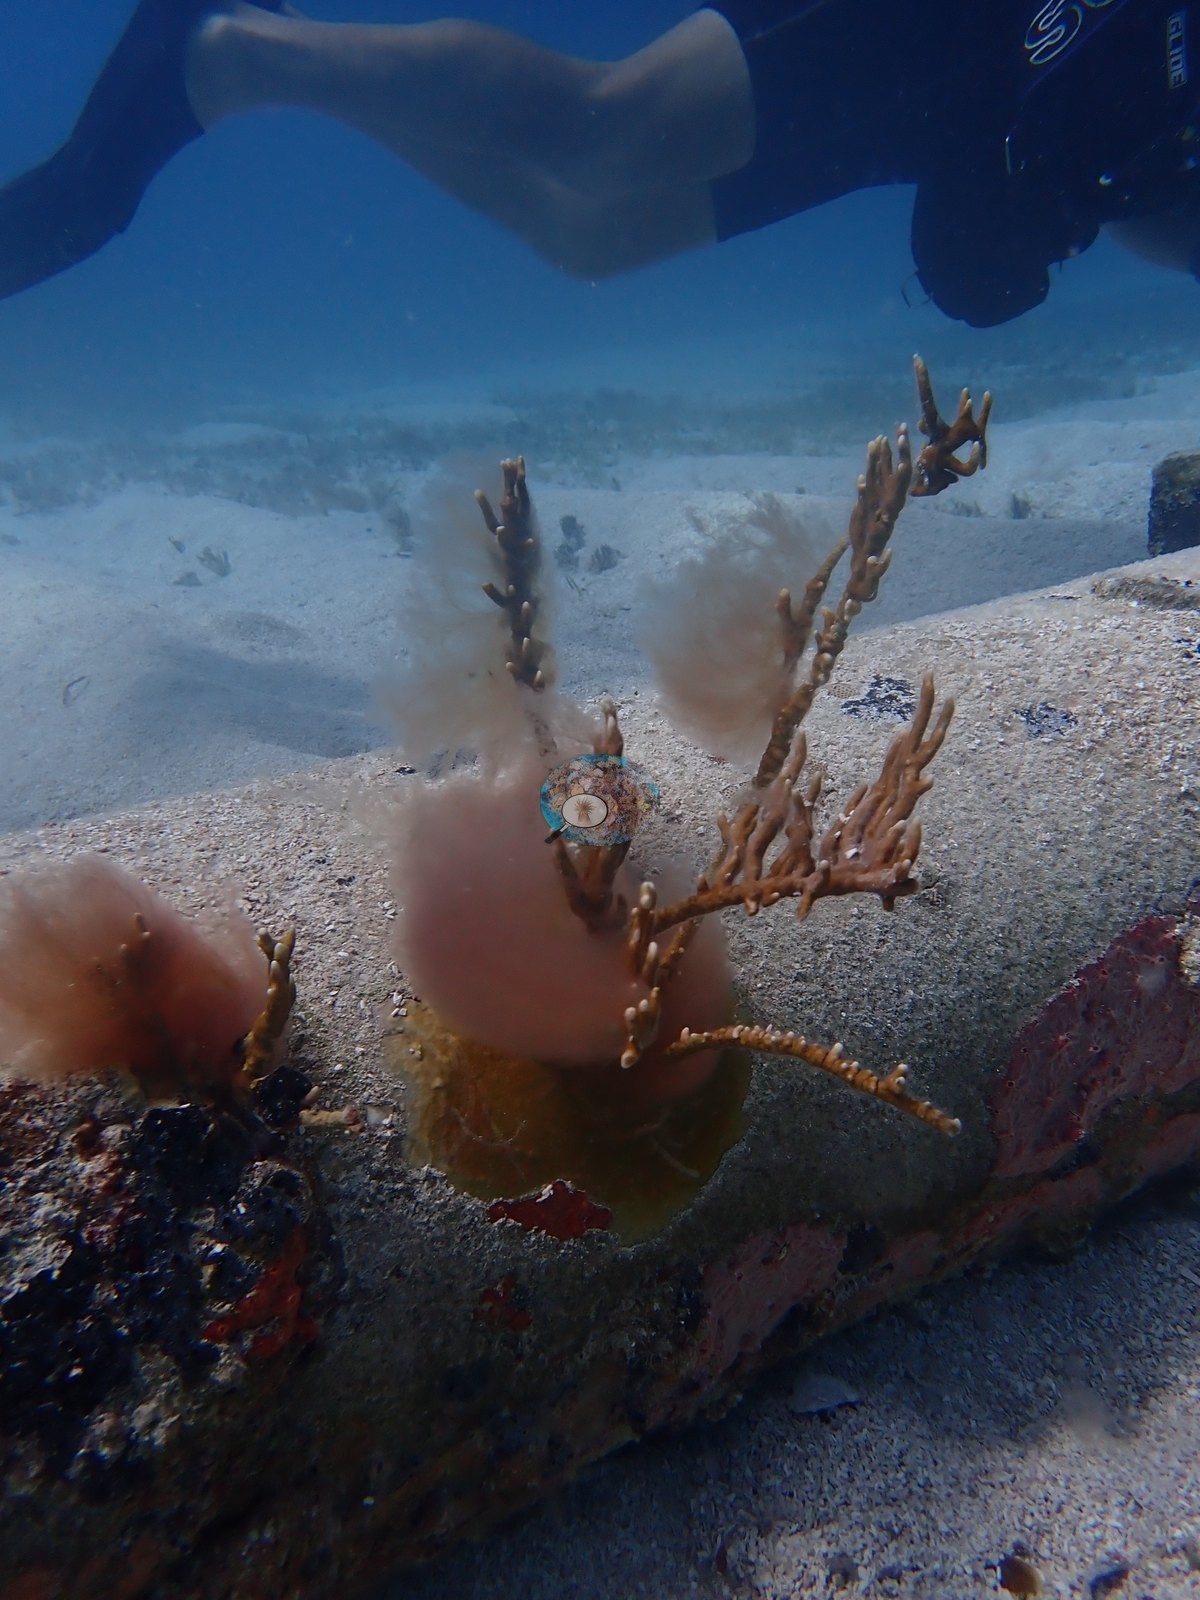
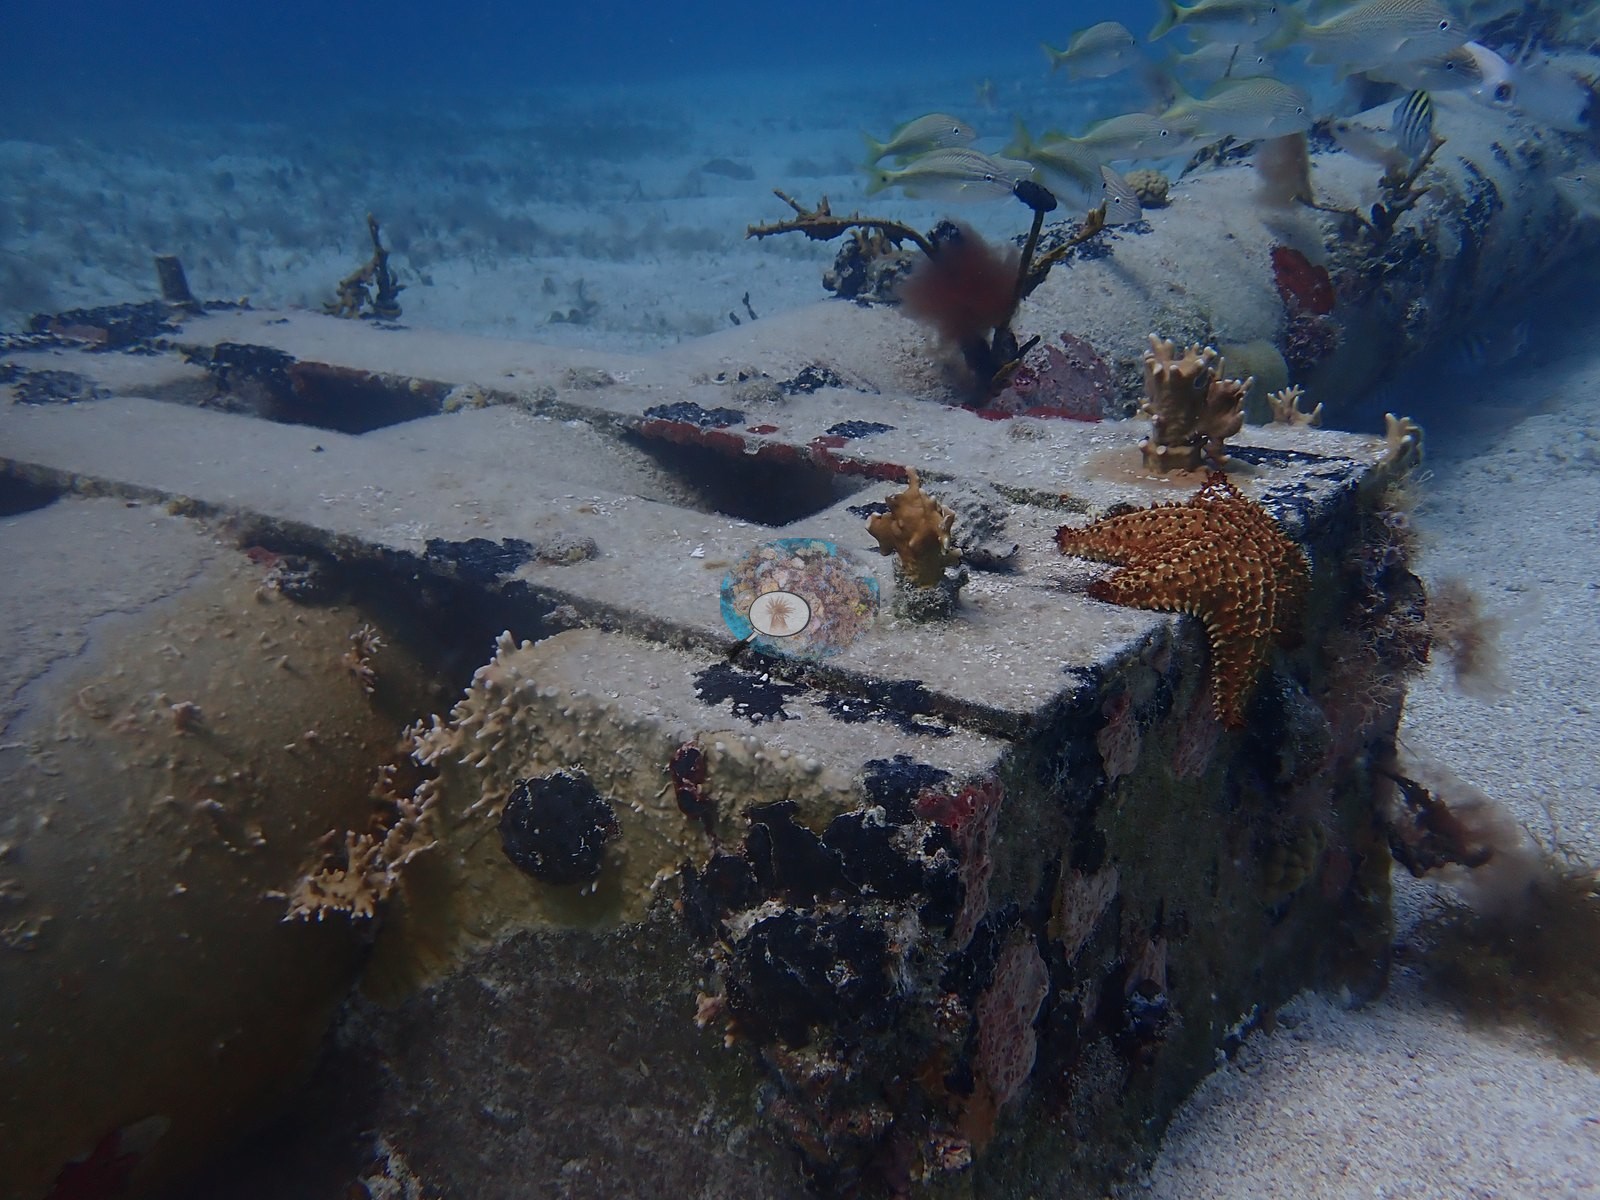
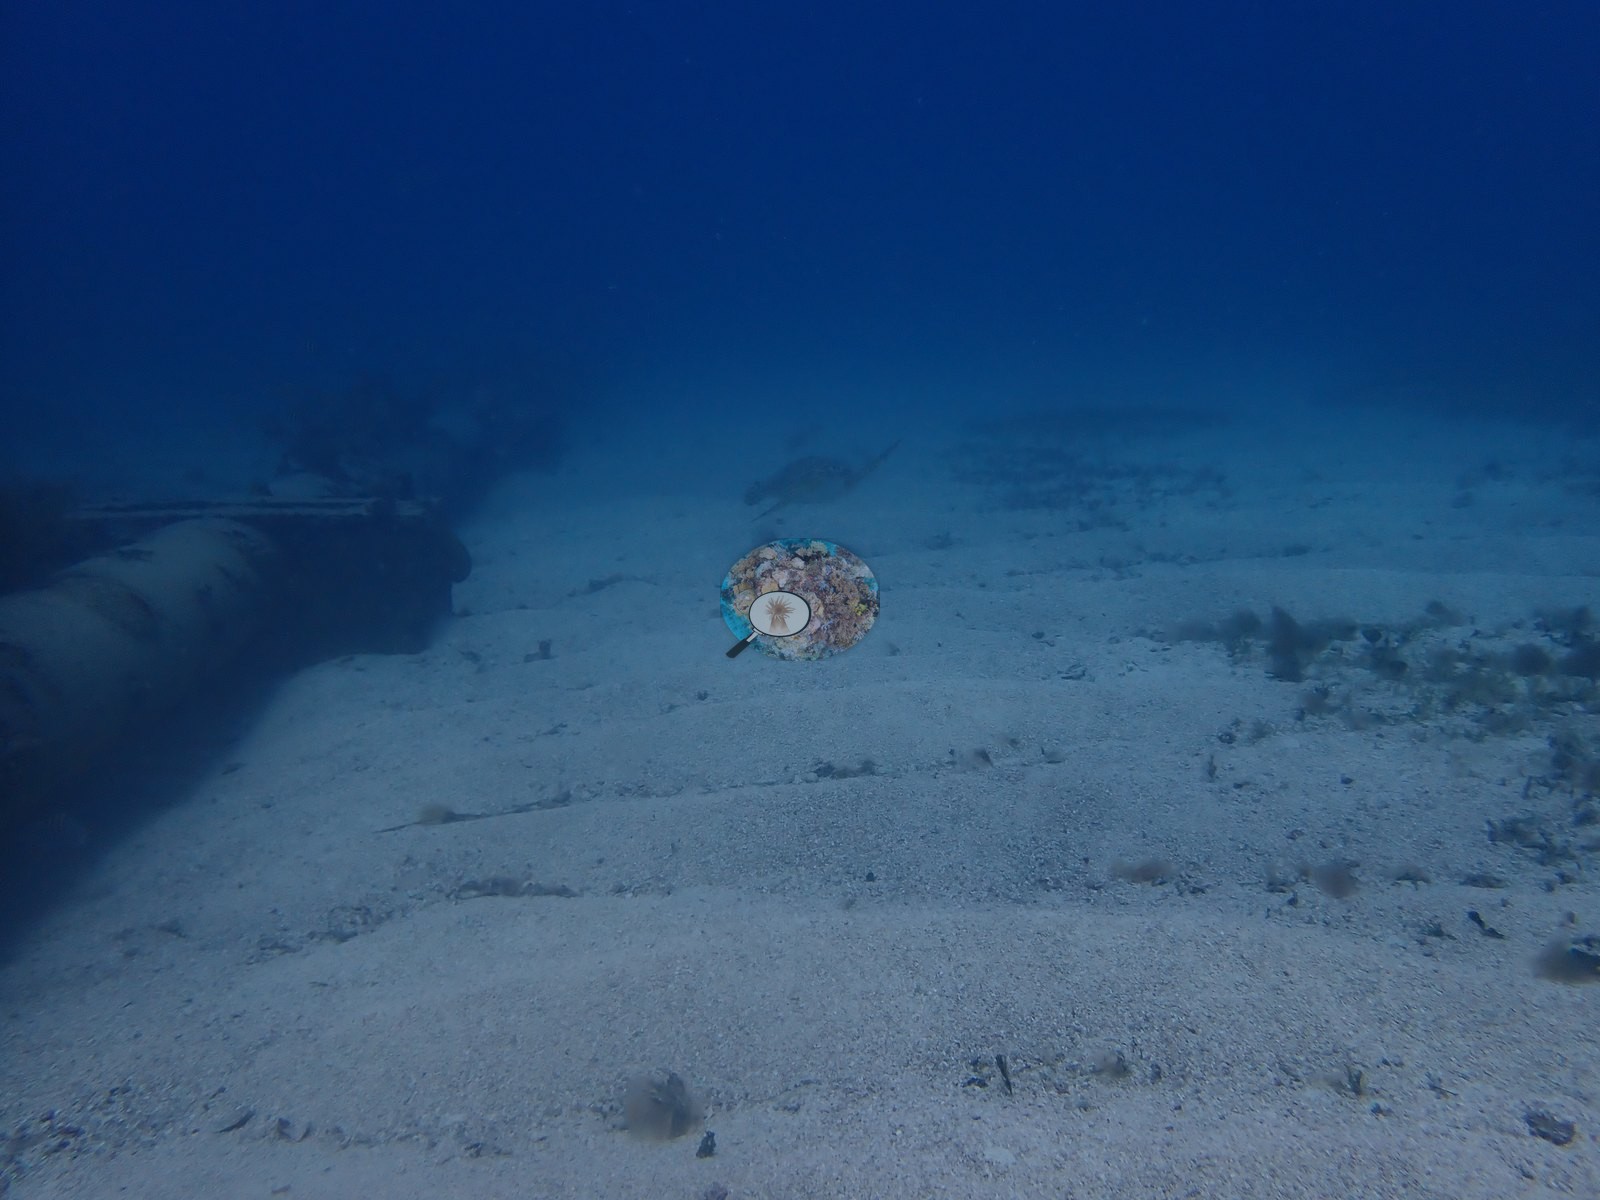
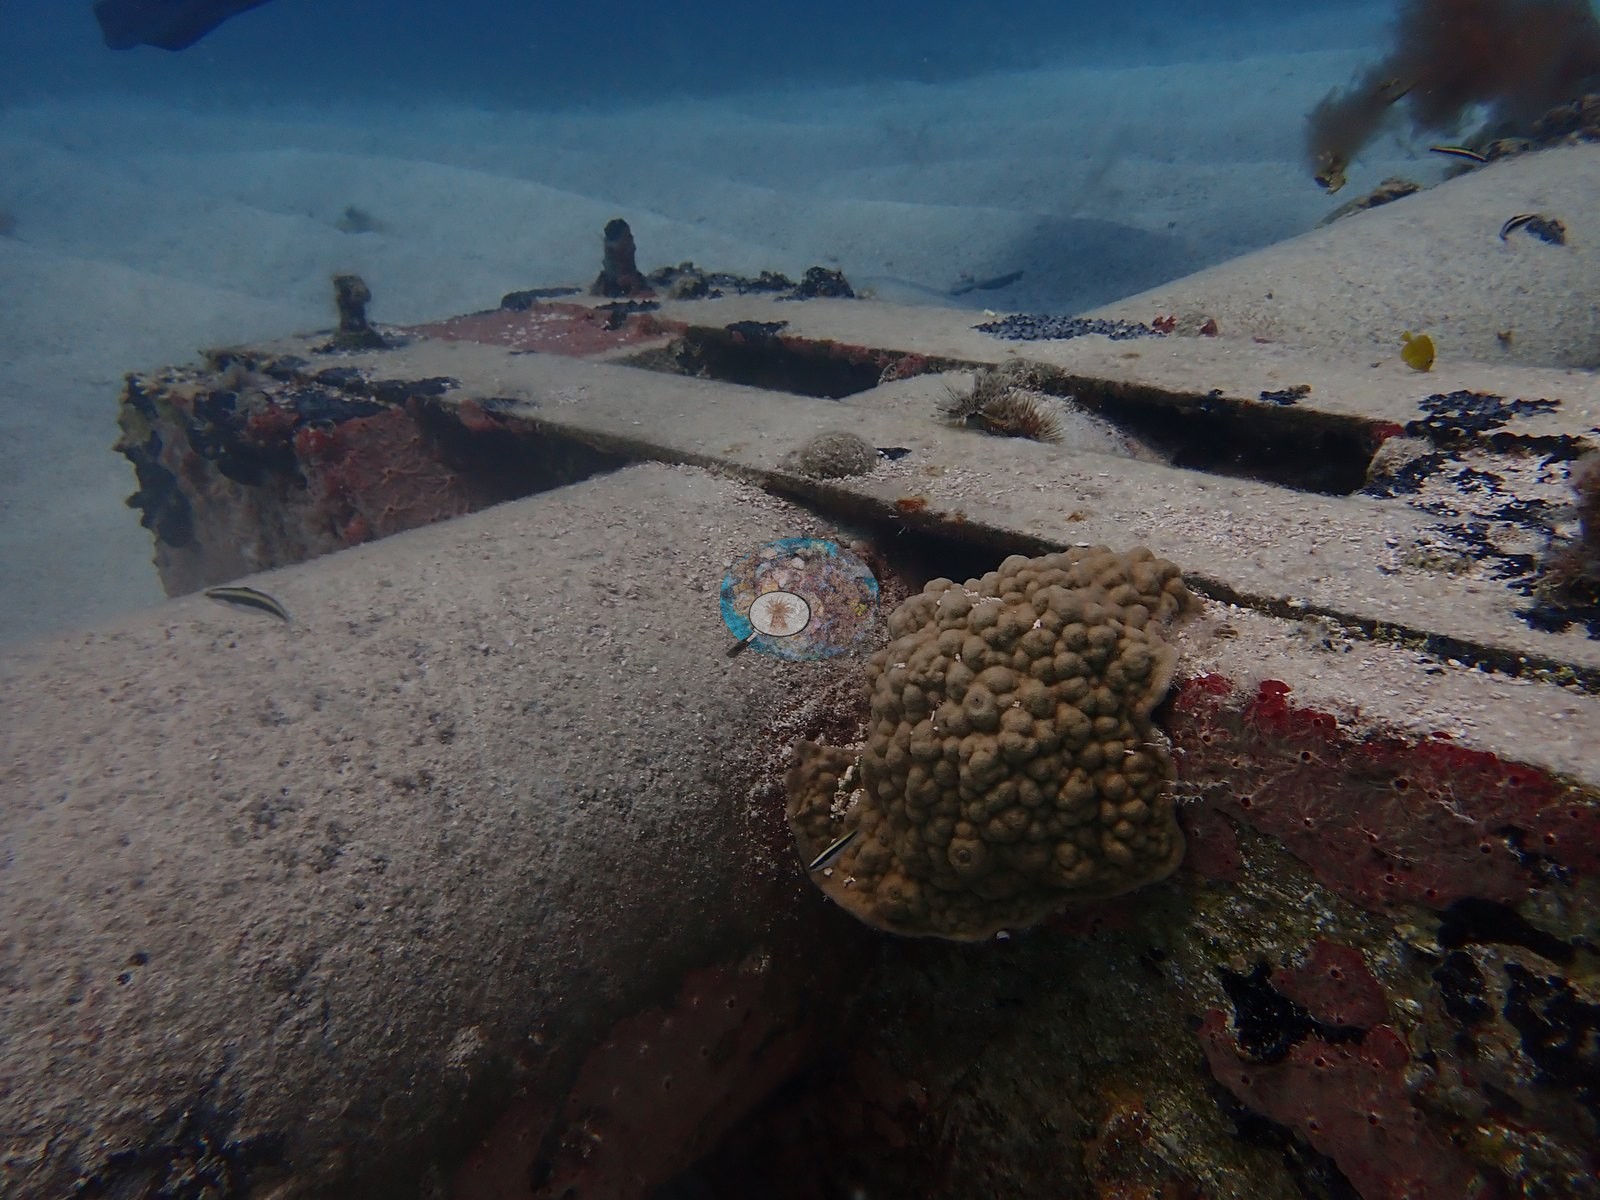
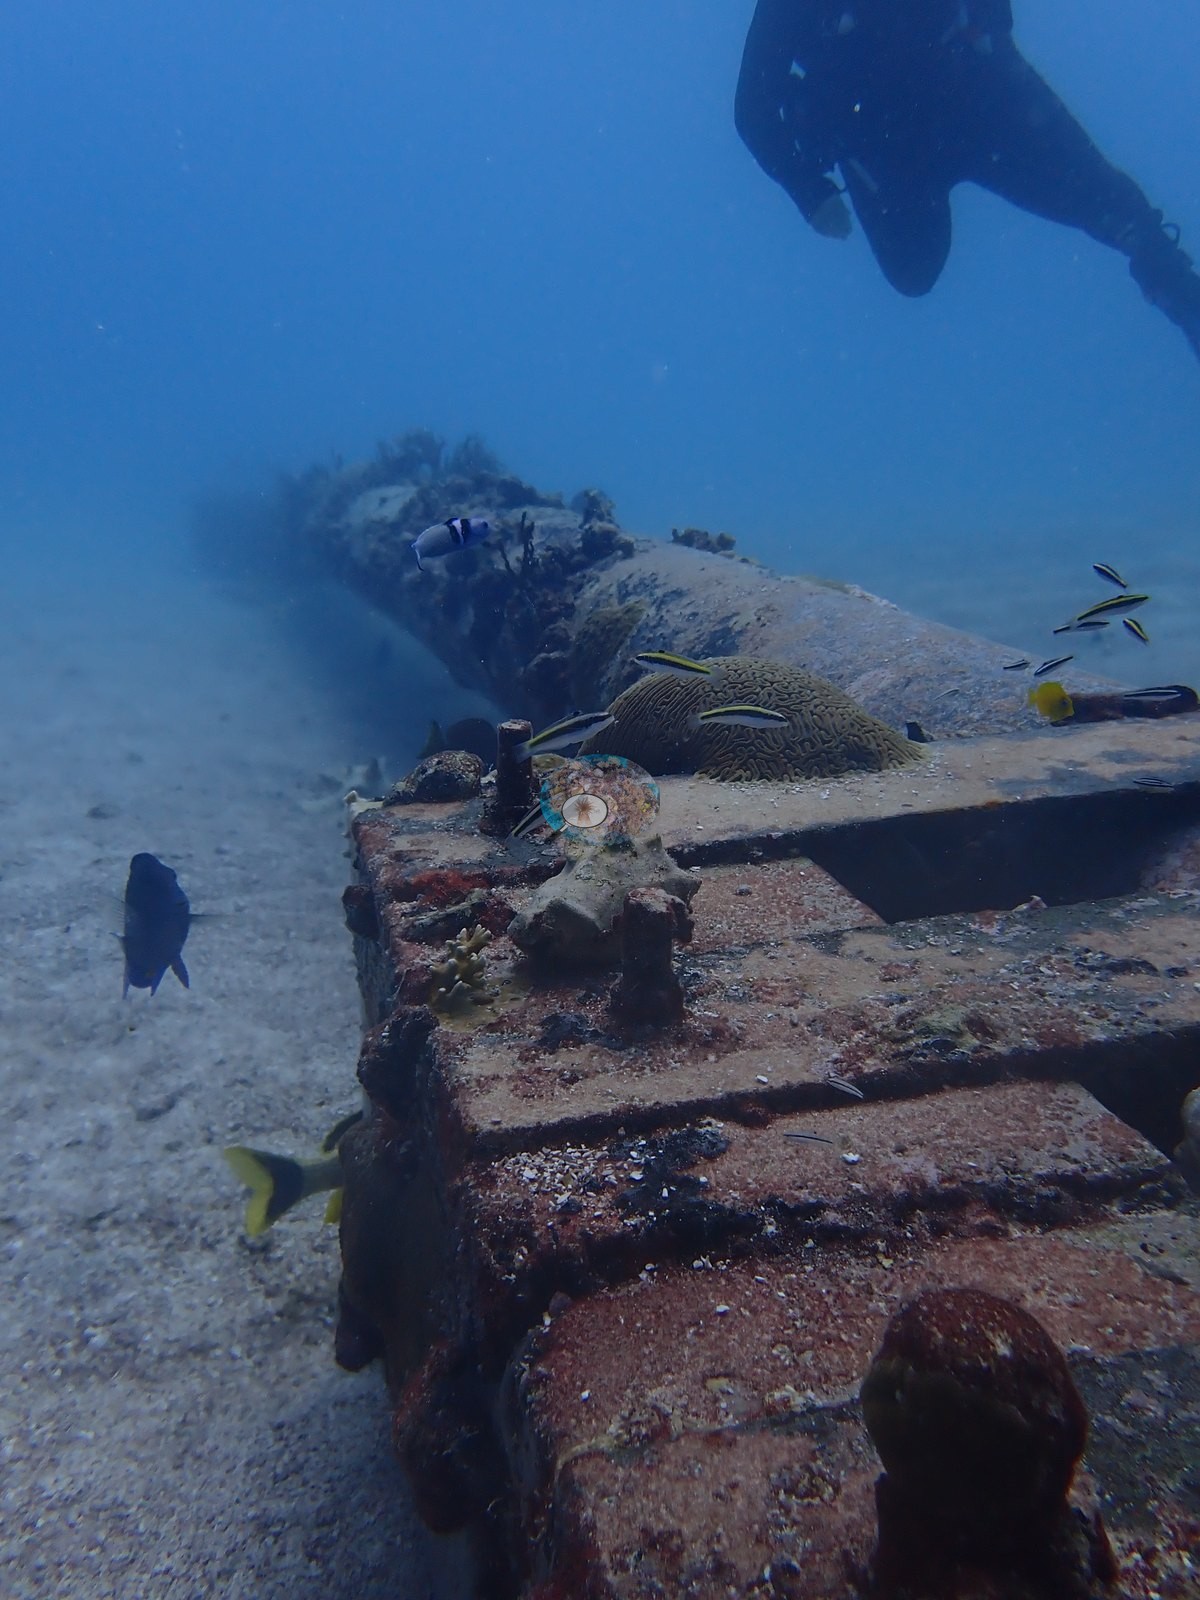
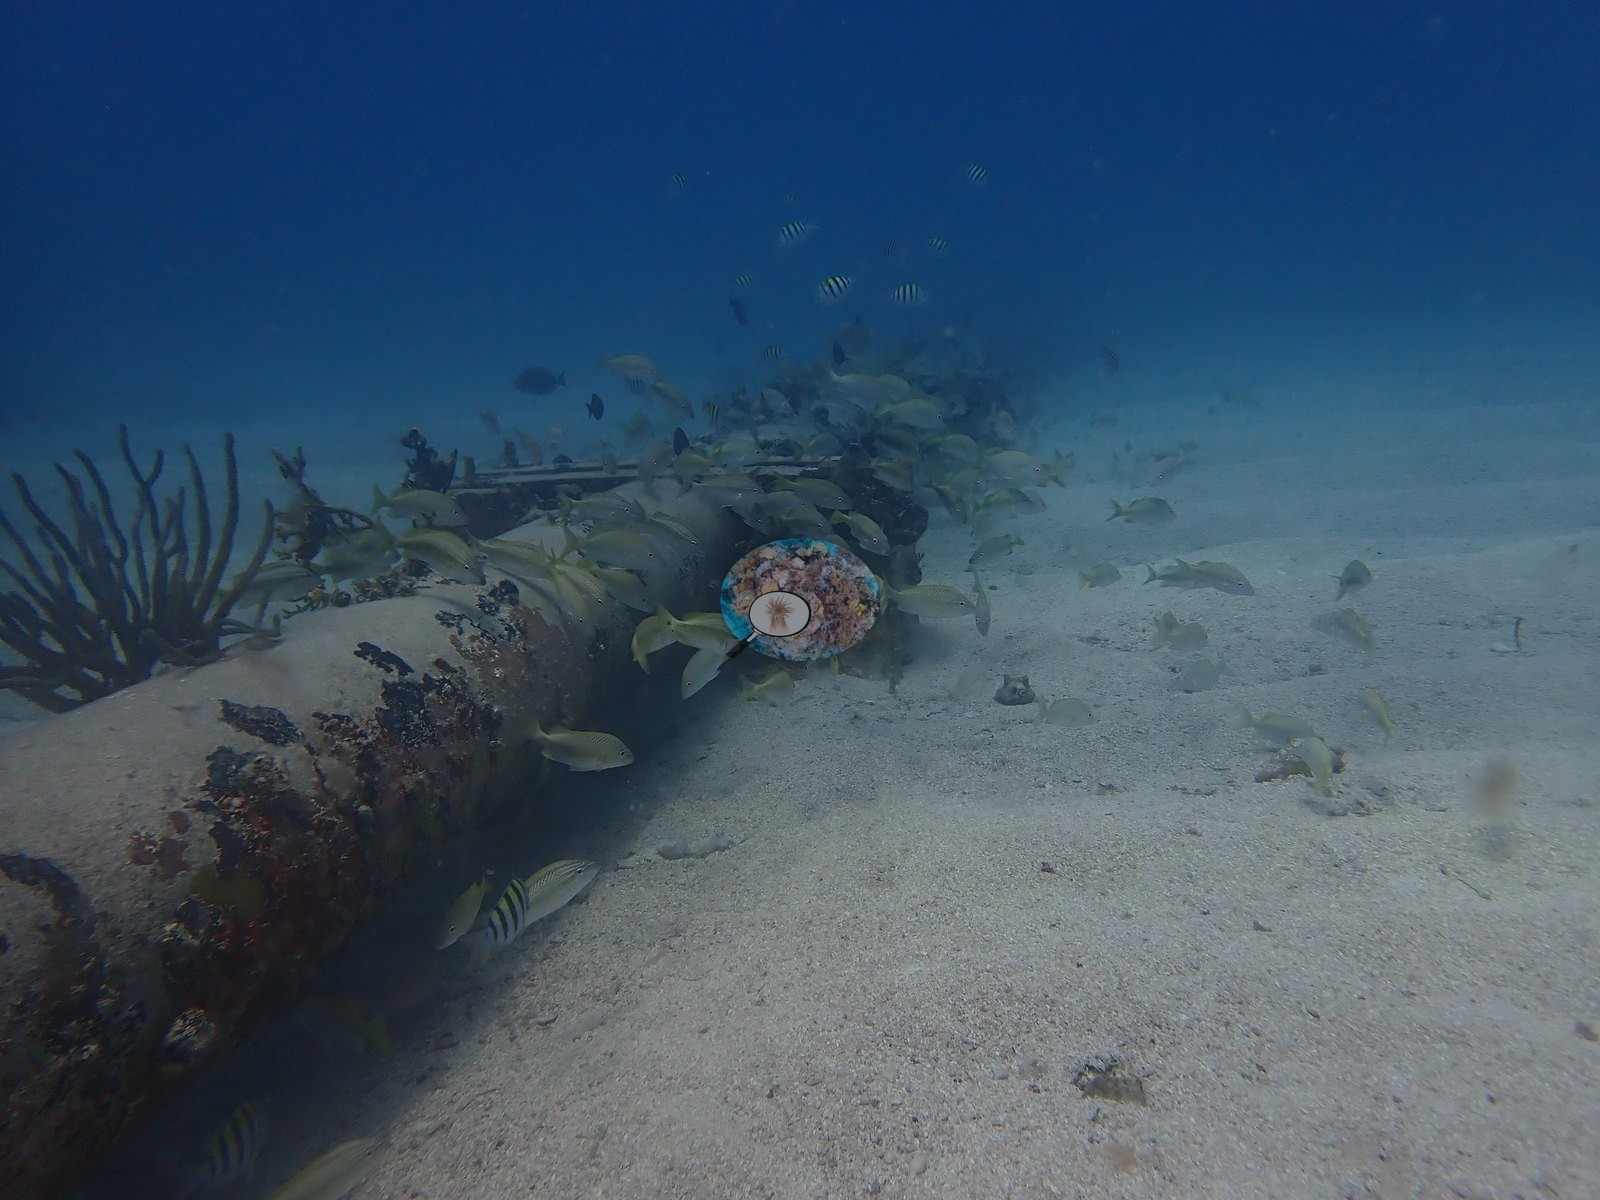
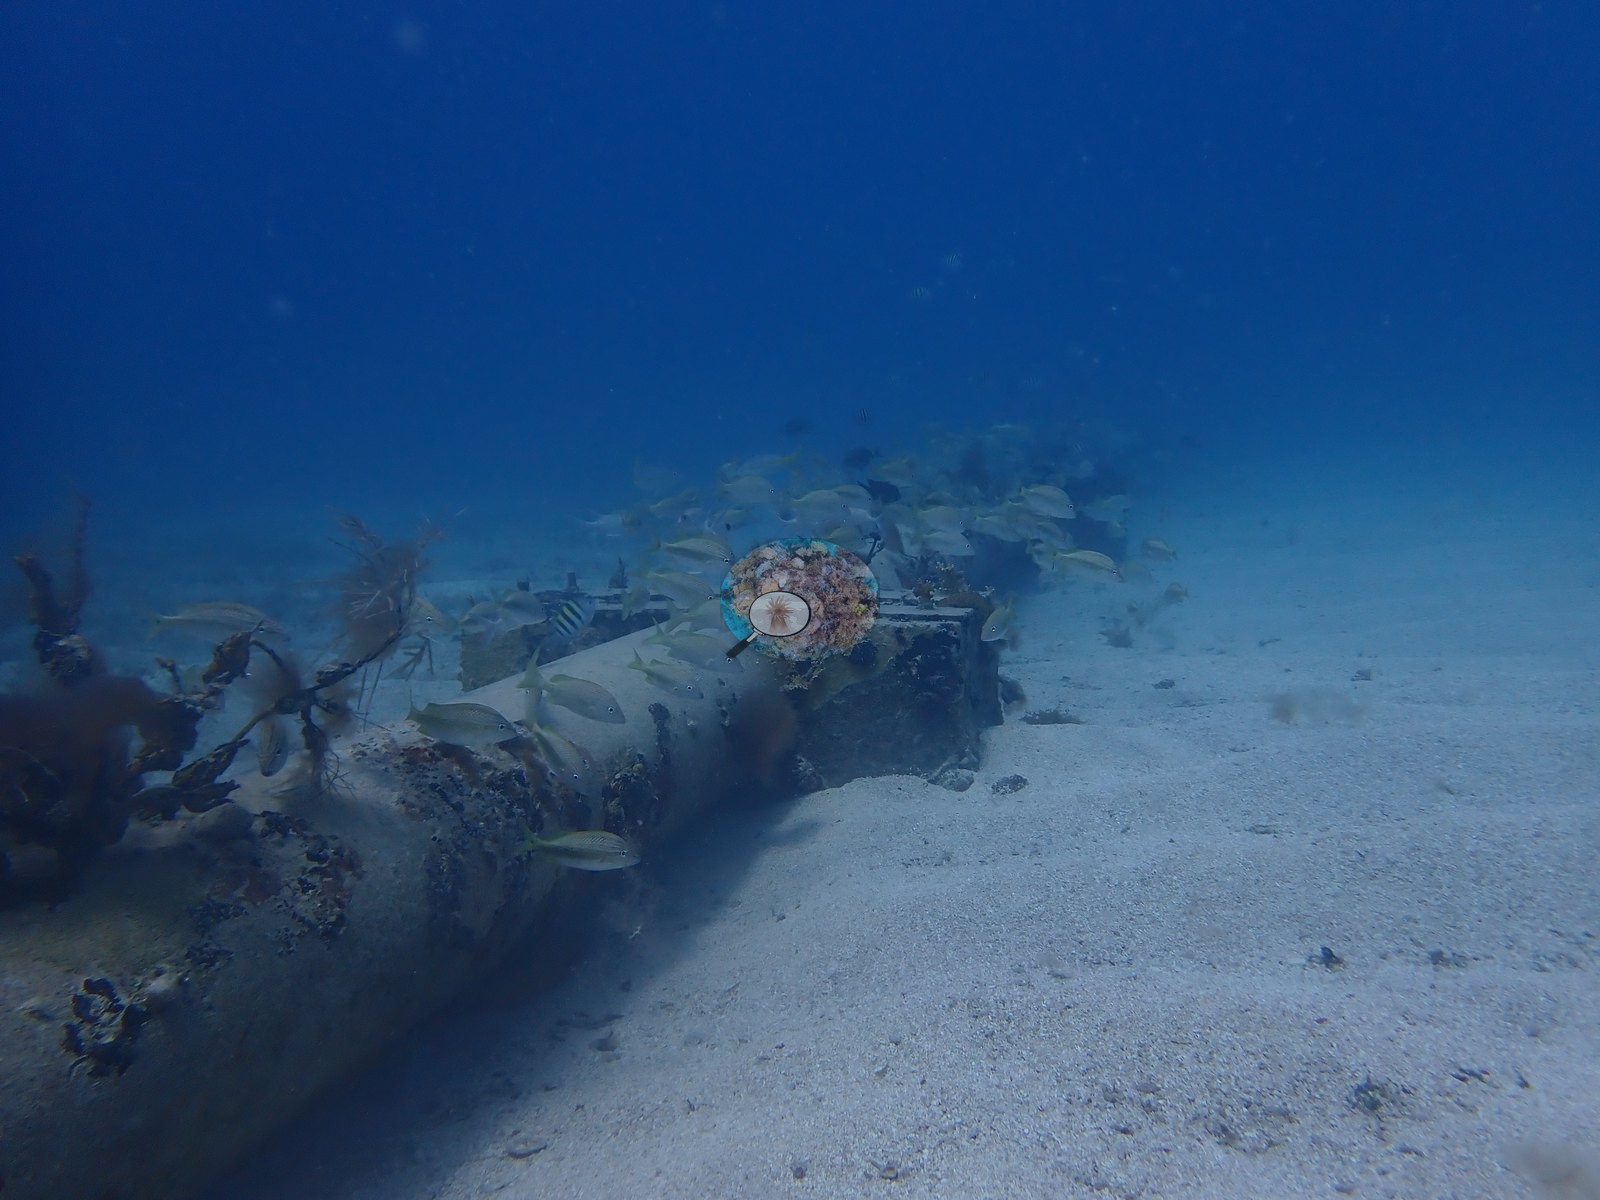
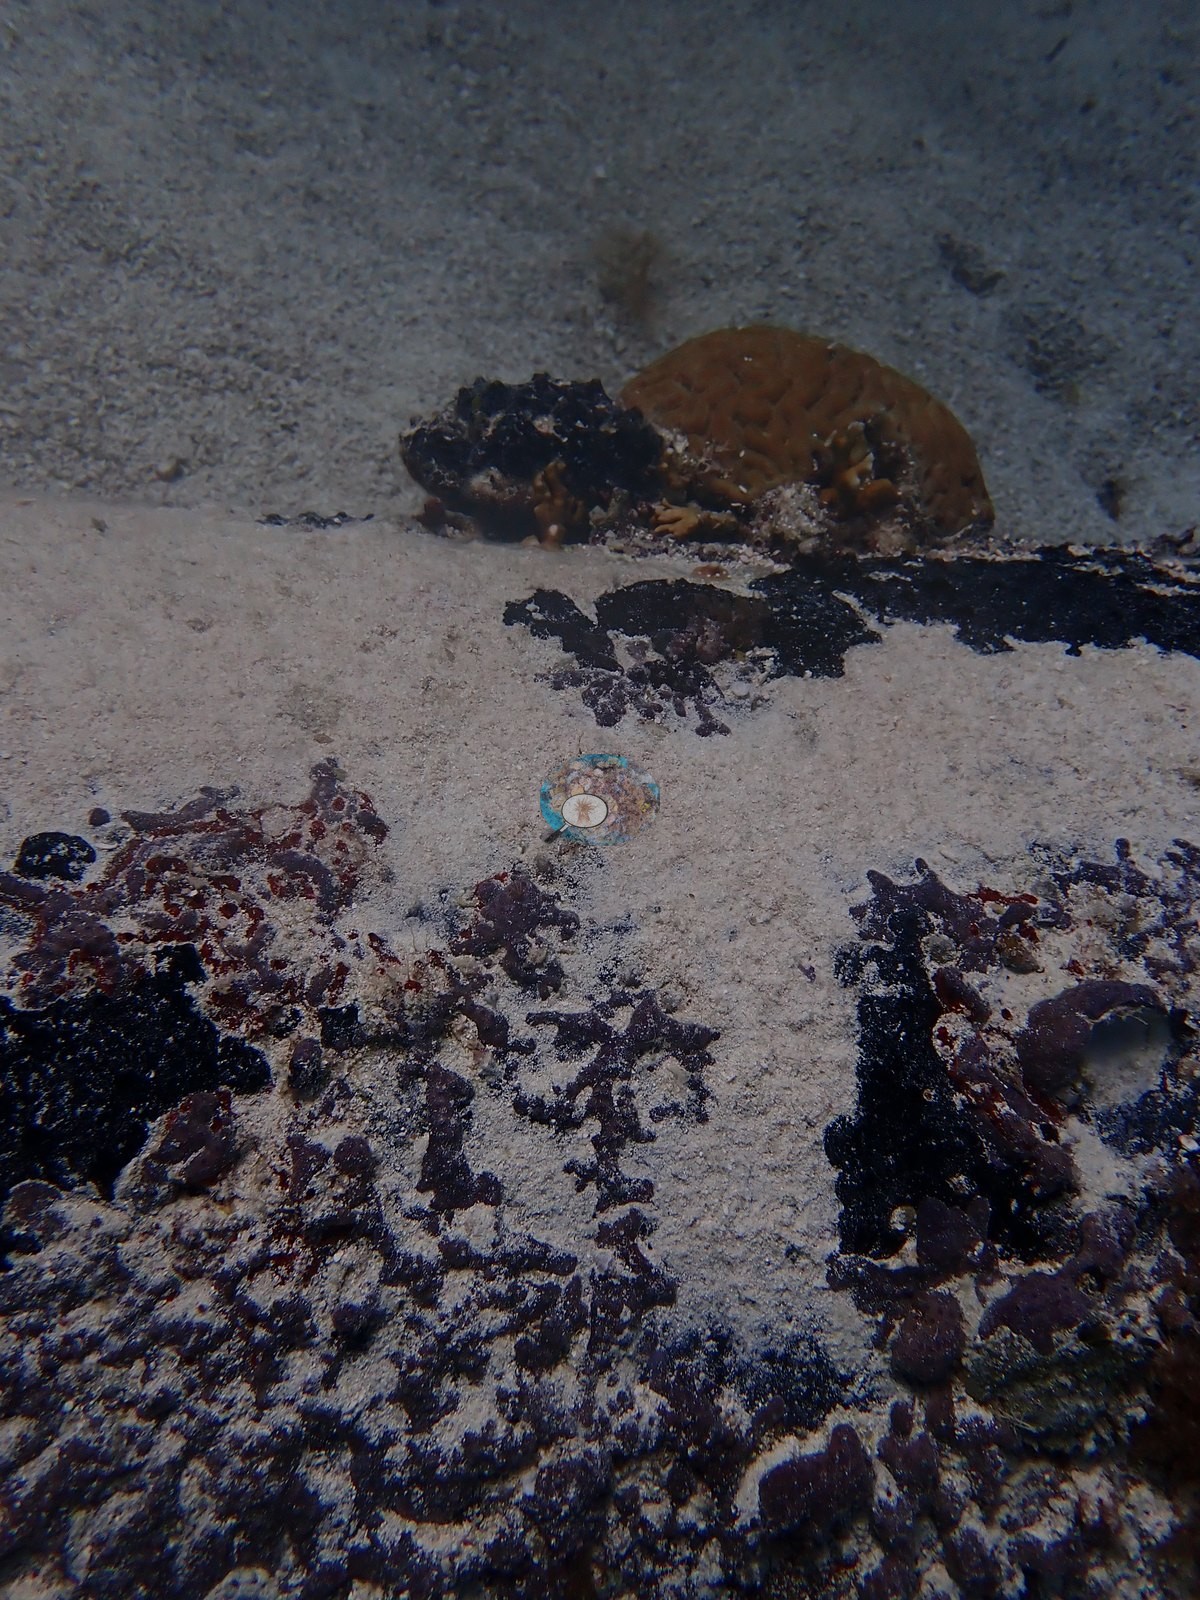
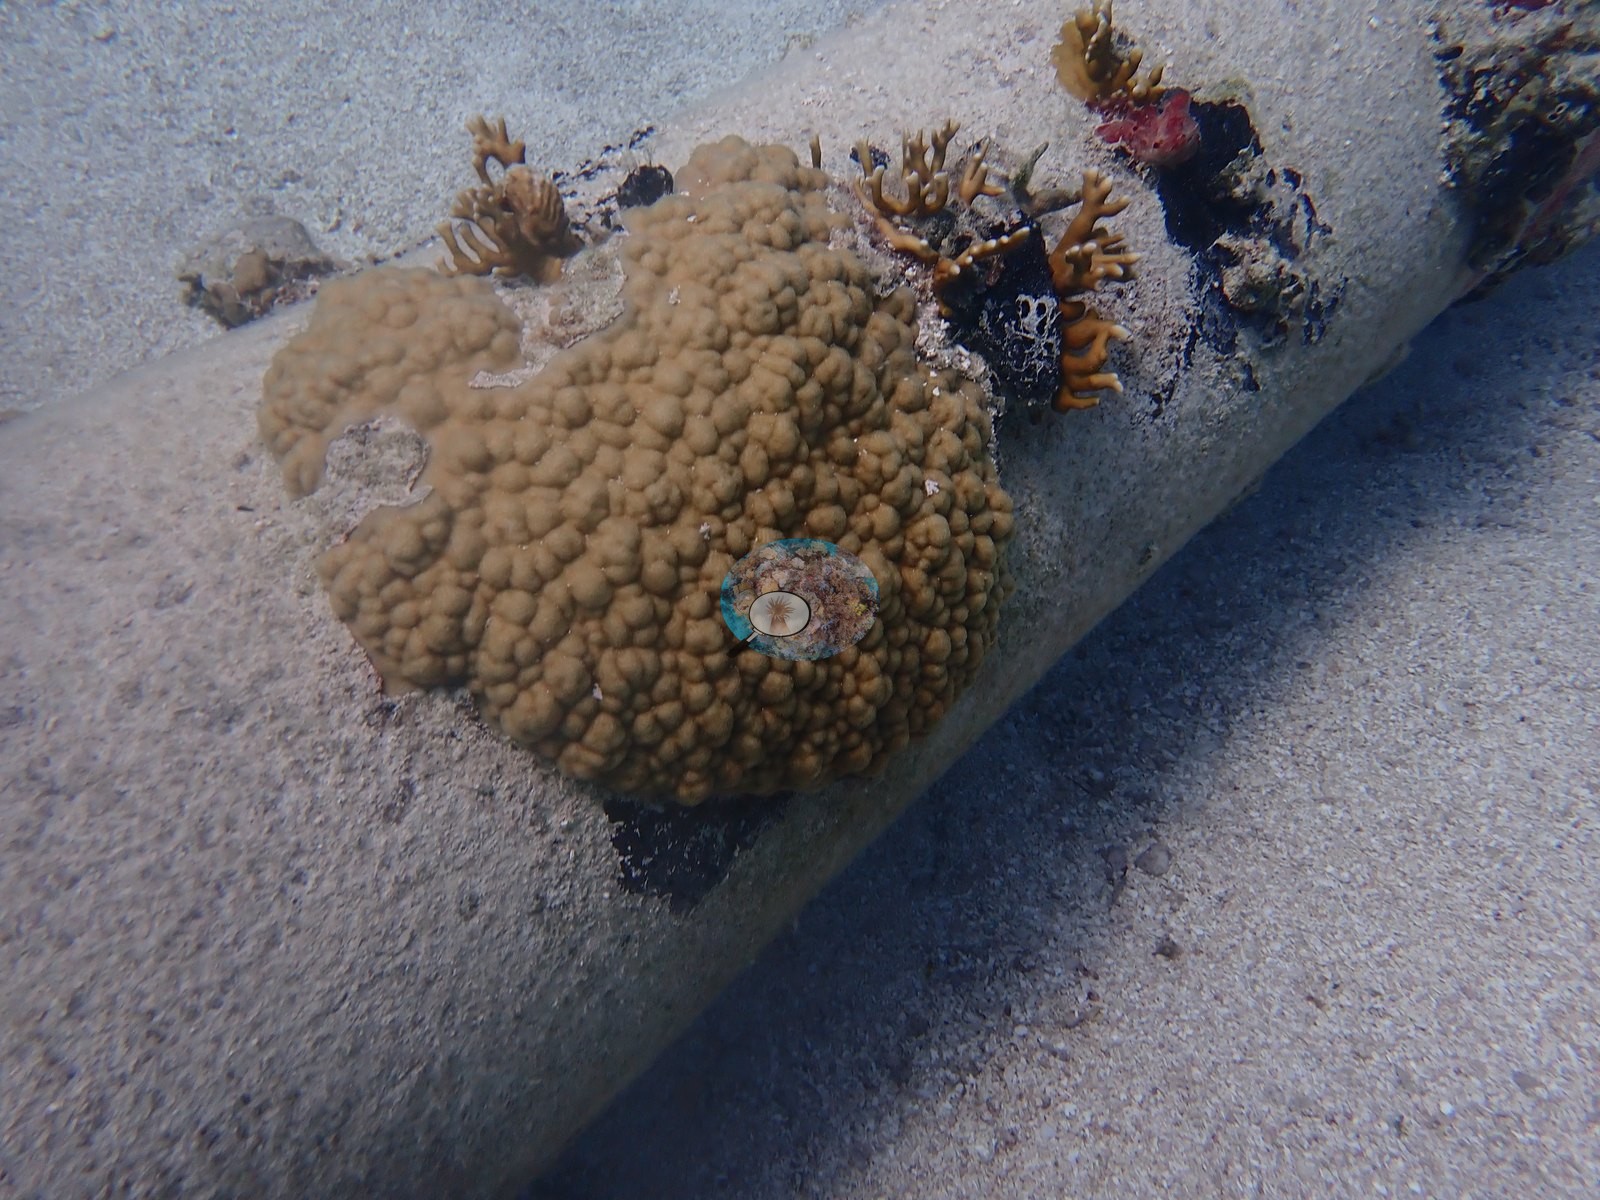
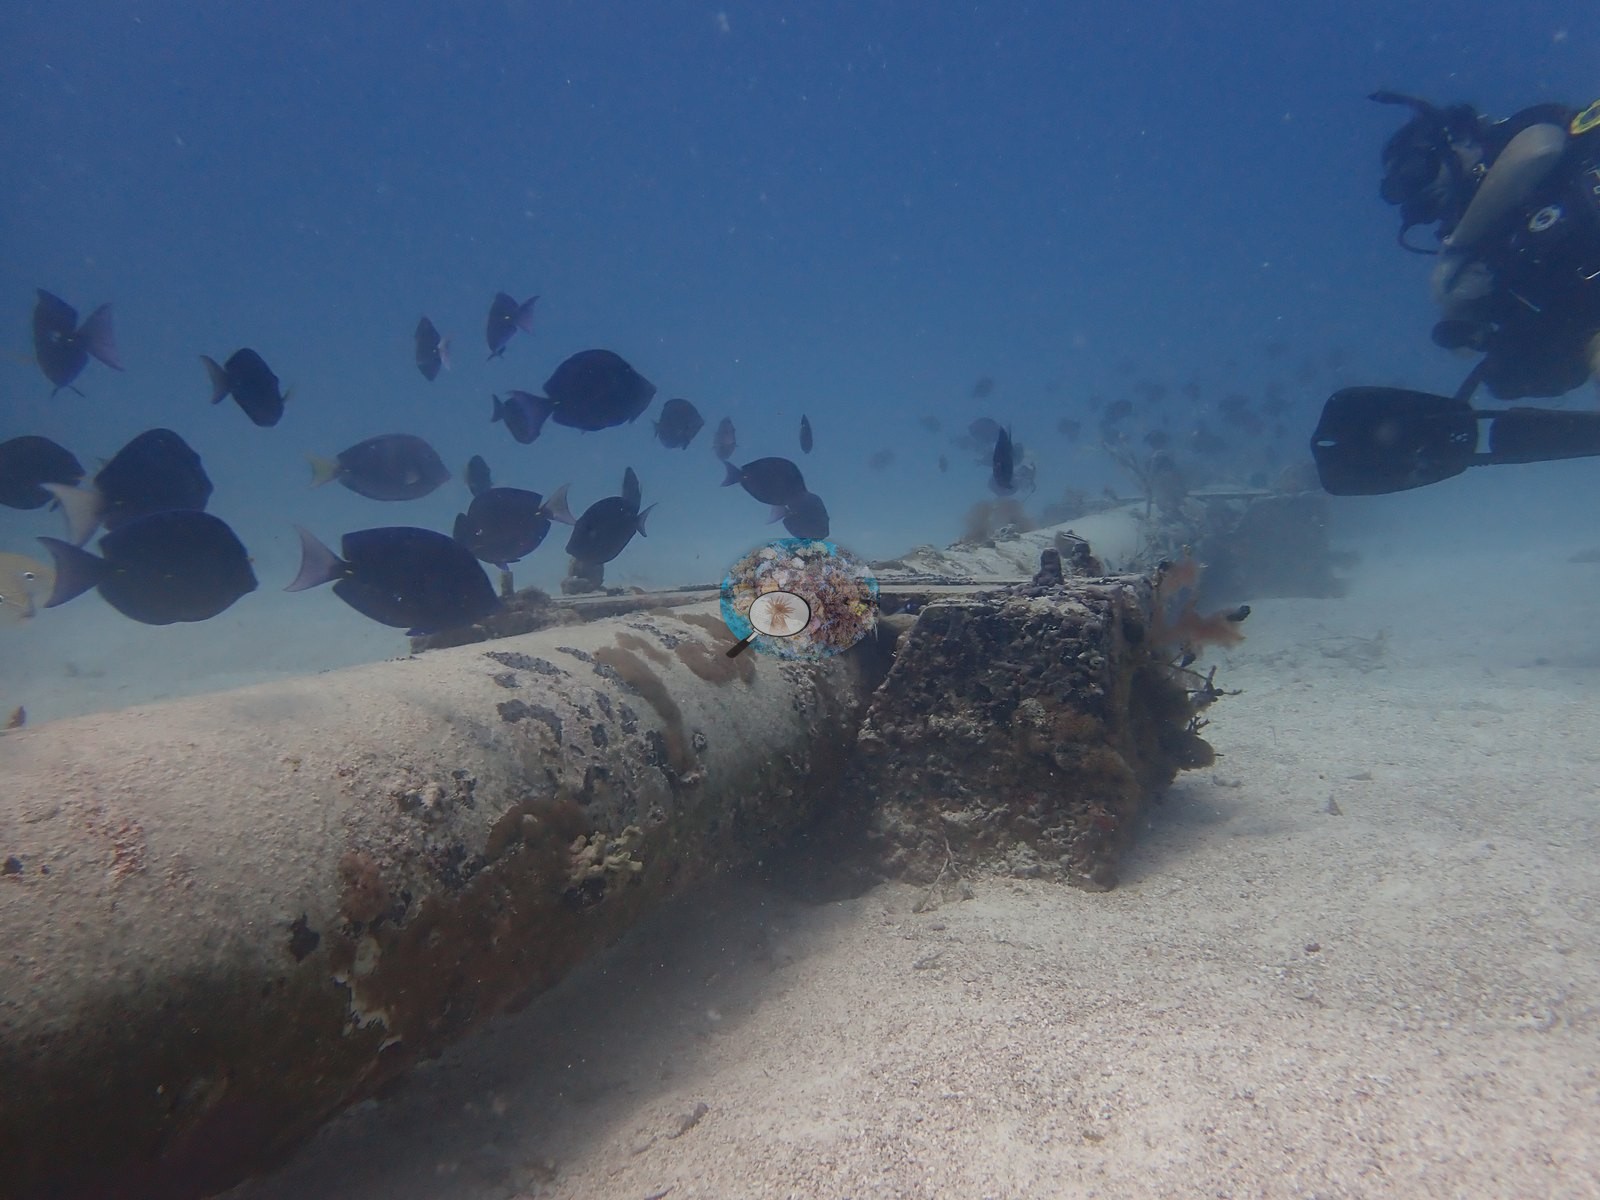
The Pipe takes its name from a long concrete pipe resting on the sand, now thoroughly colonized and functioning as an unlikely reef (e.g., Image 15, Image 53).
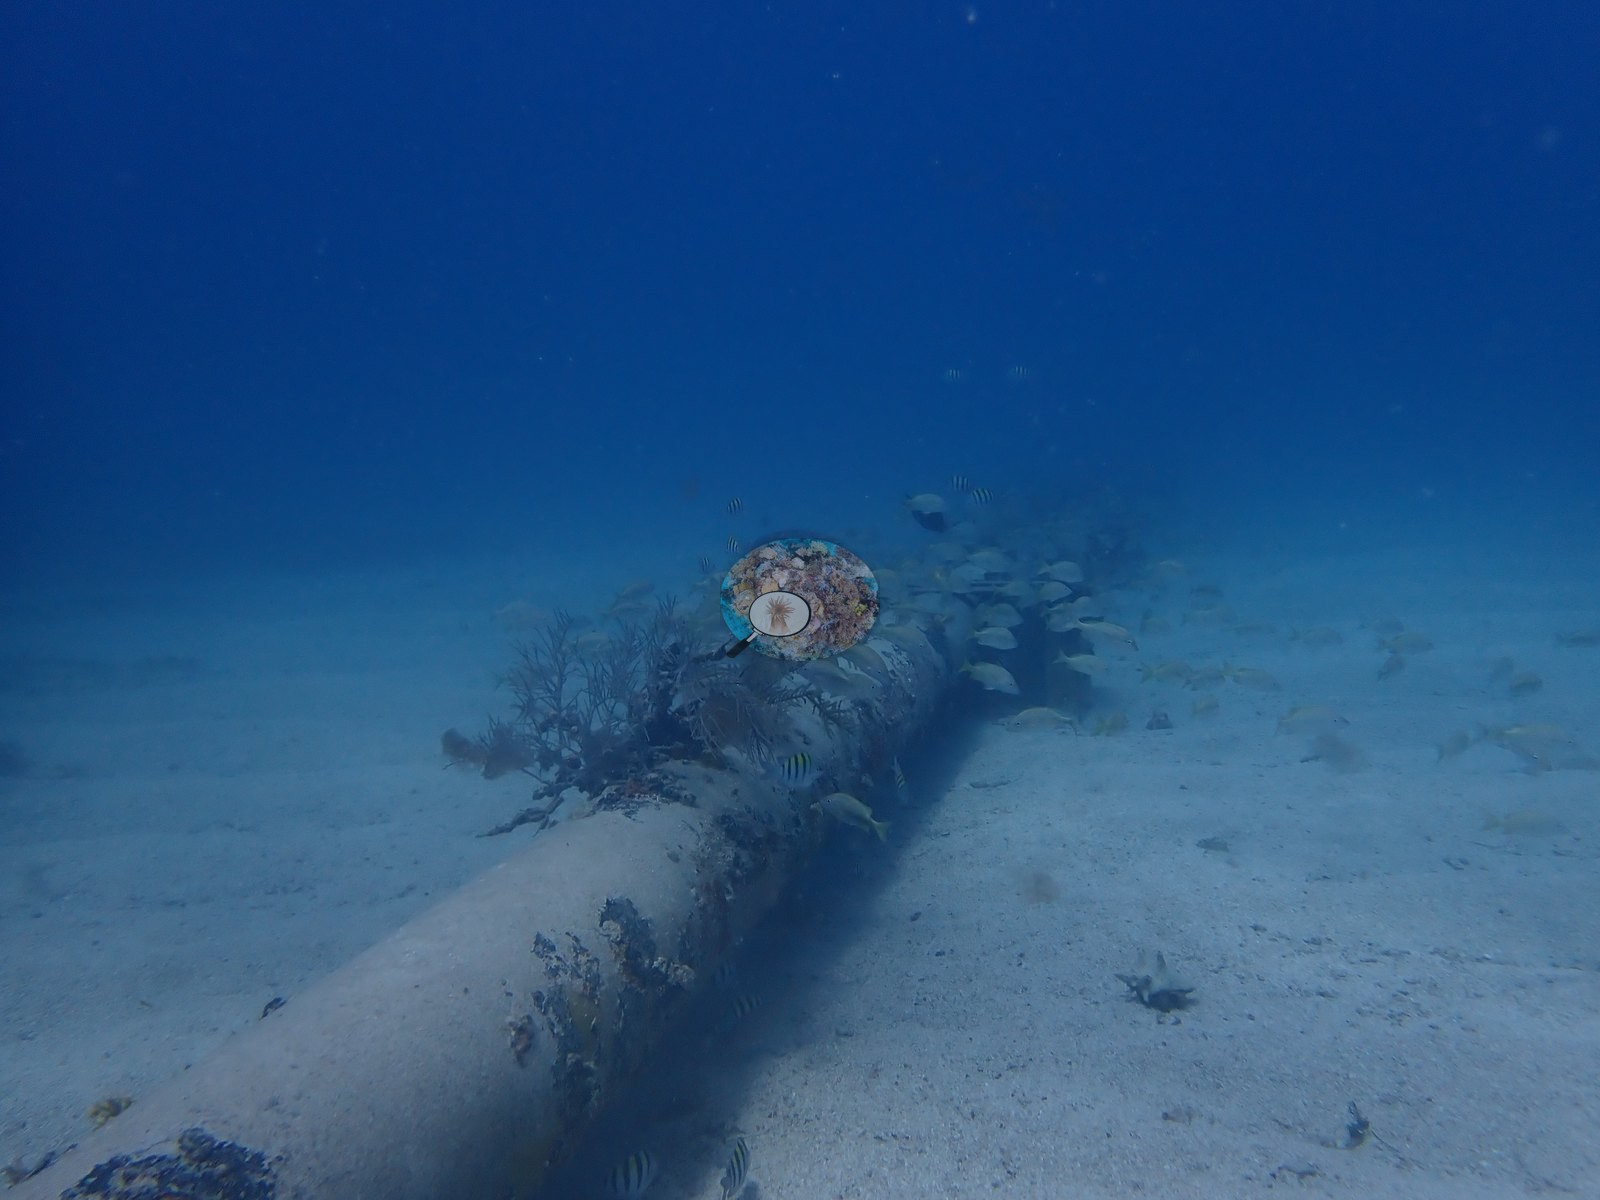
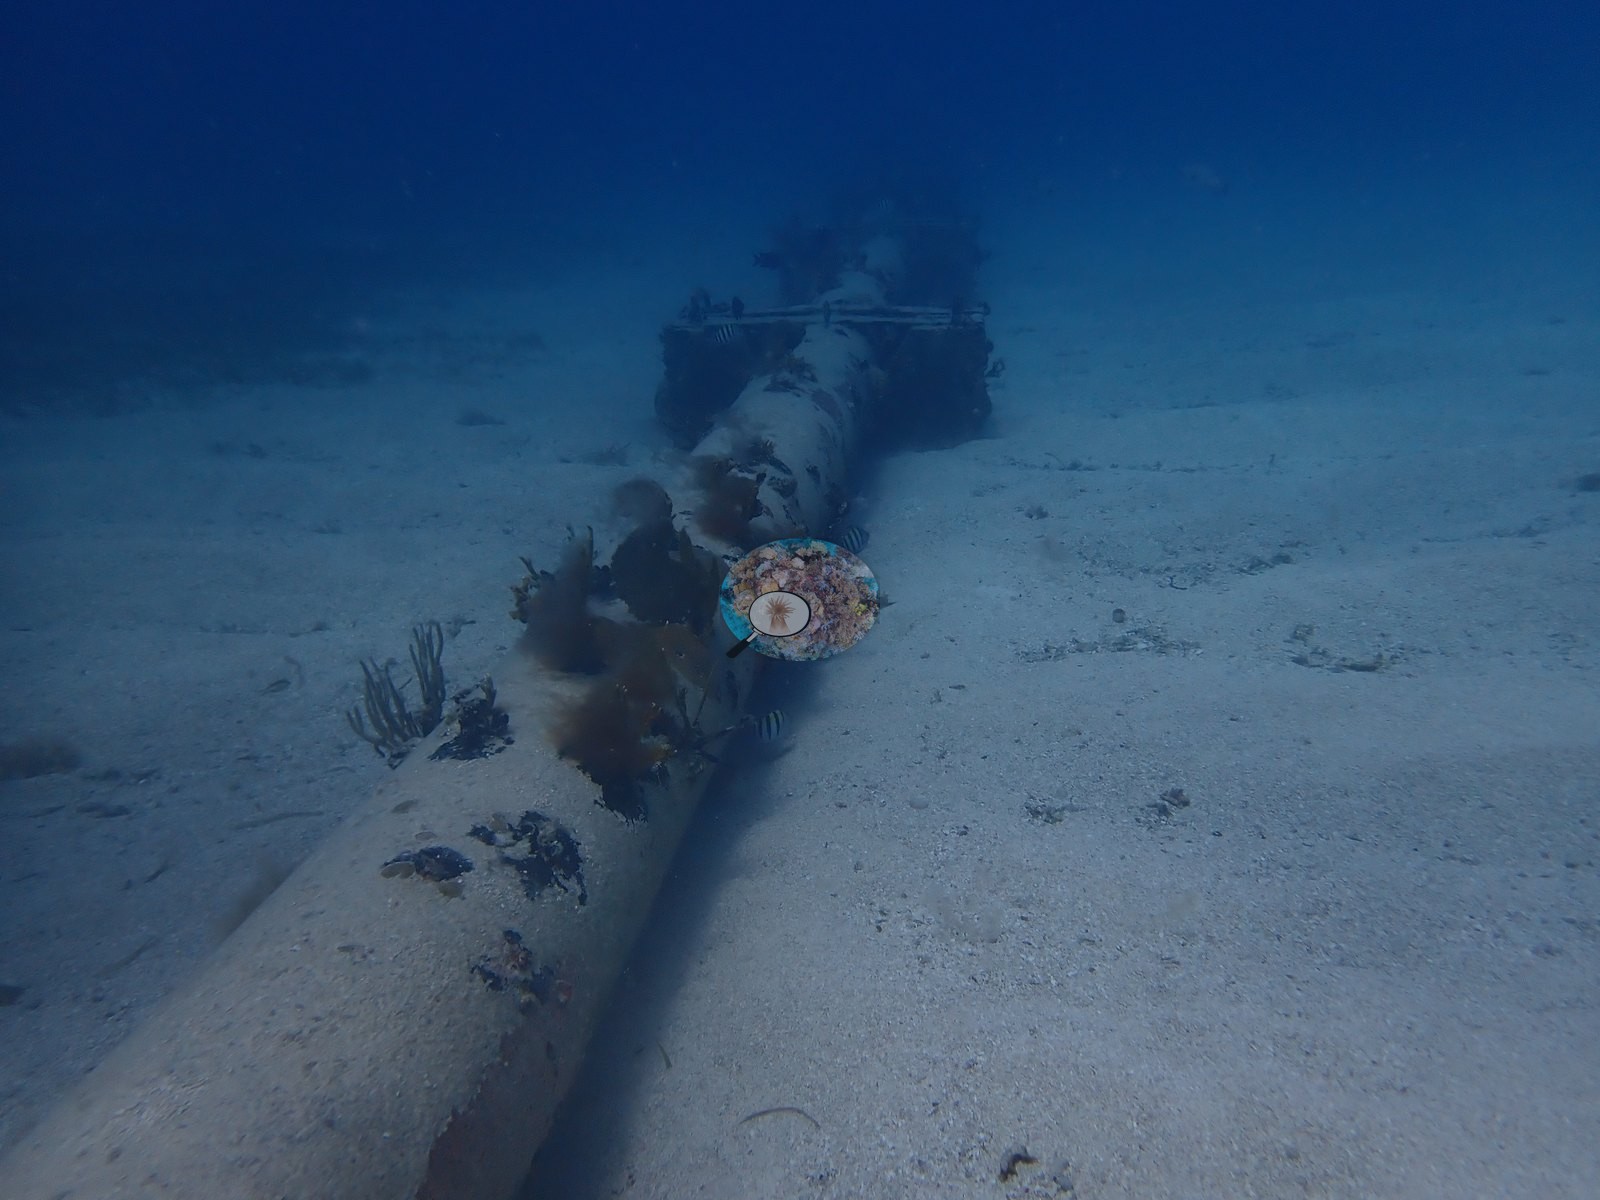
It is an easy, current-light dive that turns industrial castoff into genuine habitat — proof that almost anything left on a Caribbean seafloor long enough becomes a reef.
General benthic features
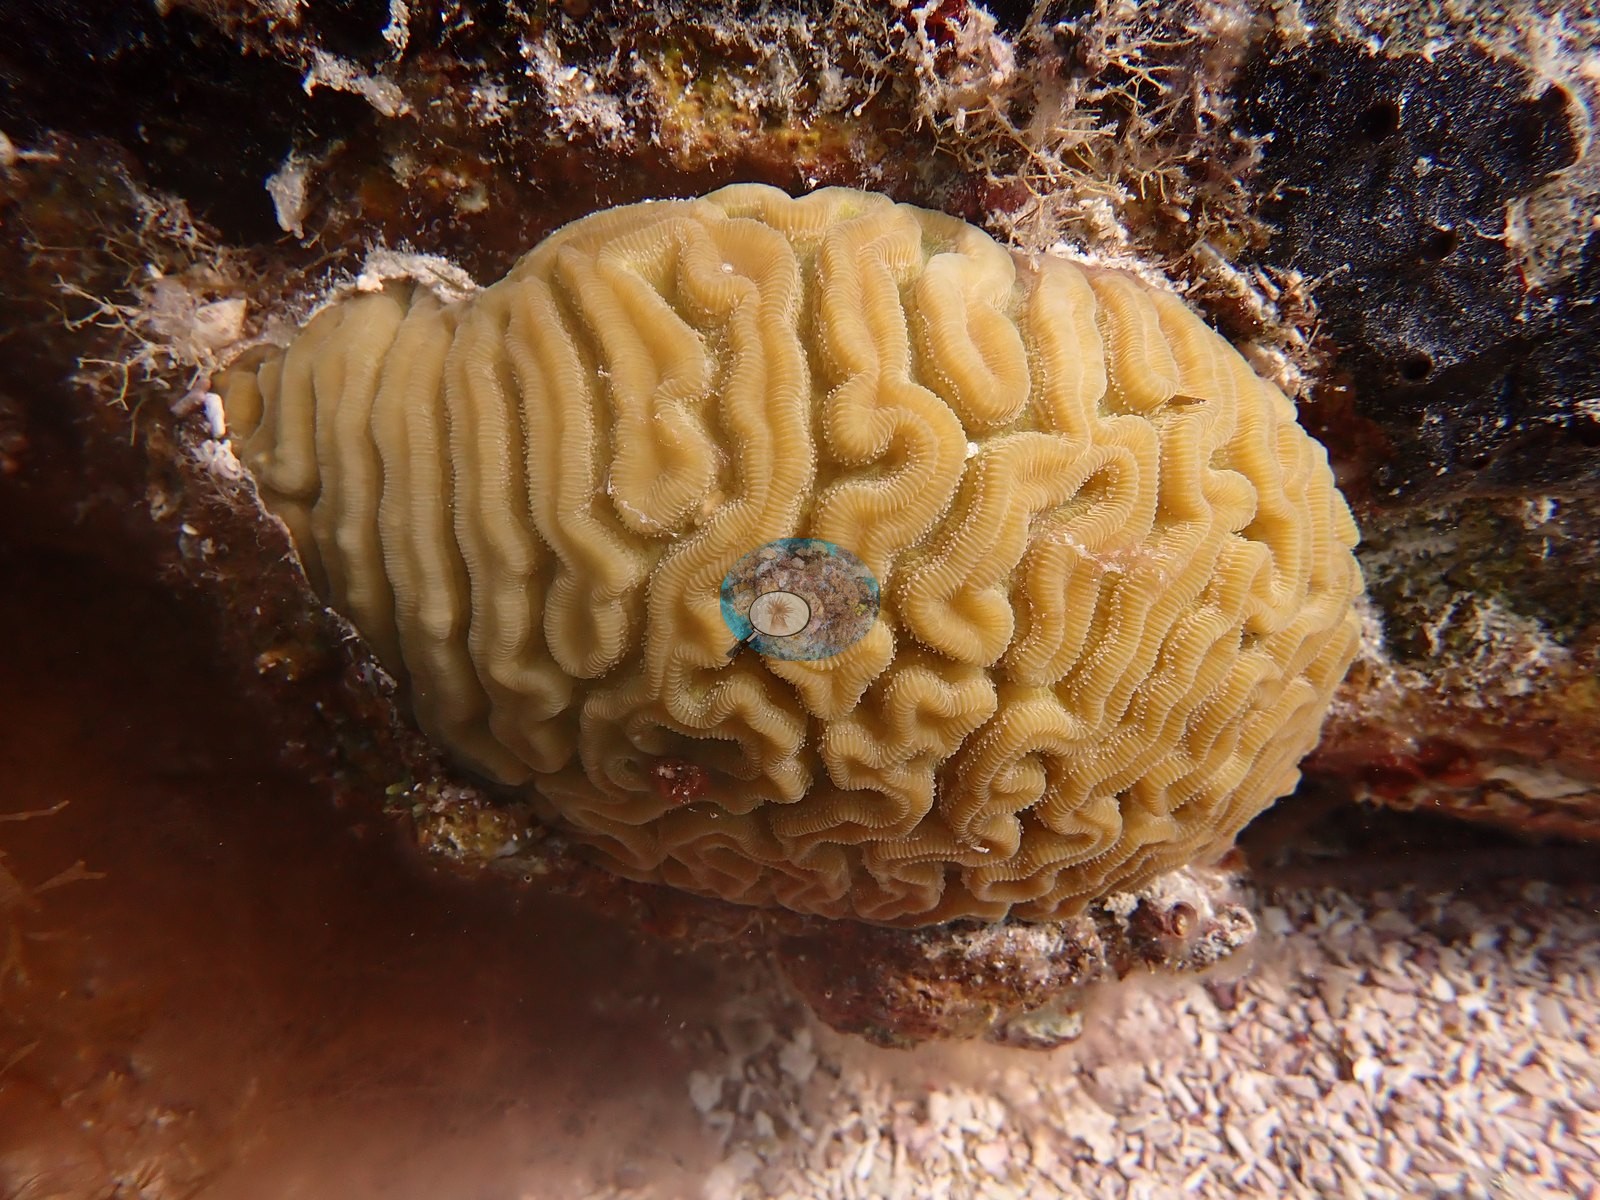
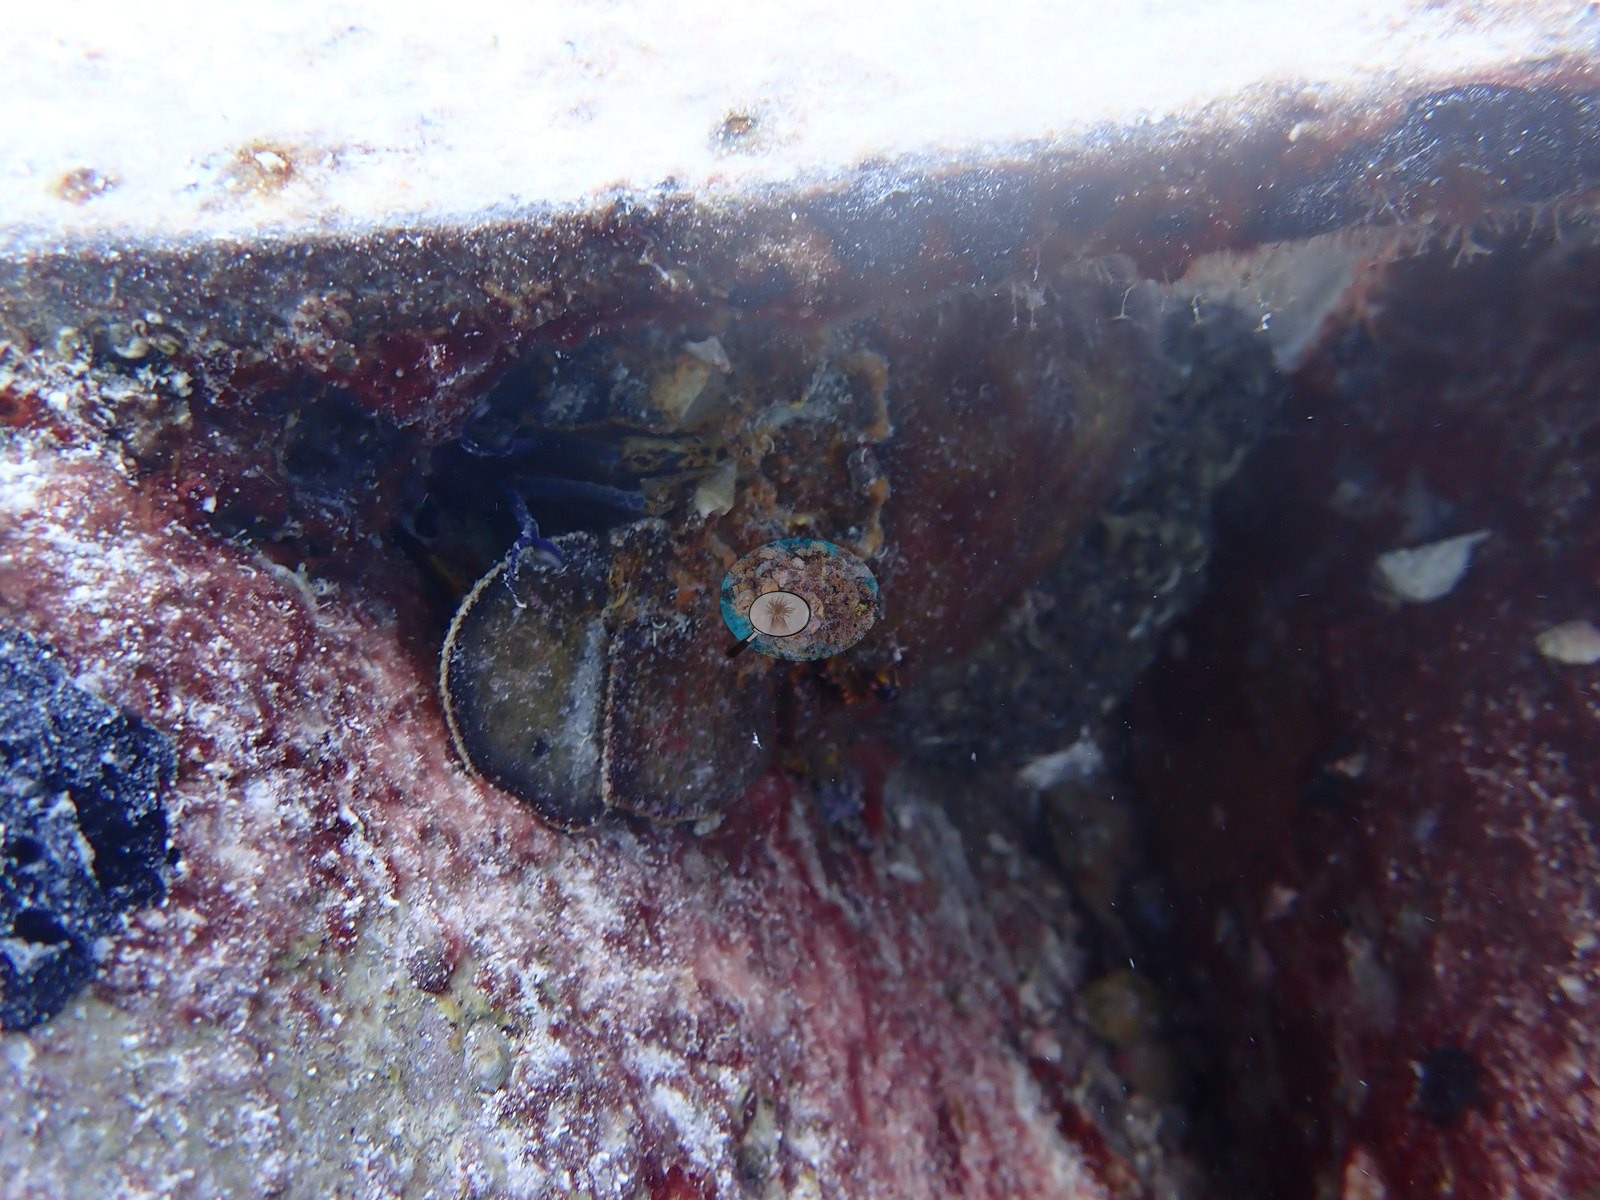
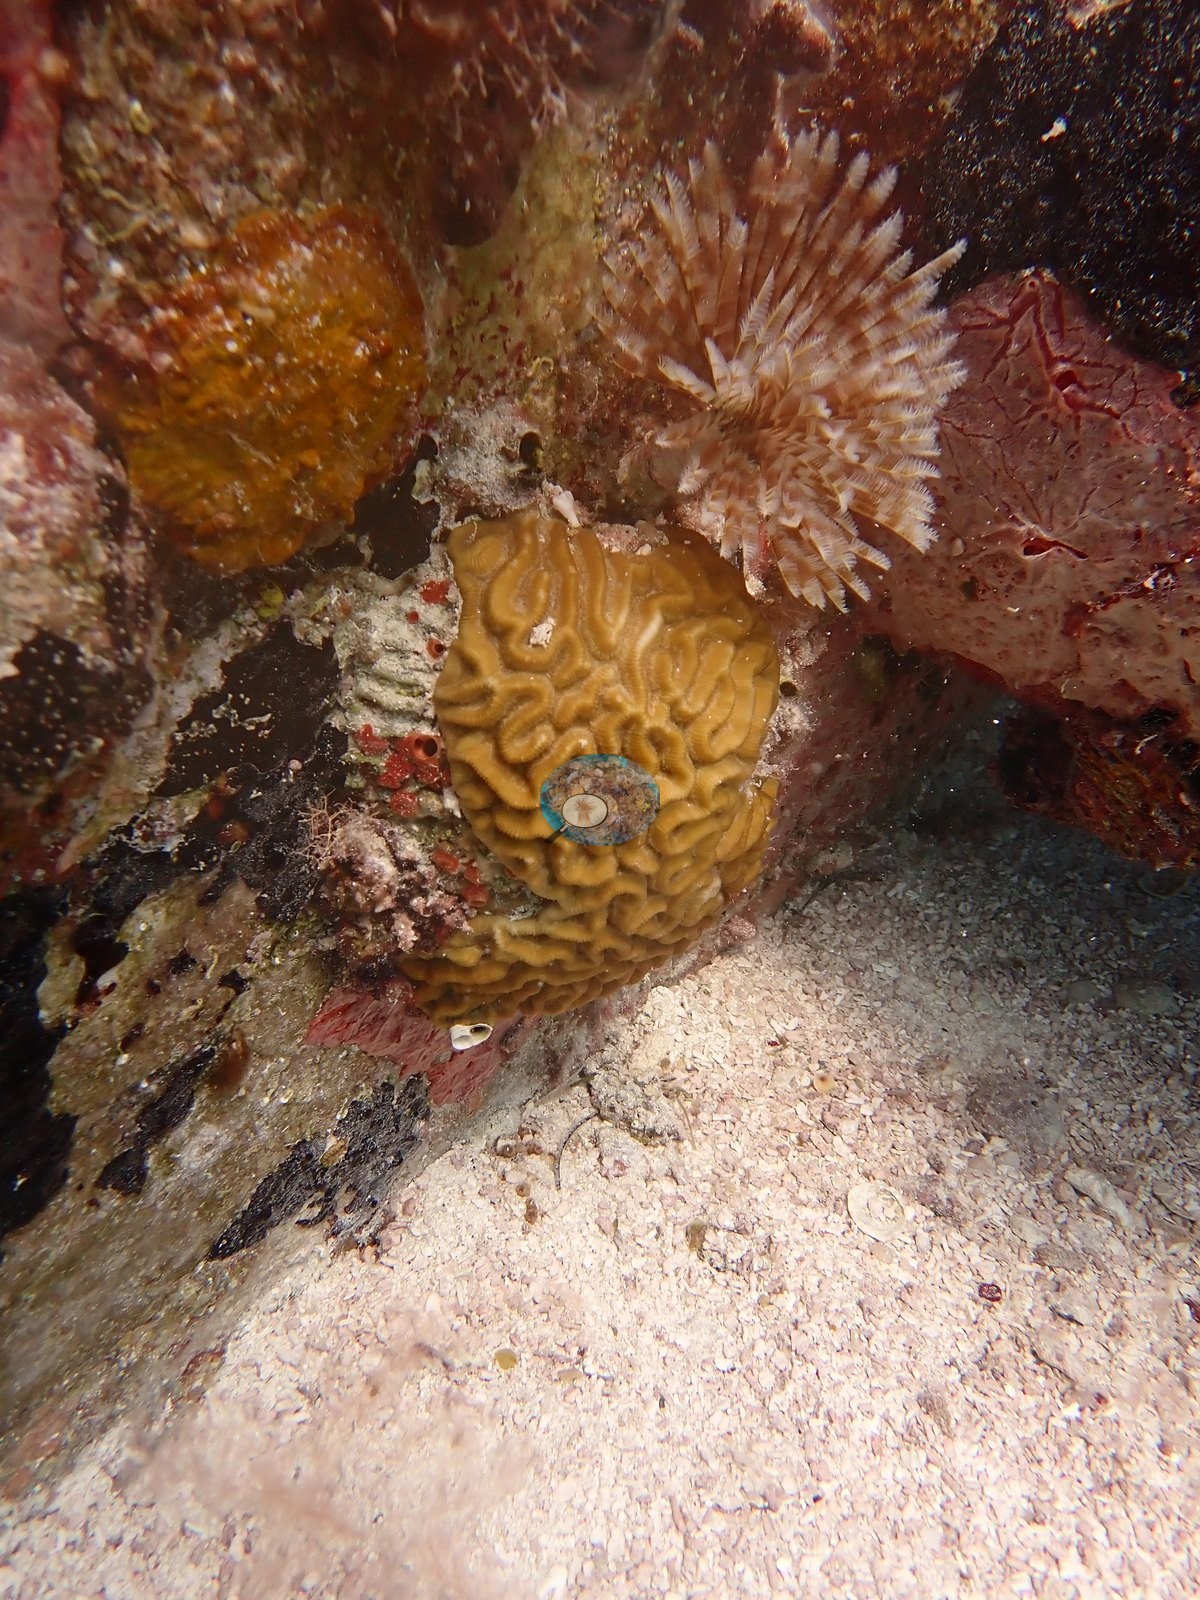
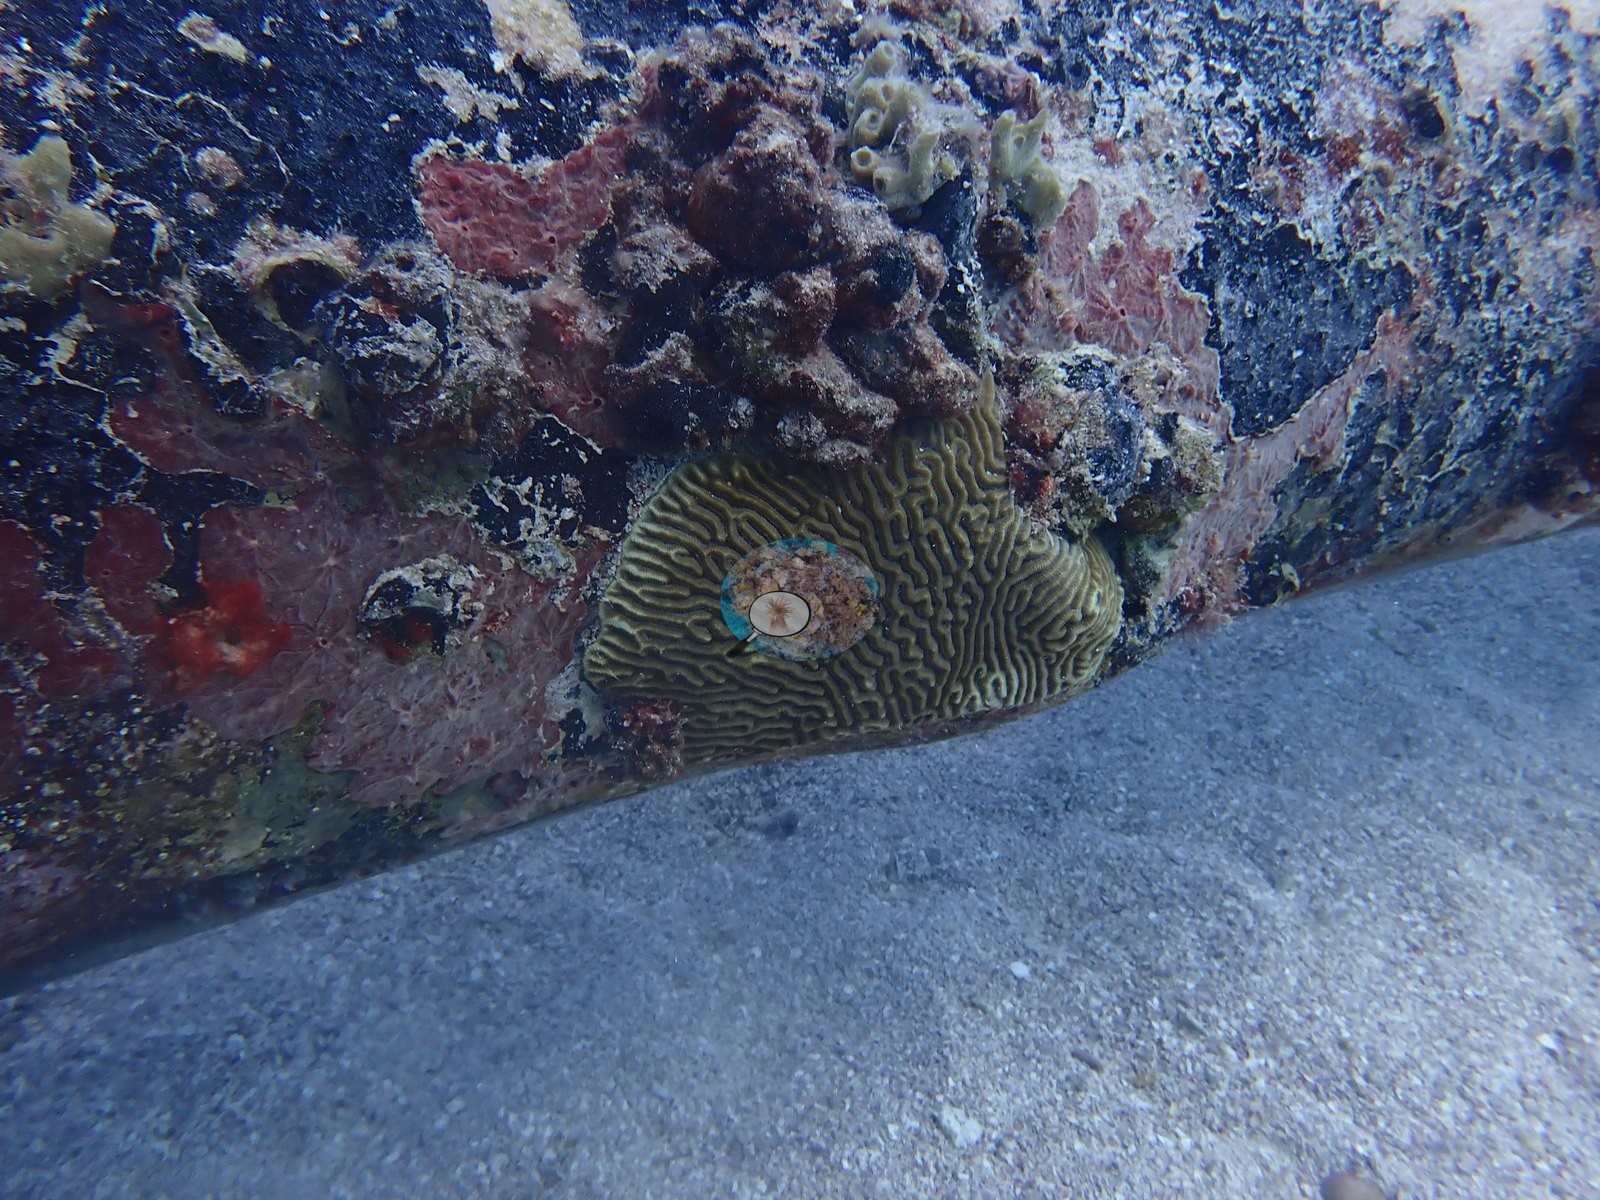
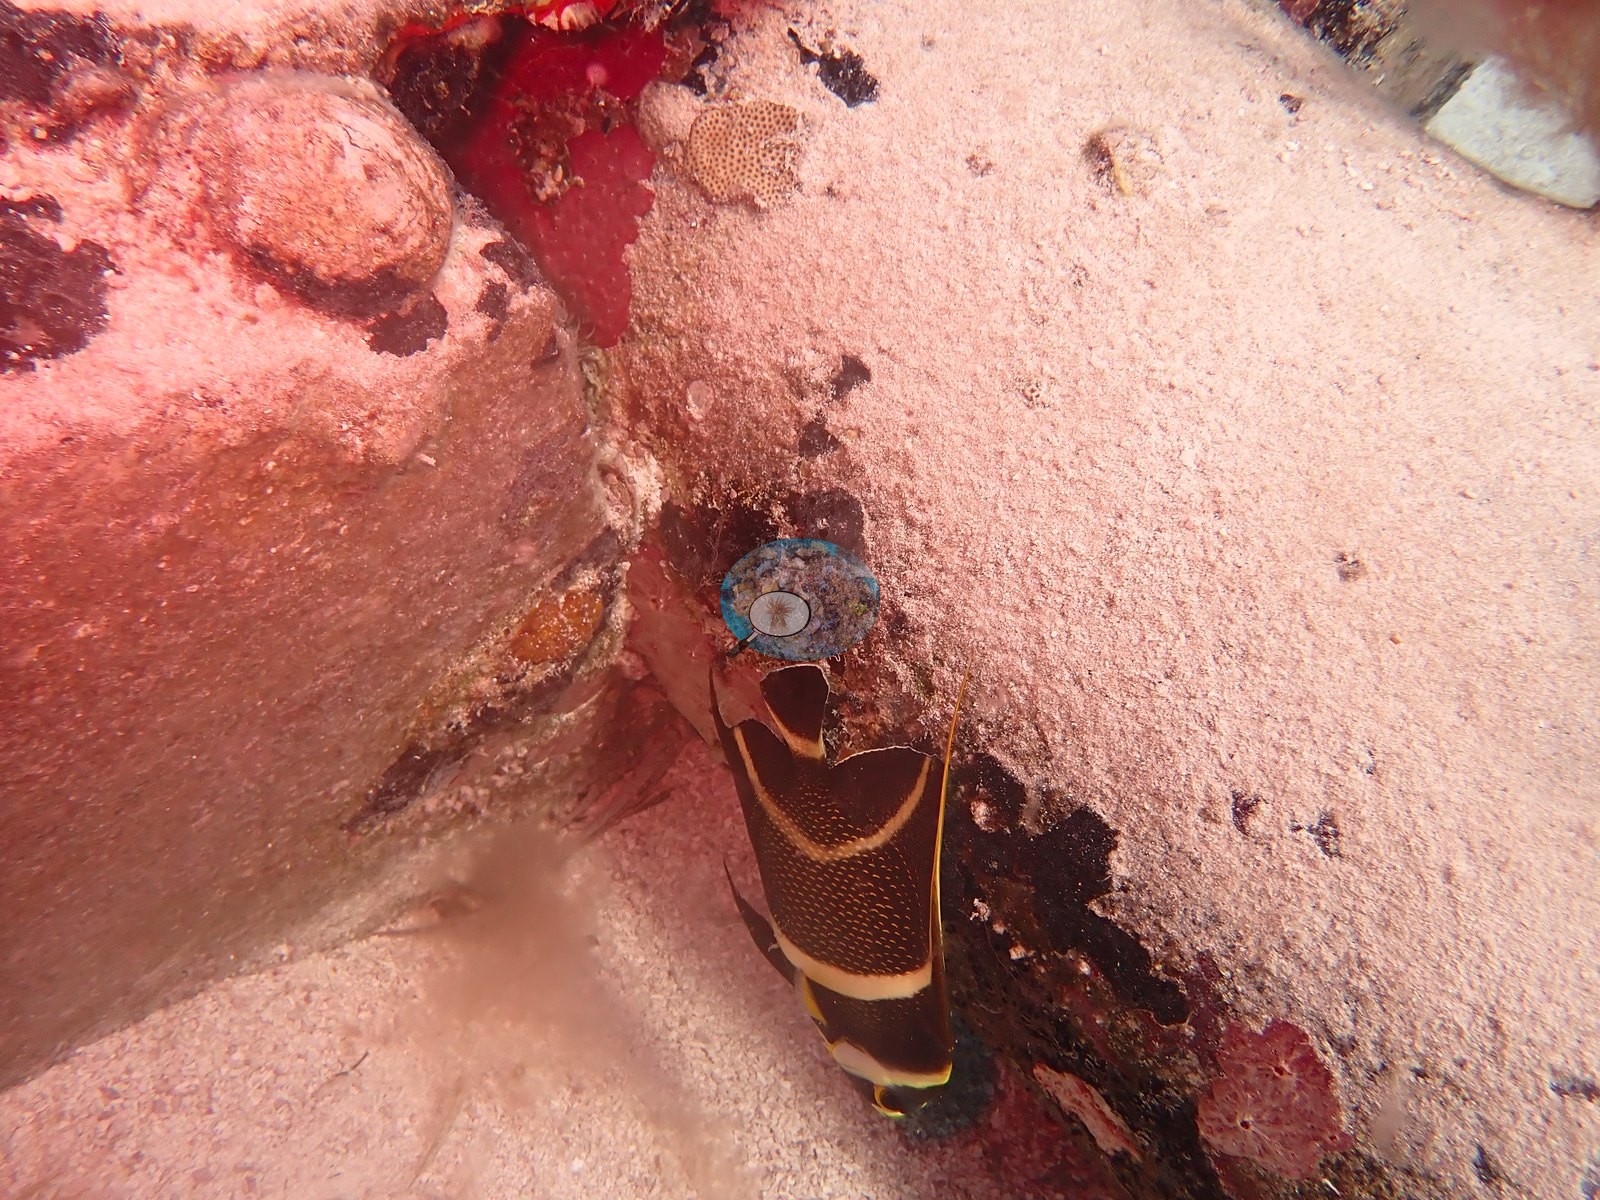
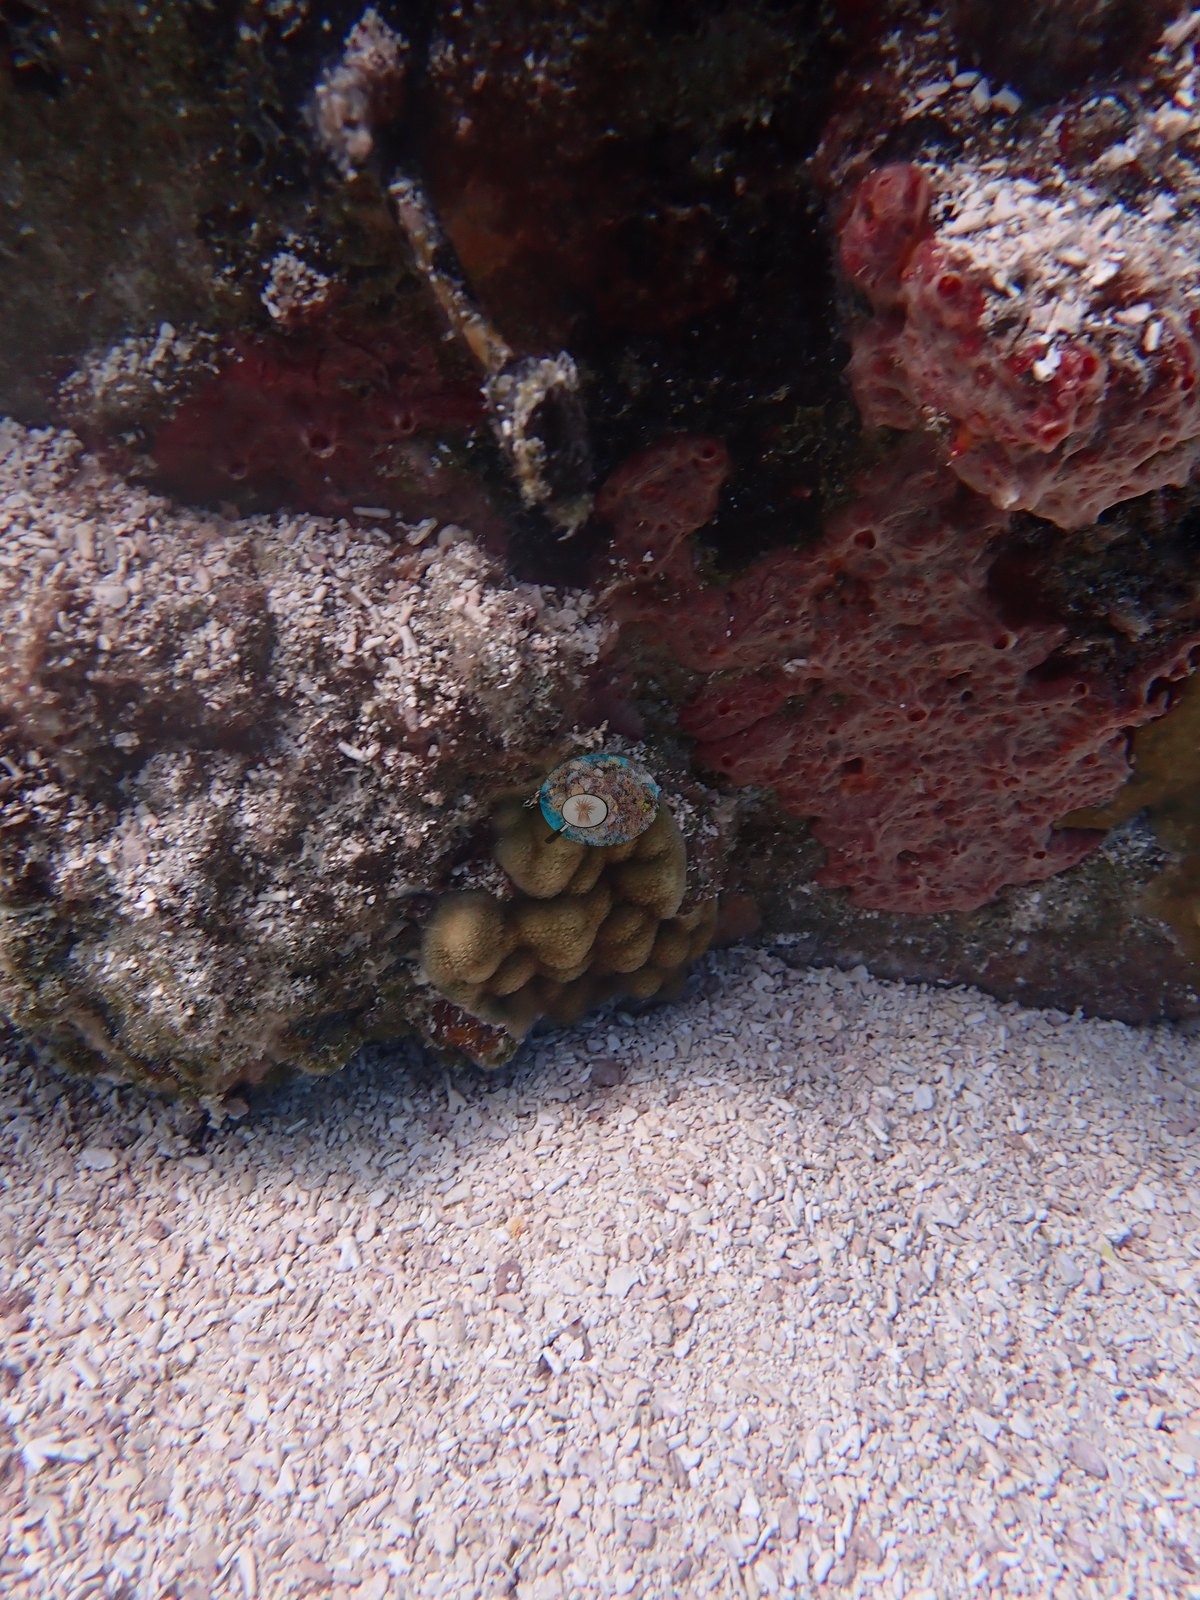
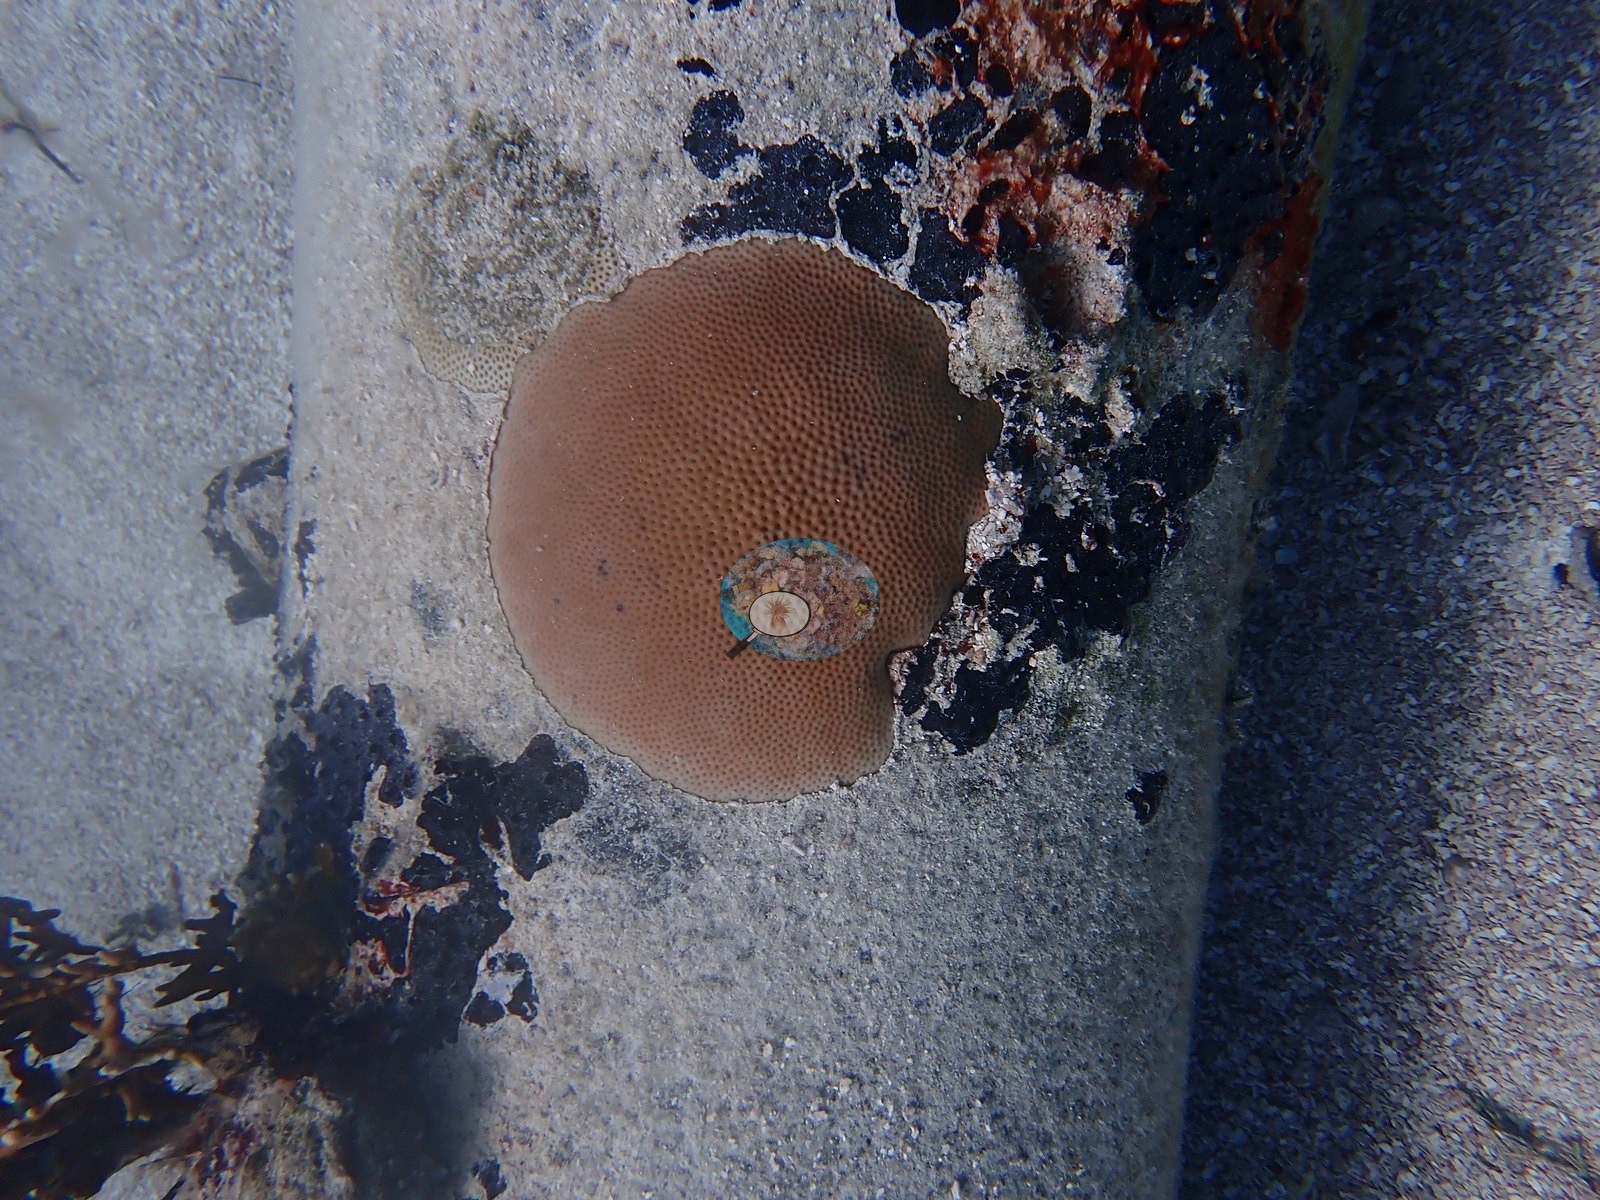
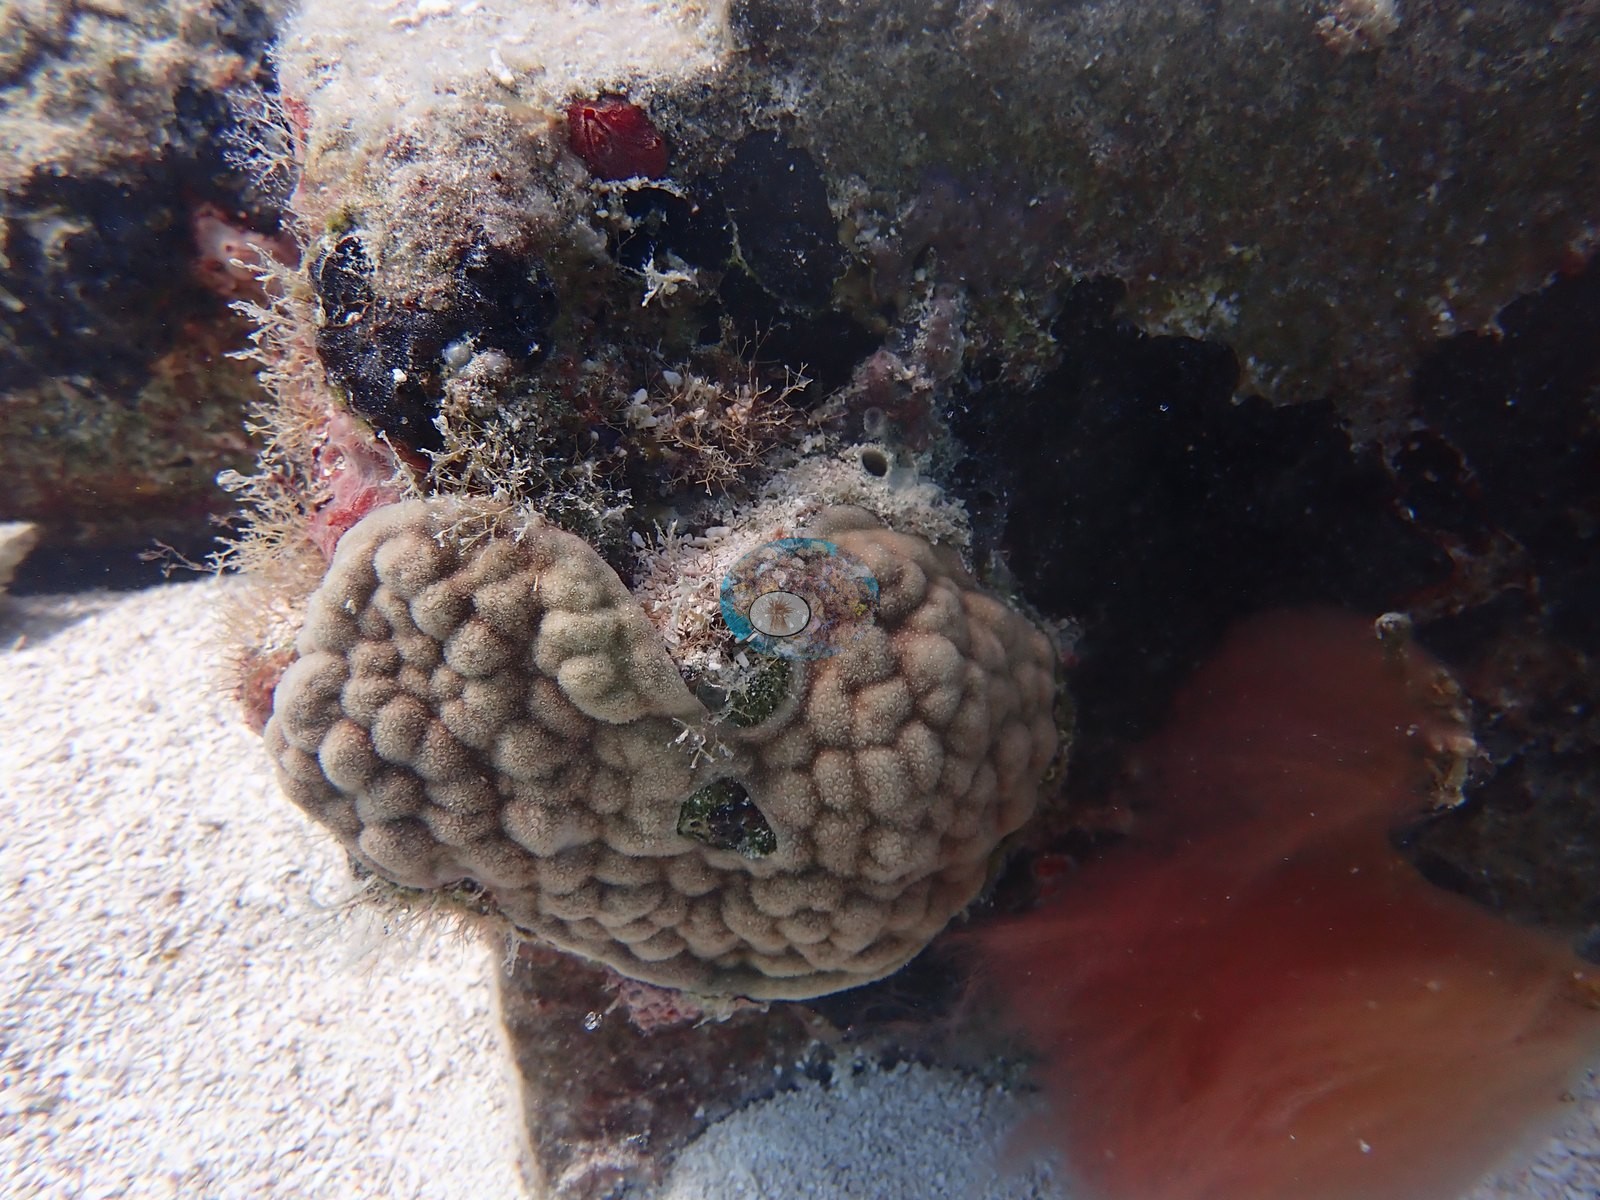
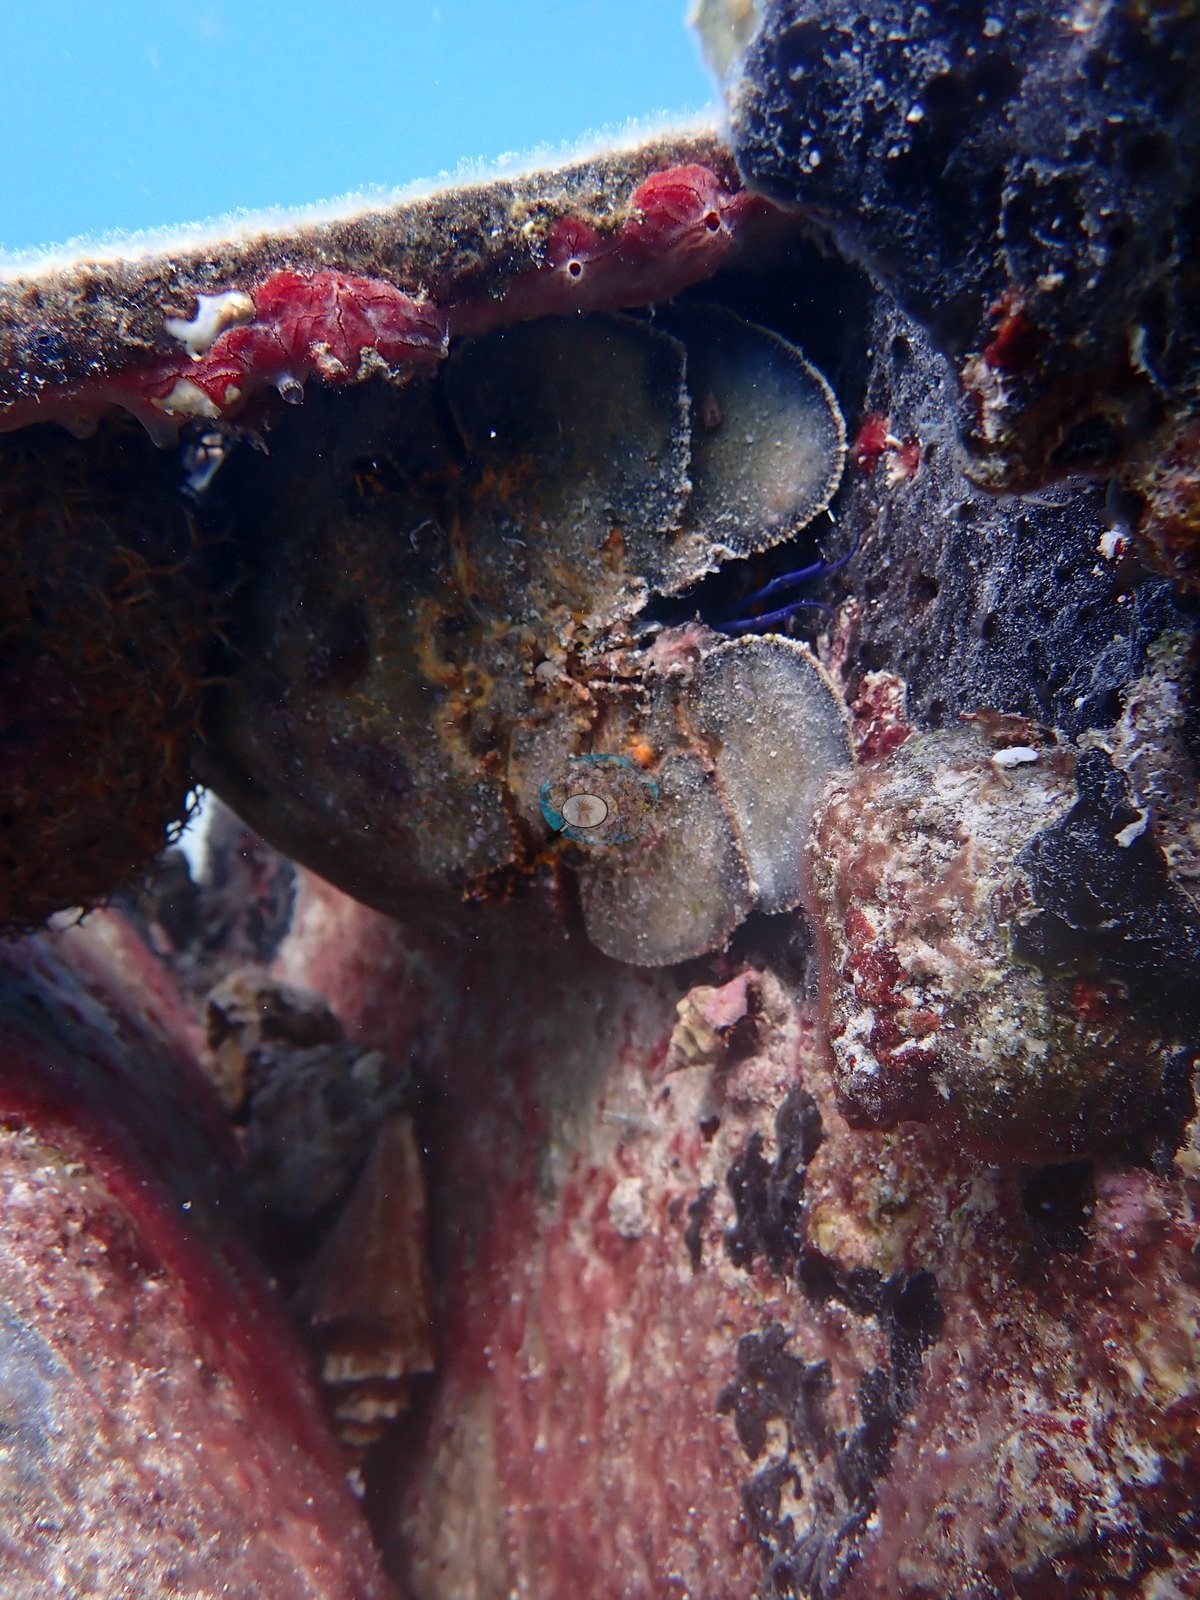
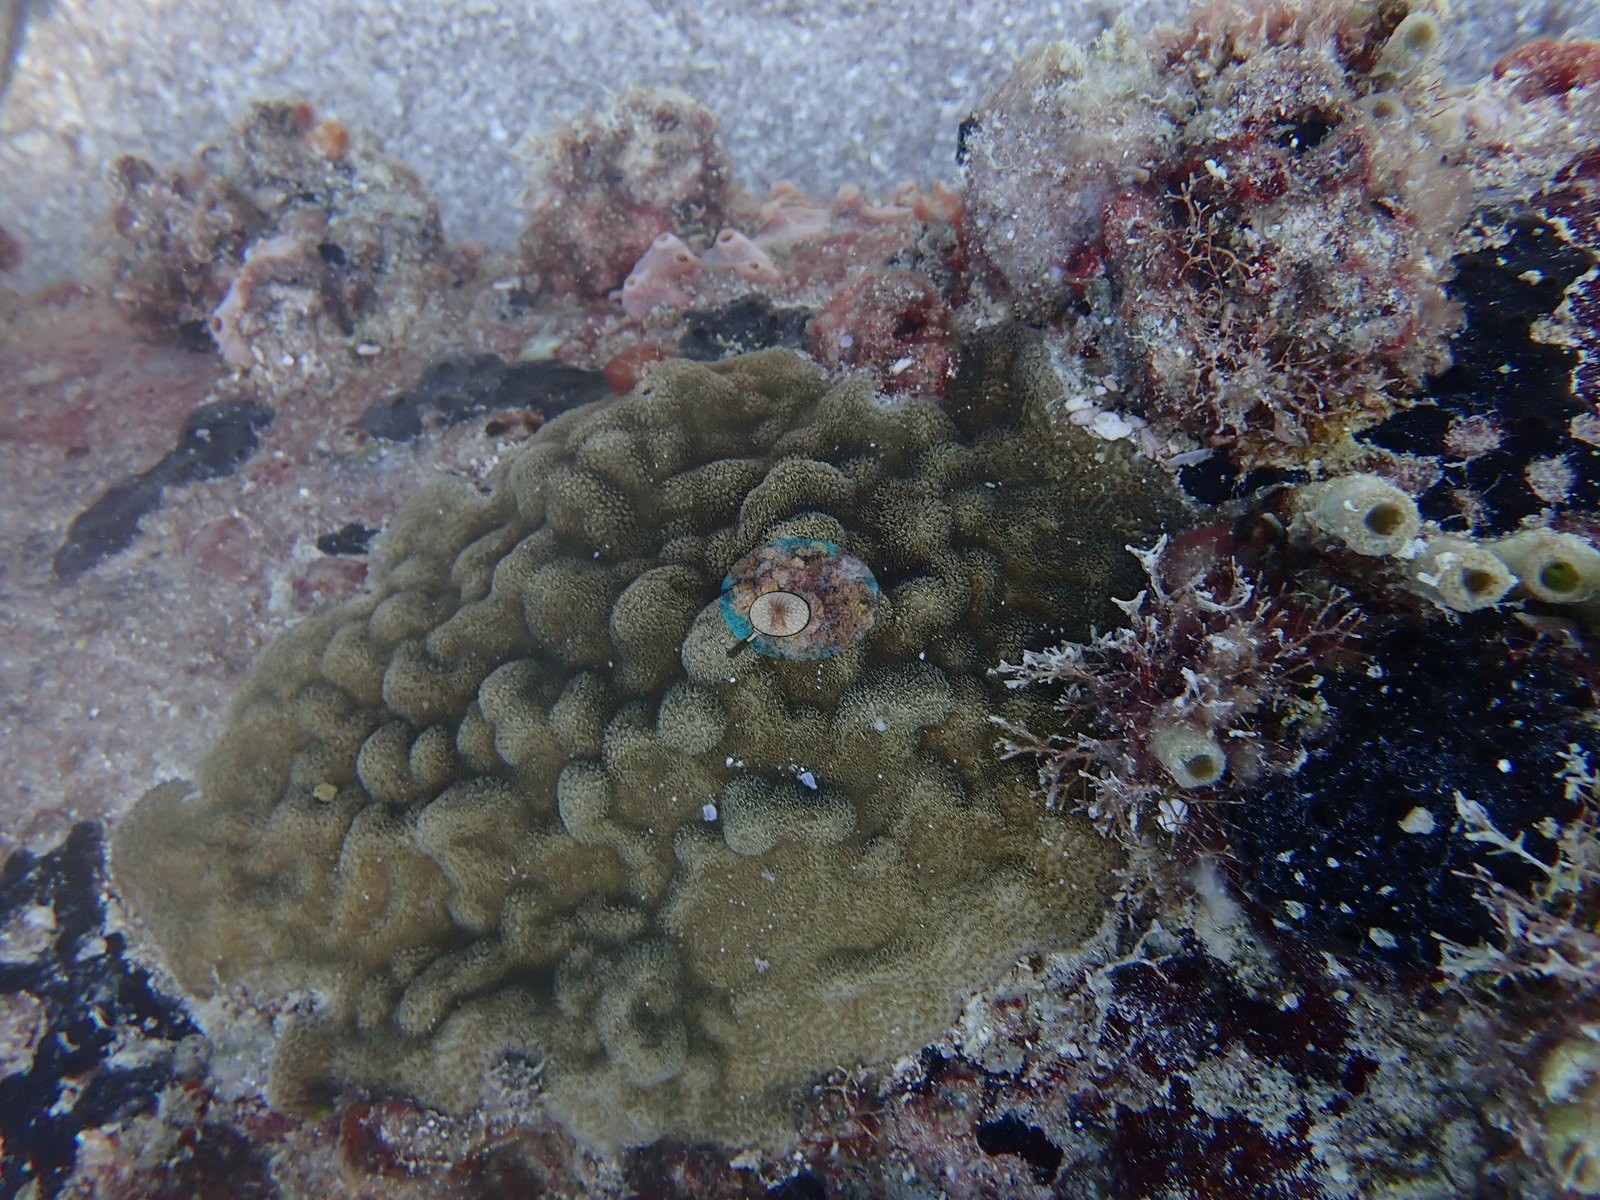
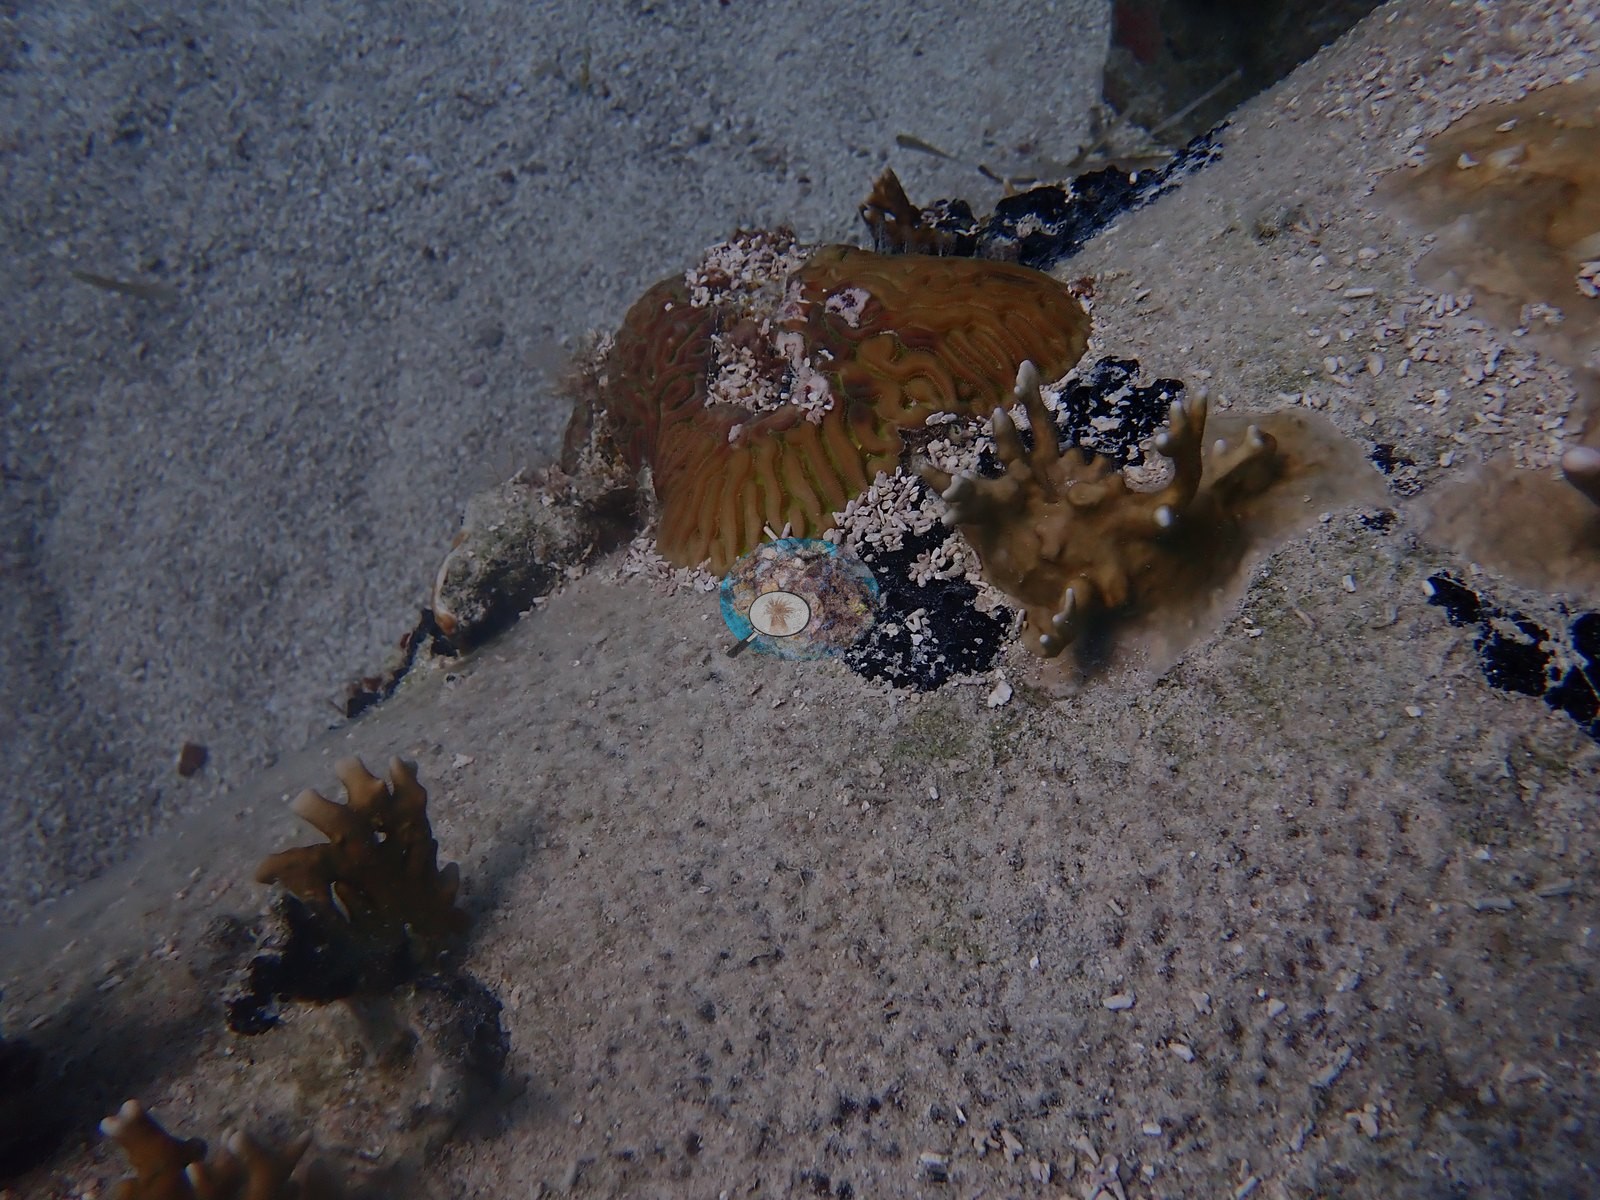
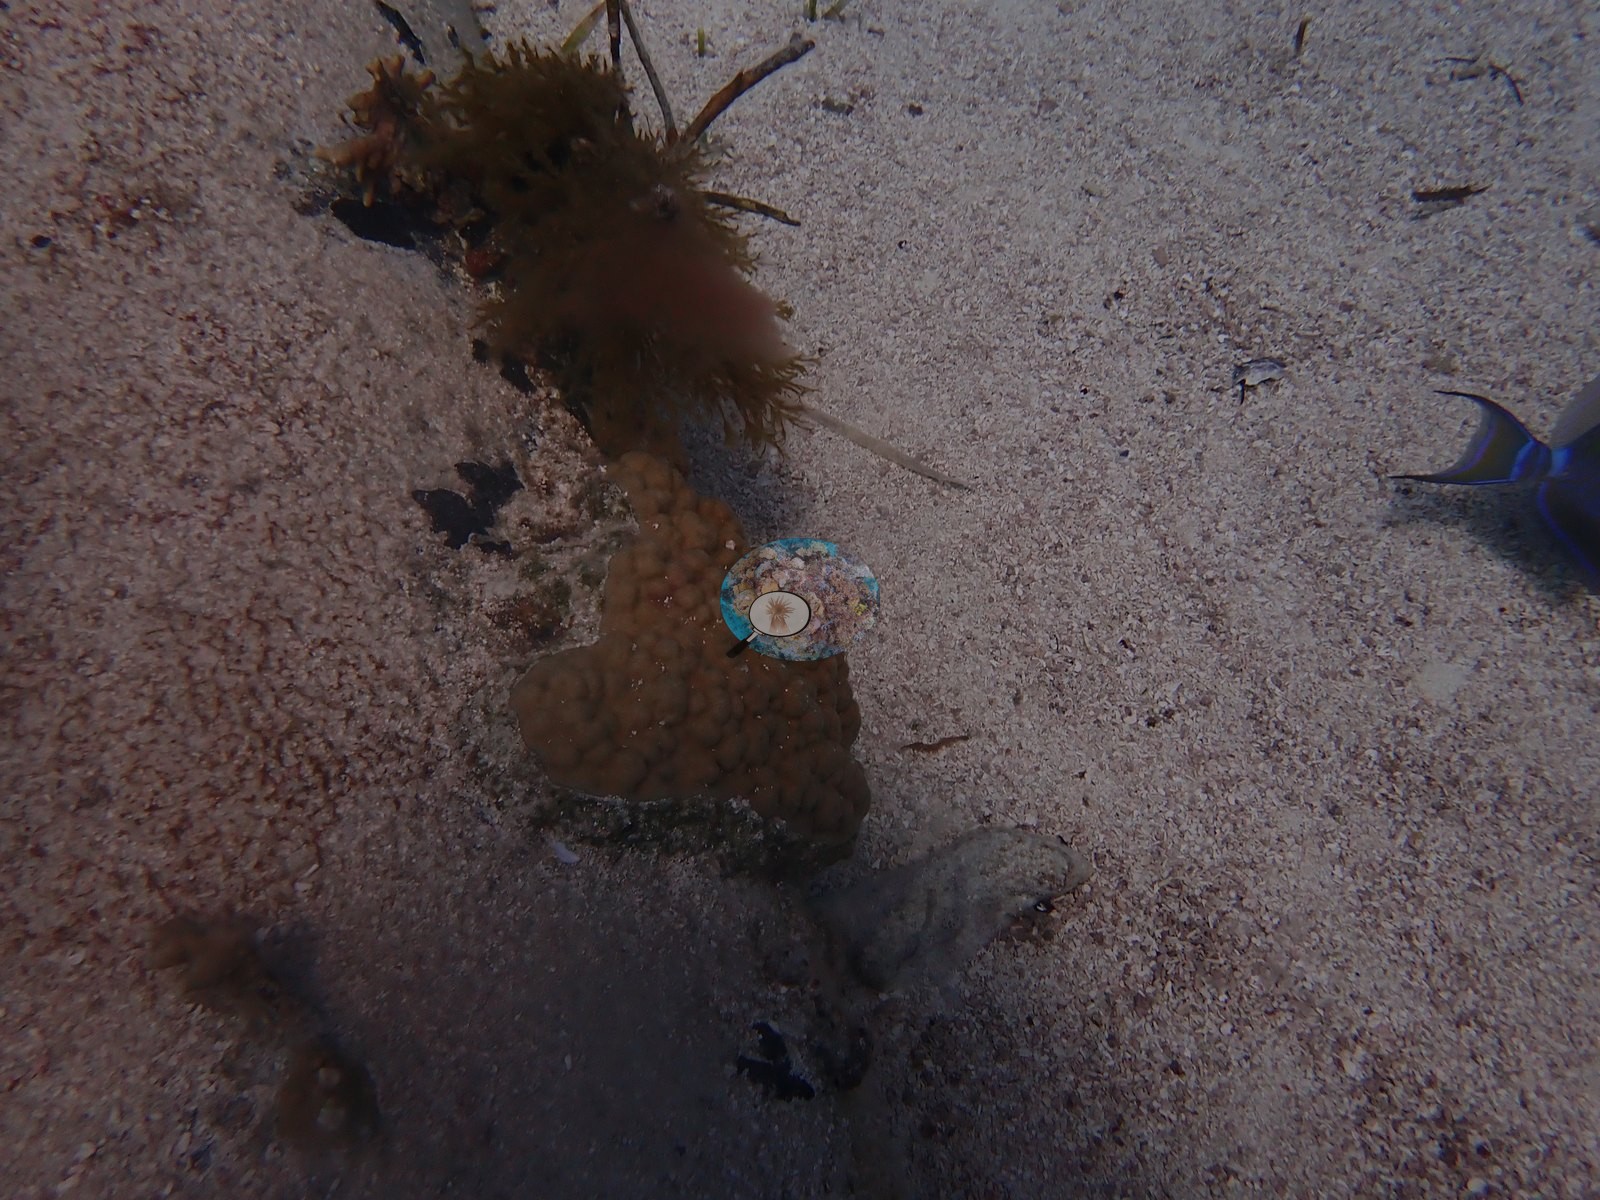
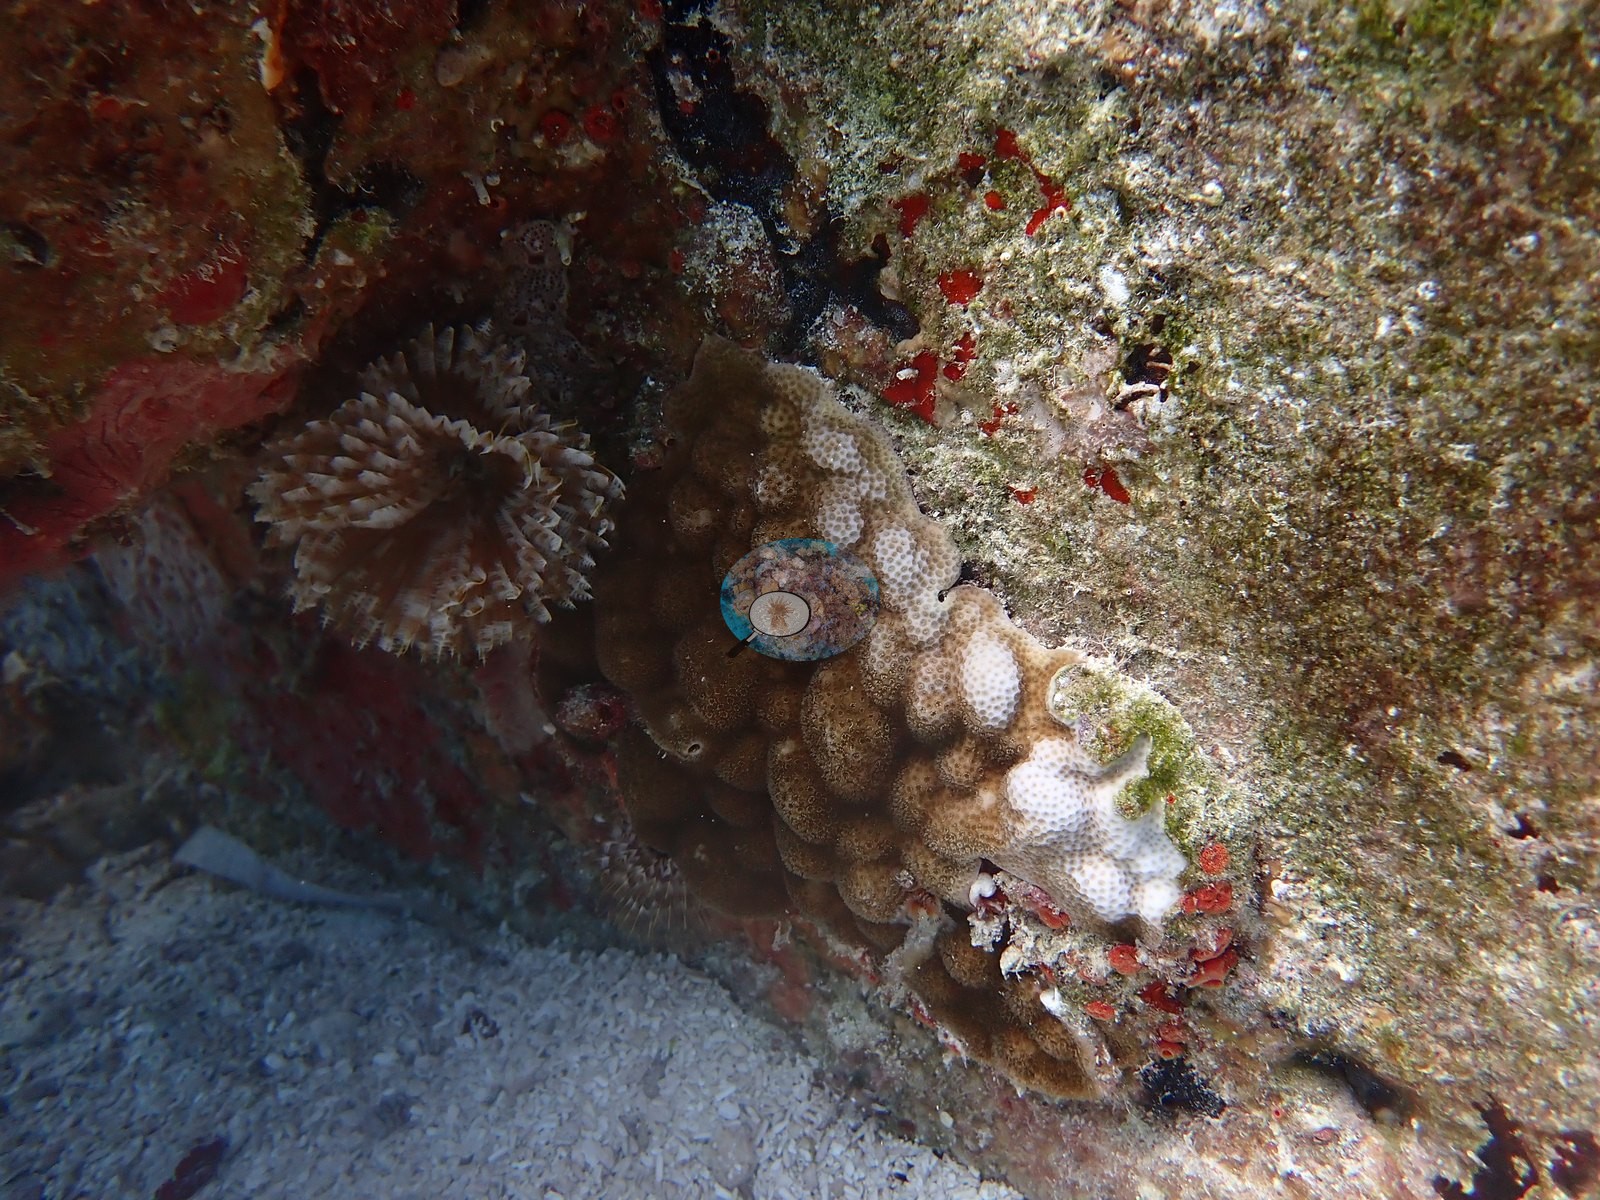
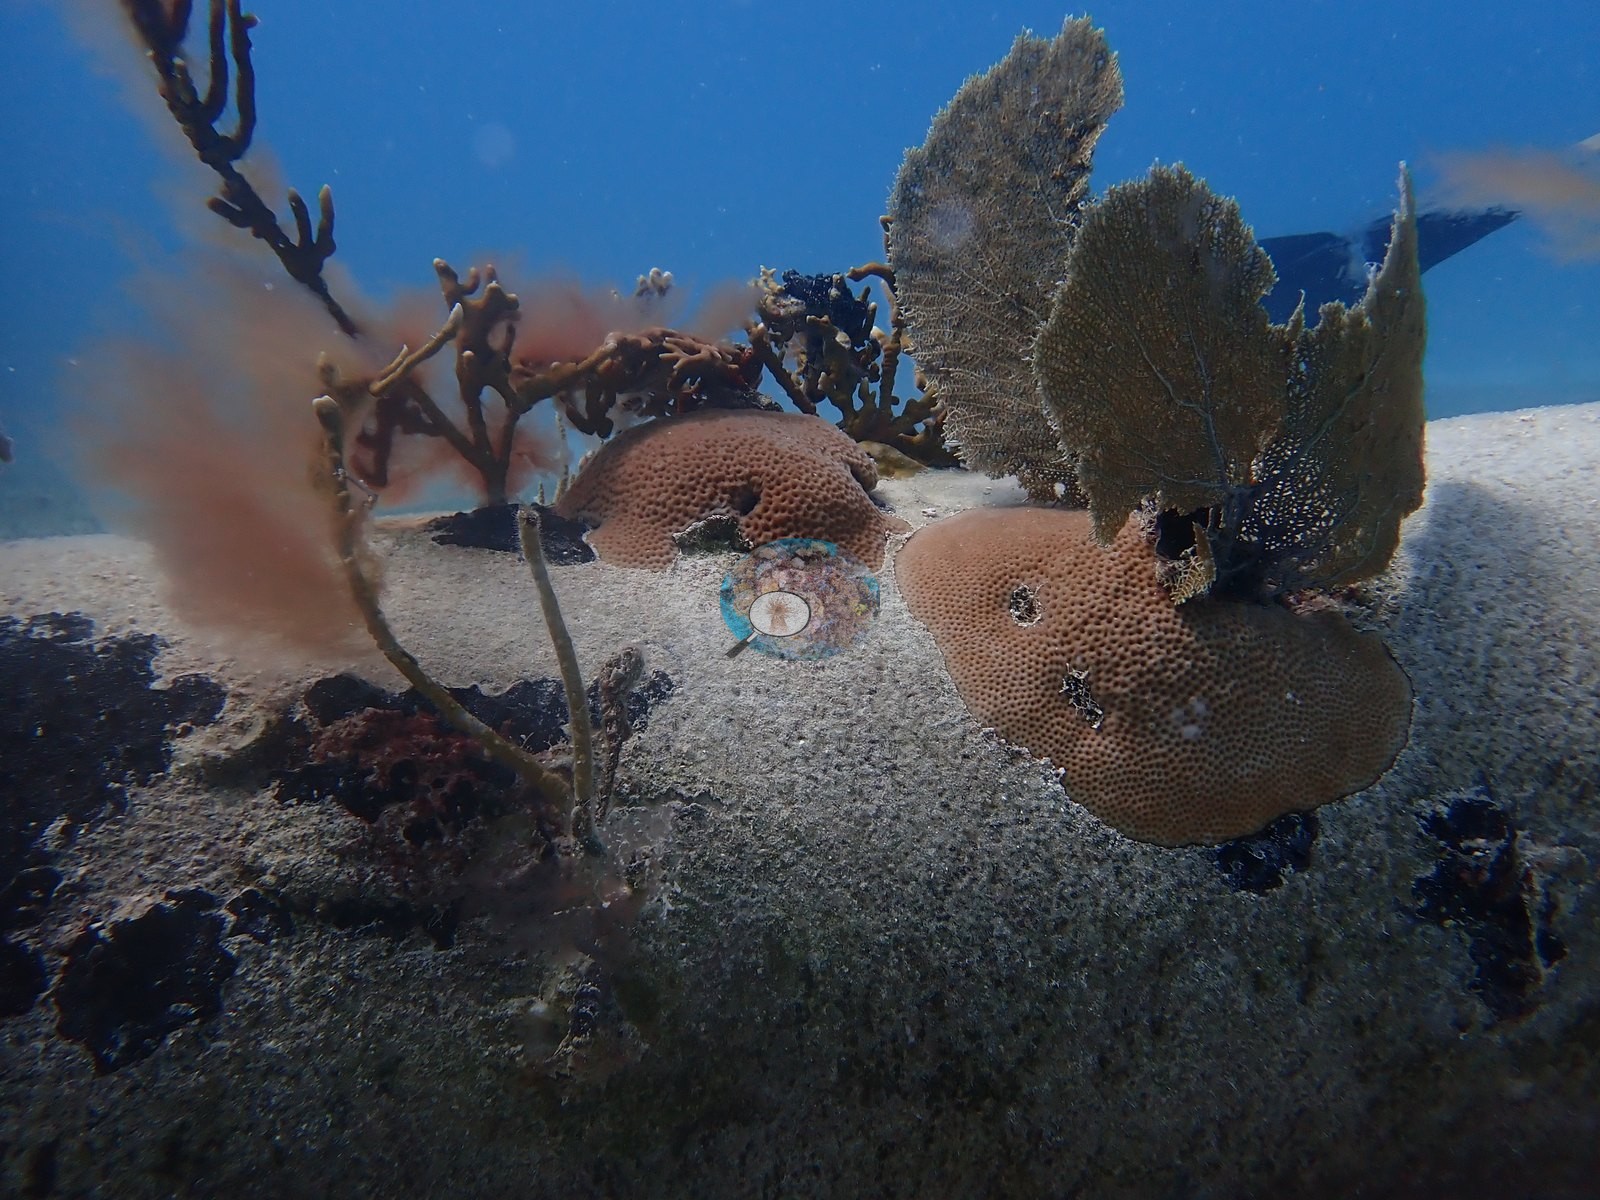
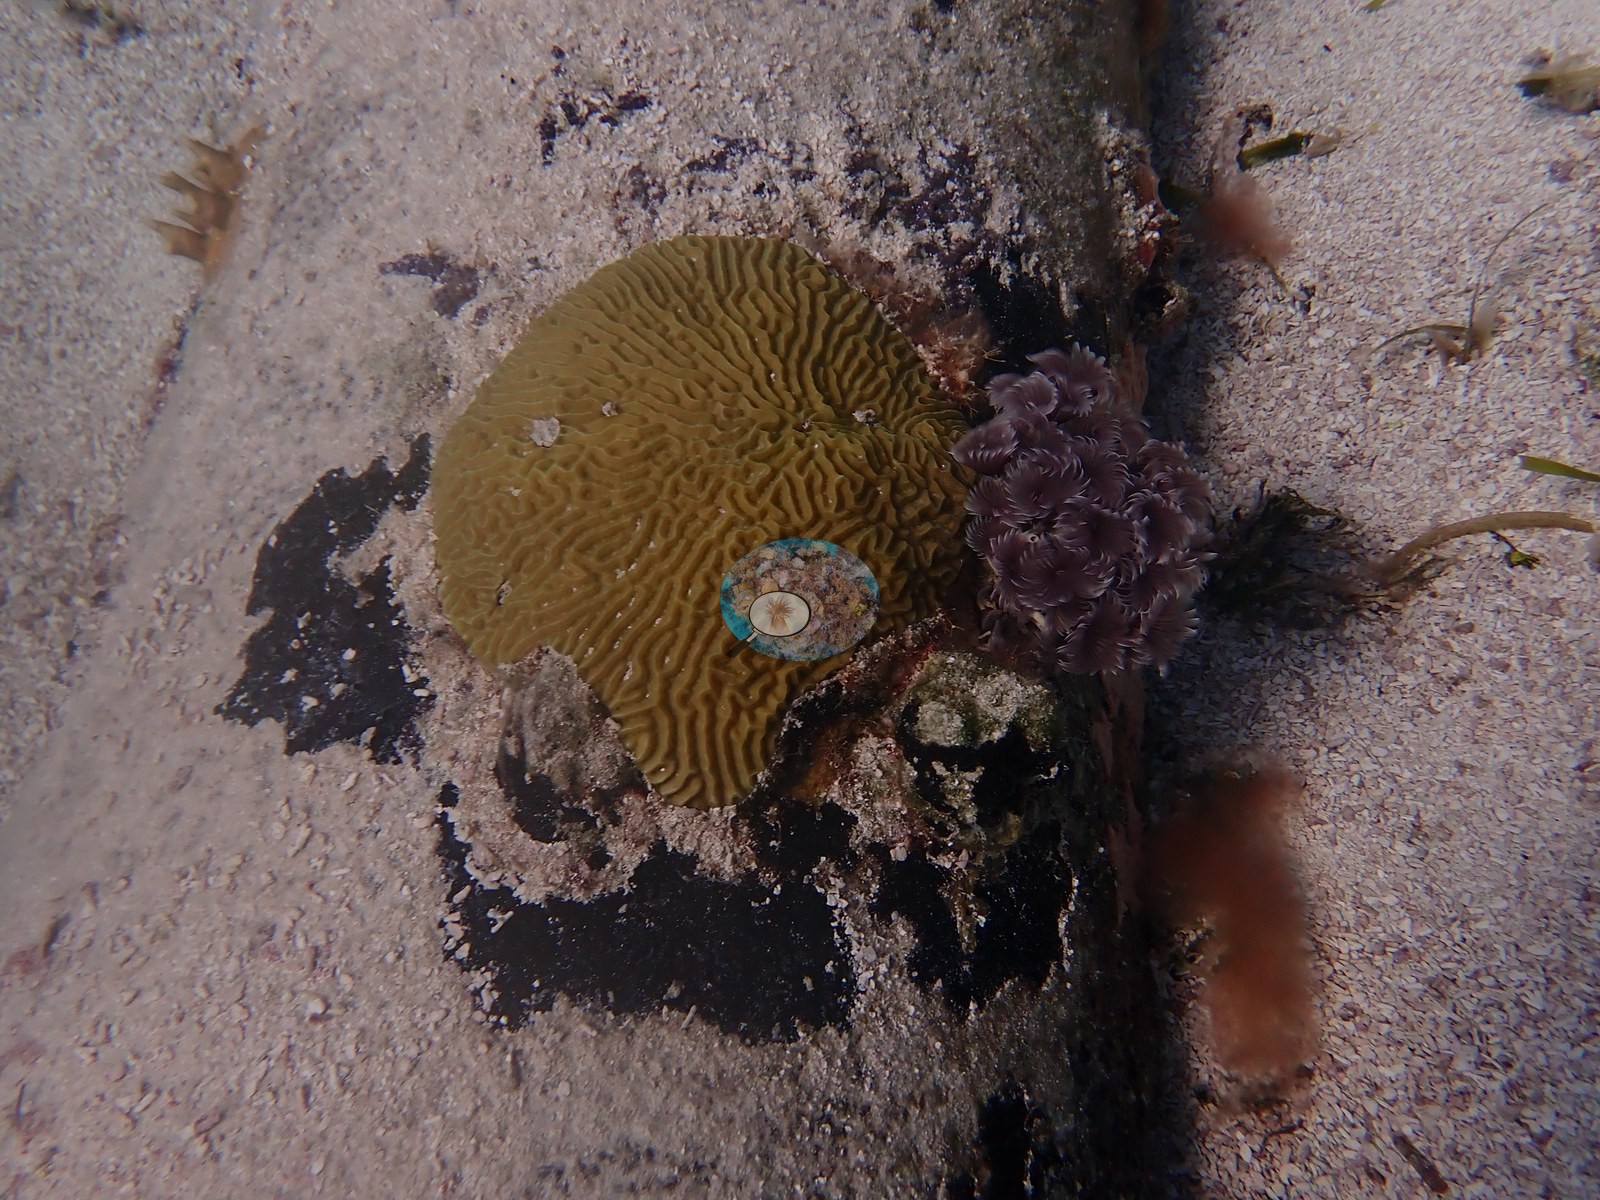
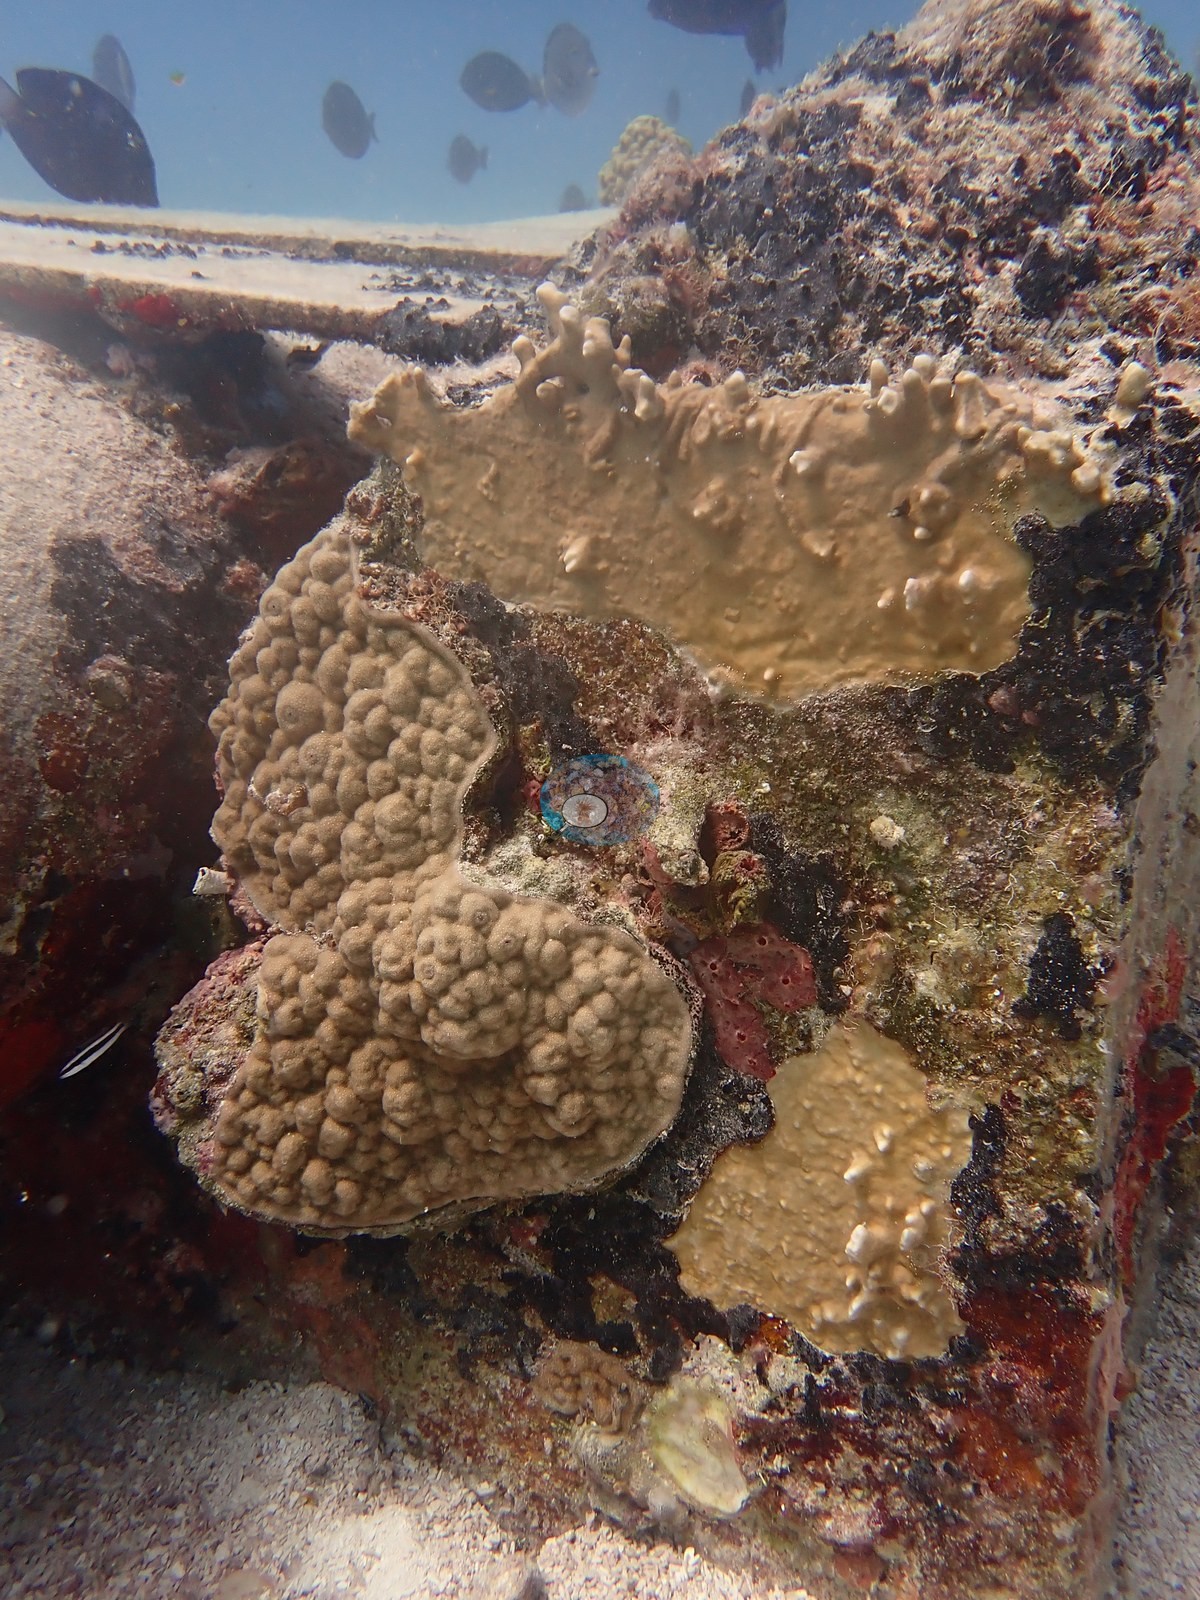
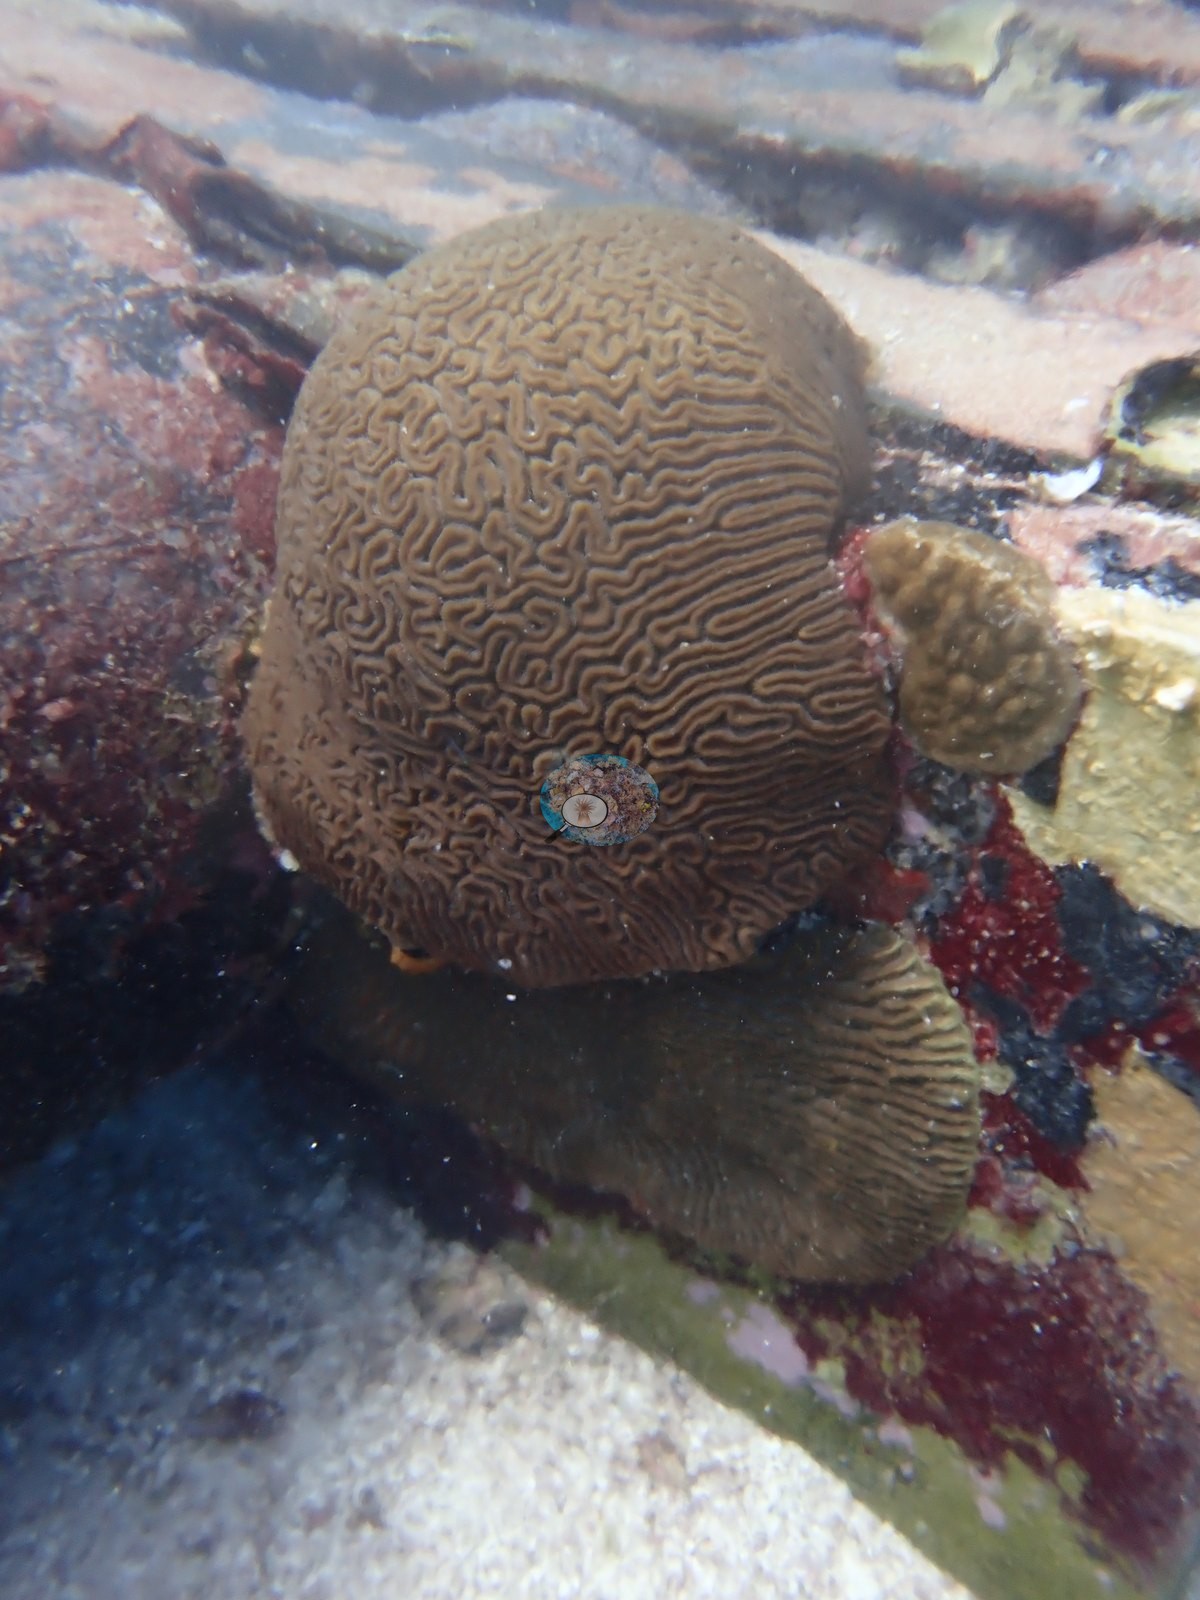
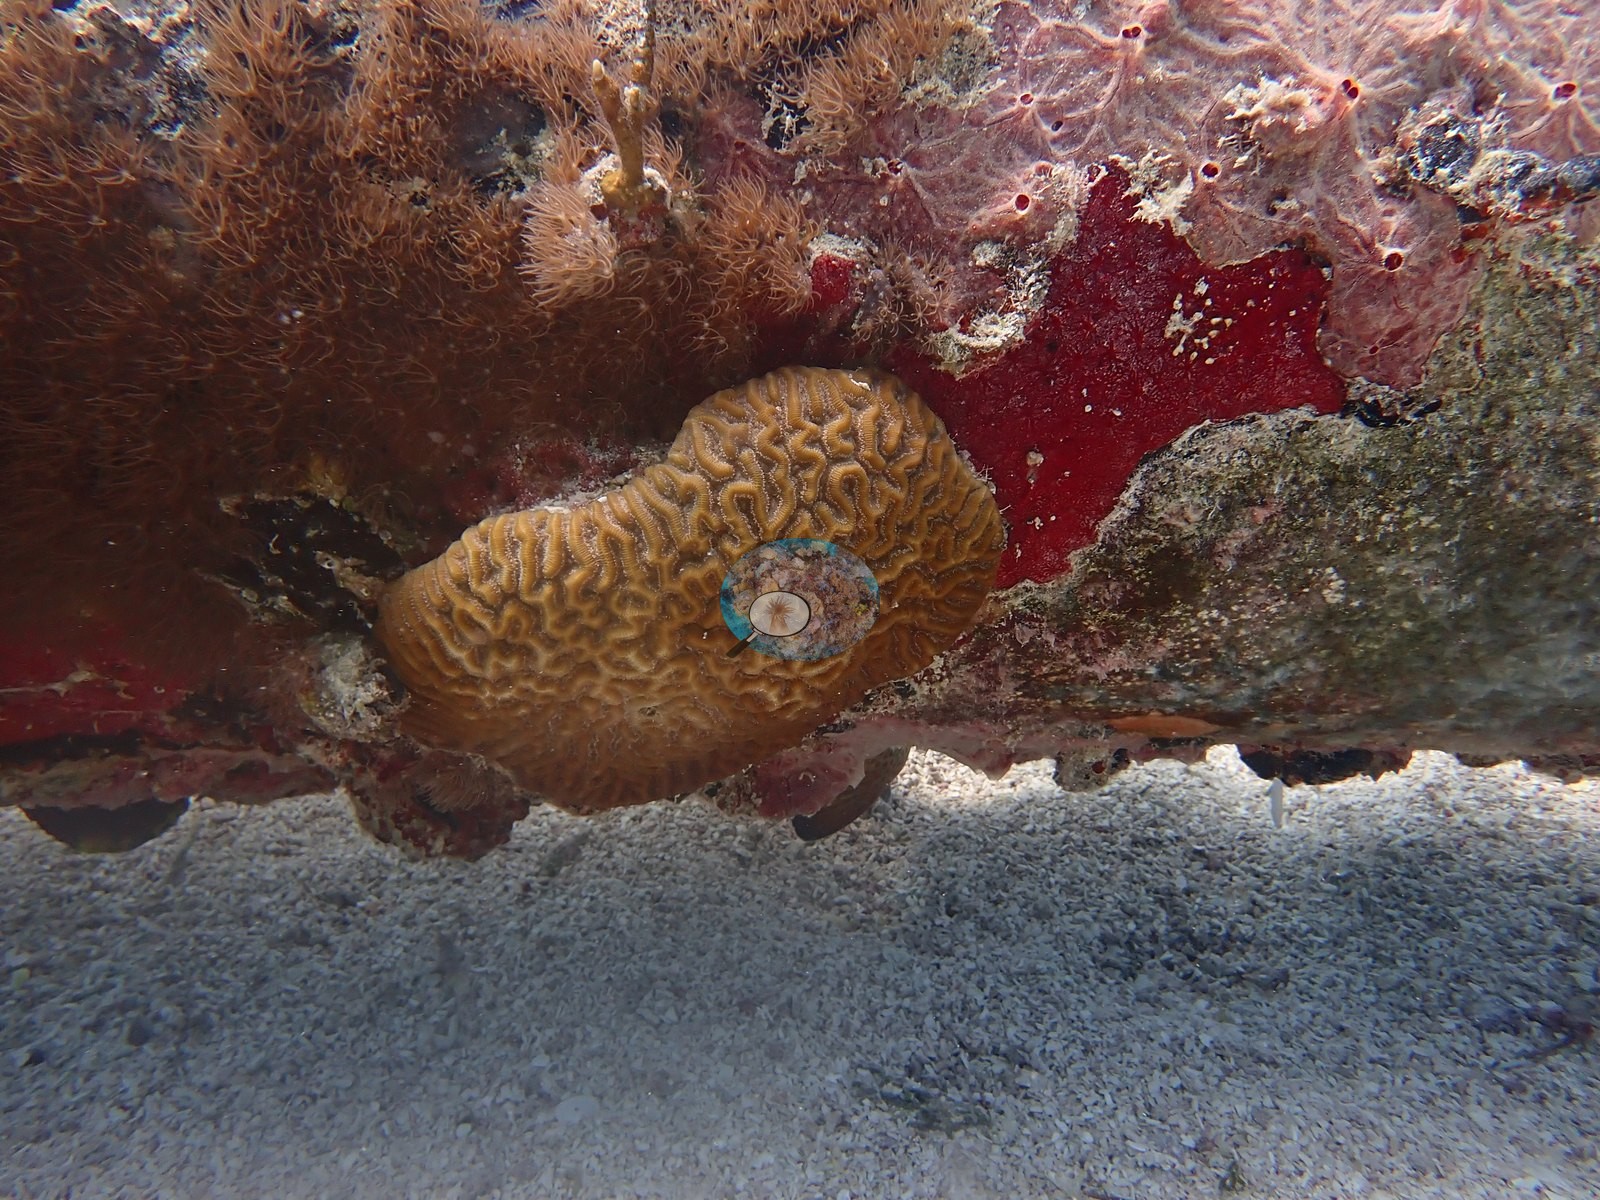
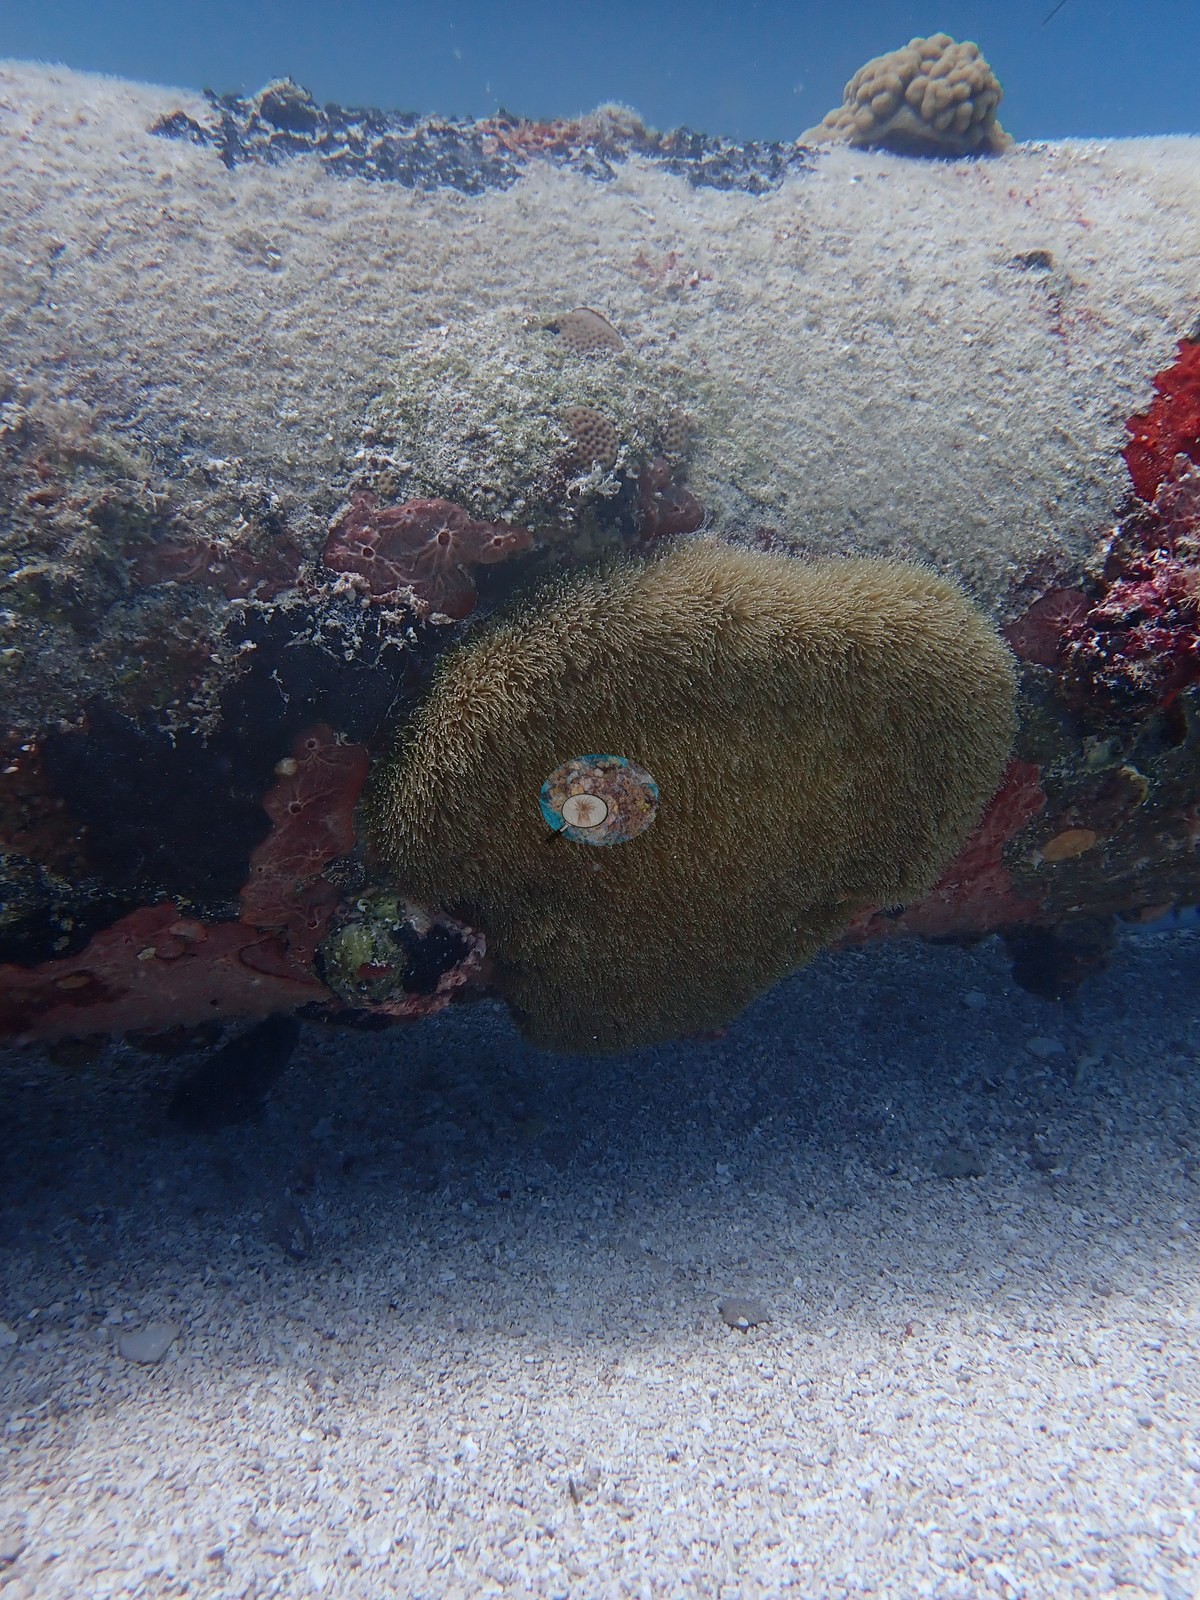
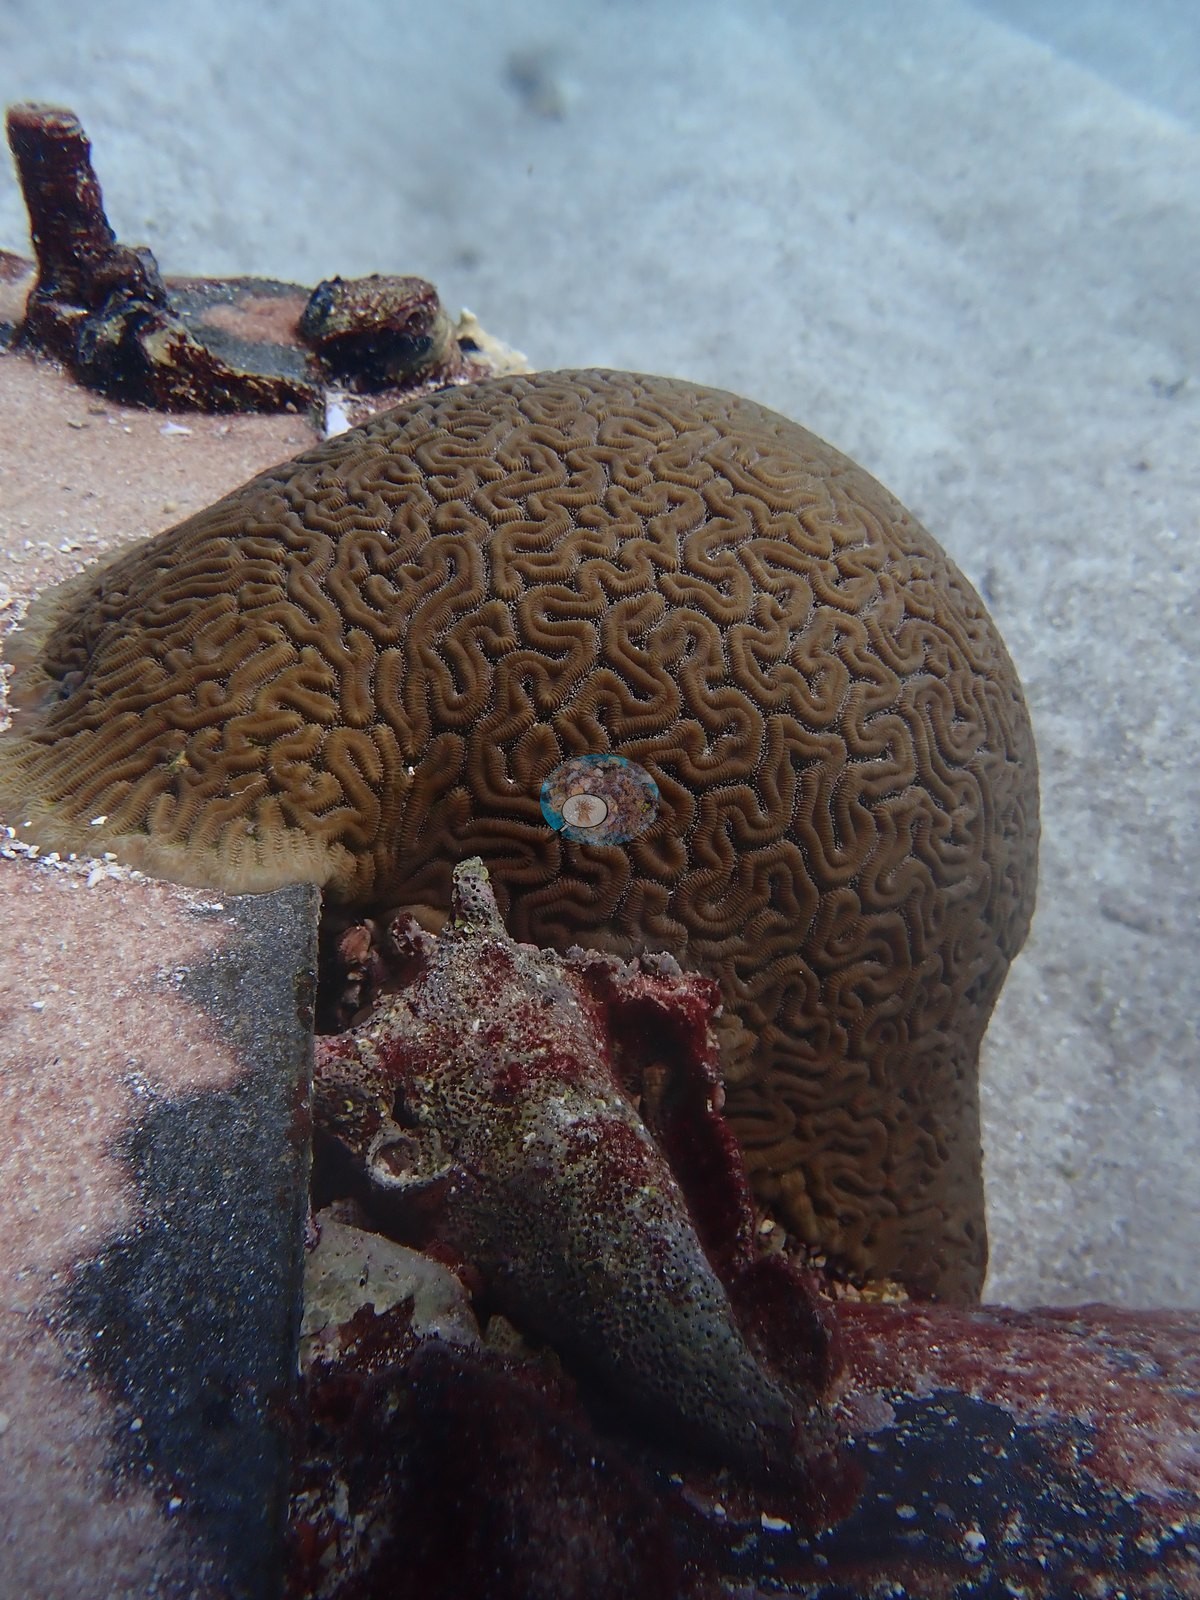
Boulder and brain corals, likely Montastraea, Orbicella, and Pseudodiploria, cluster along its length and at its junction boxes, joined by red encrusting sponges and a cluster of white tube sponges (e.g., Image 4, Image 5, Image 9, Image 16, Image 26, Image 3, Image 31, Image 46, Image 50).
Coral cover
Coral cover: 6.6% — a blind Claude computer-vision point count of 65 of Anderson's unedited photographs (20 points per photo; water, fish, and obstructions excluded). Other computer-vision methods are listed in the method table.
Stressors
No corallivores evident.
Fish and other fauna
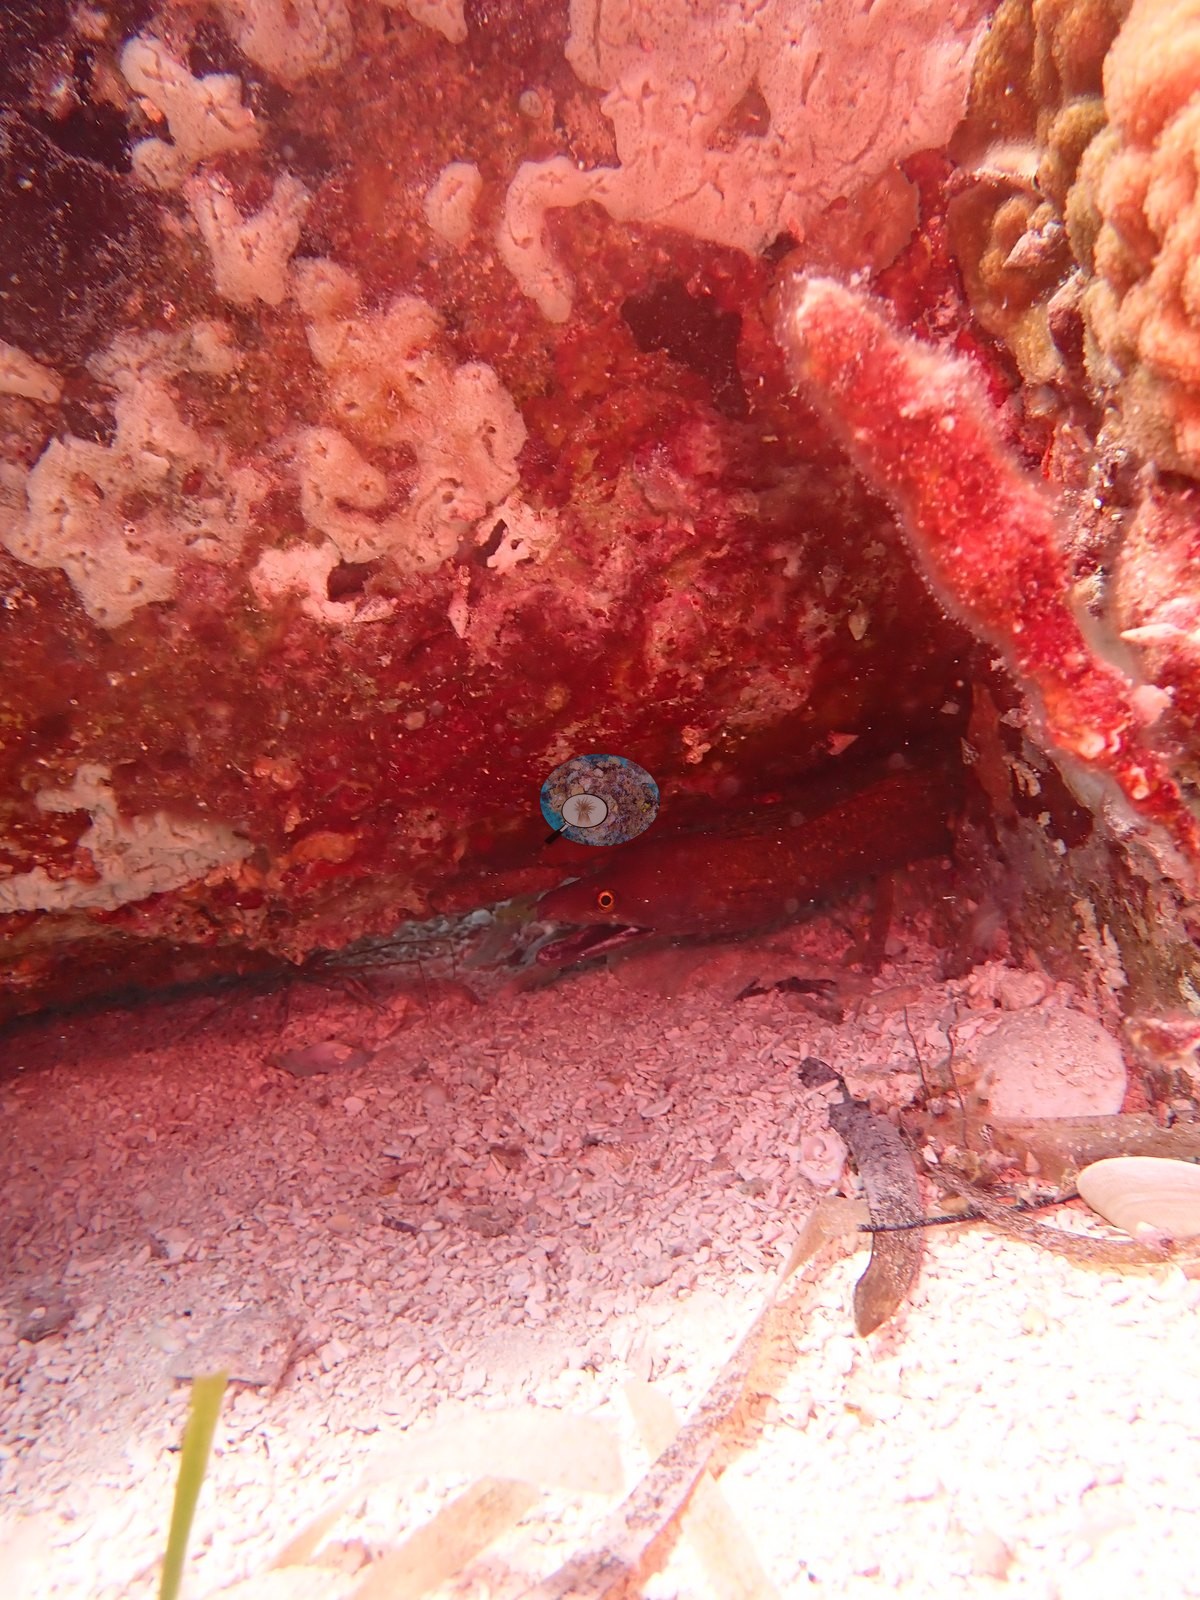
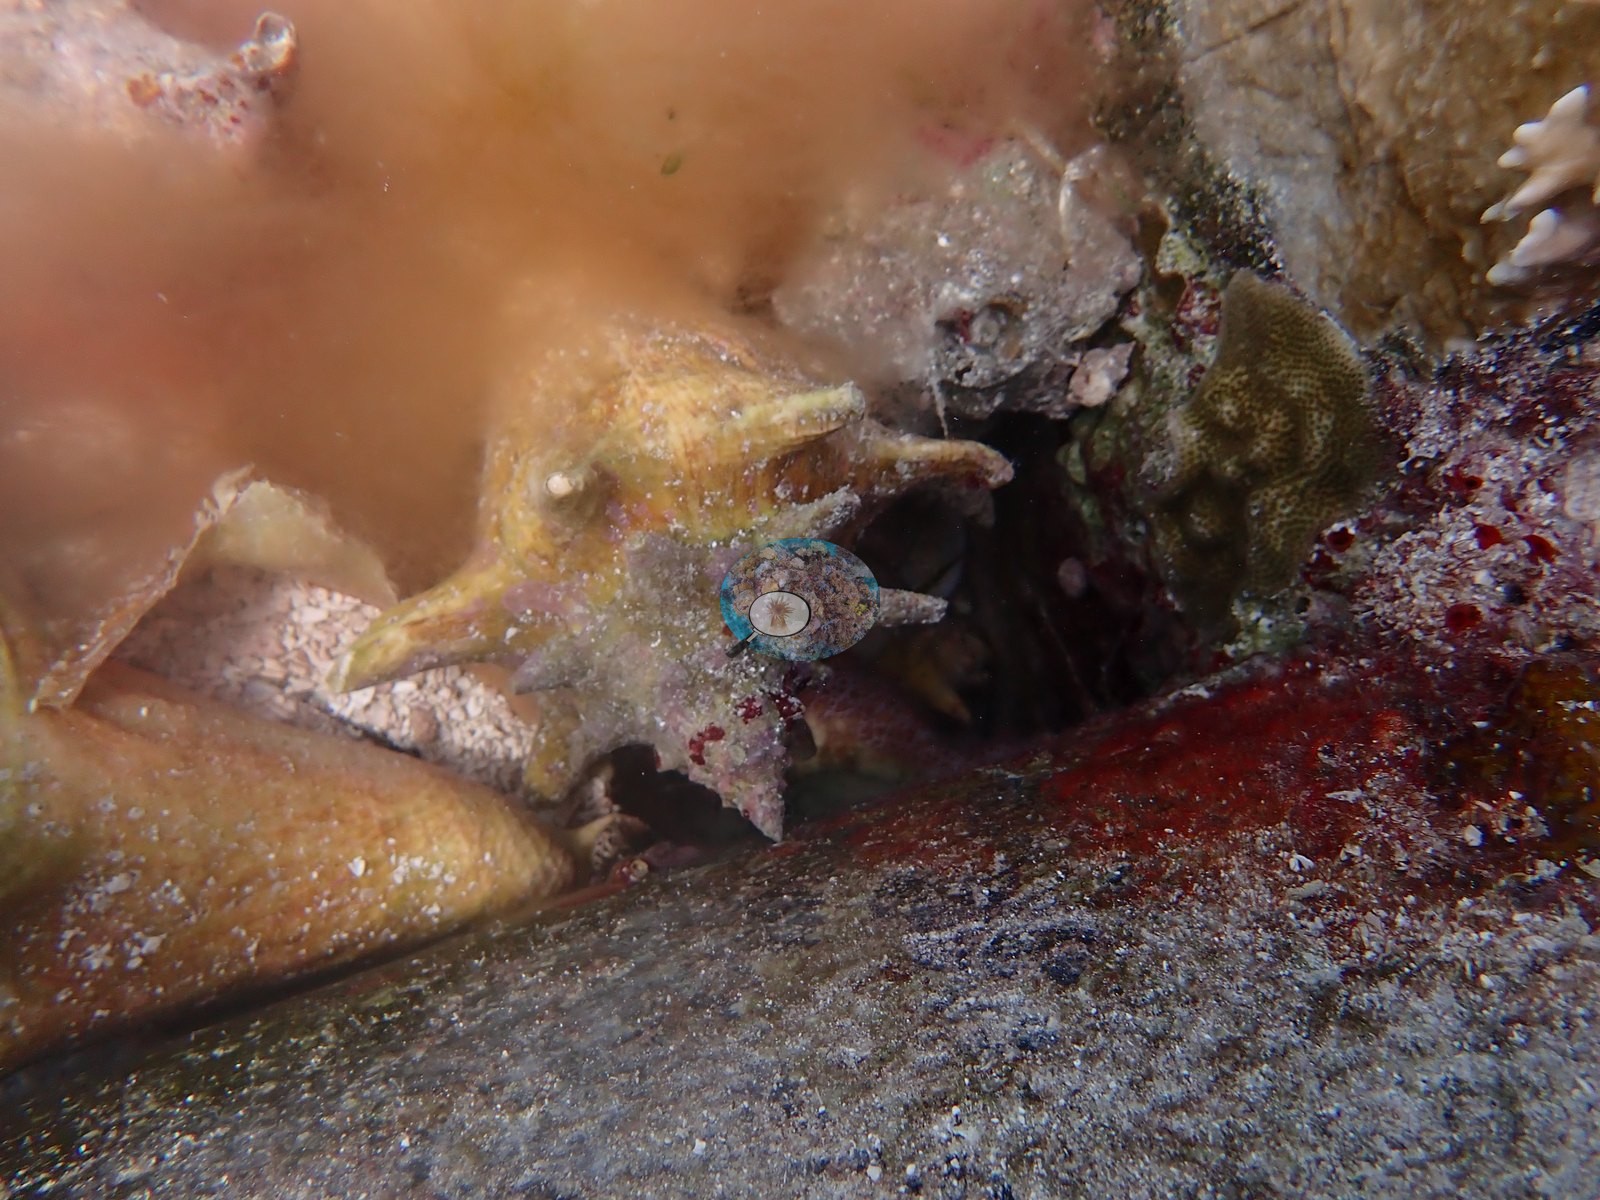
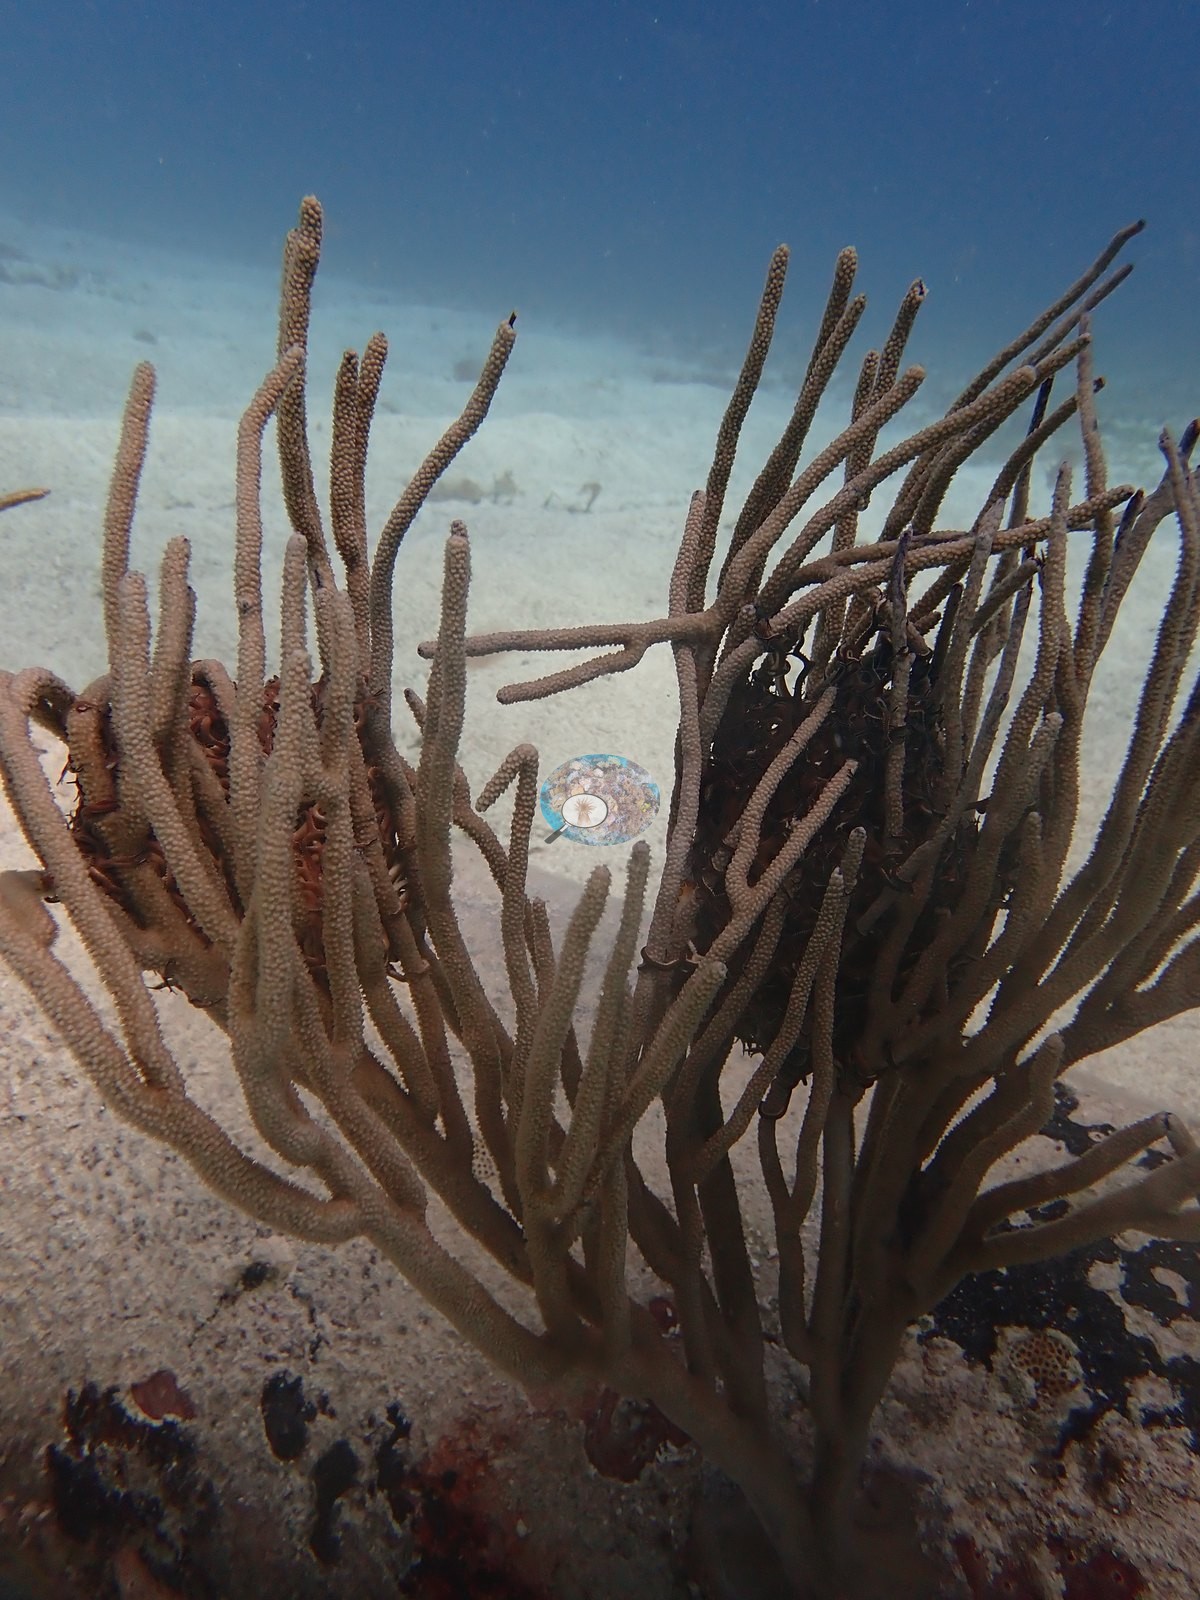
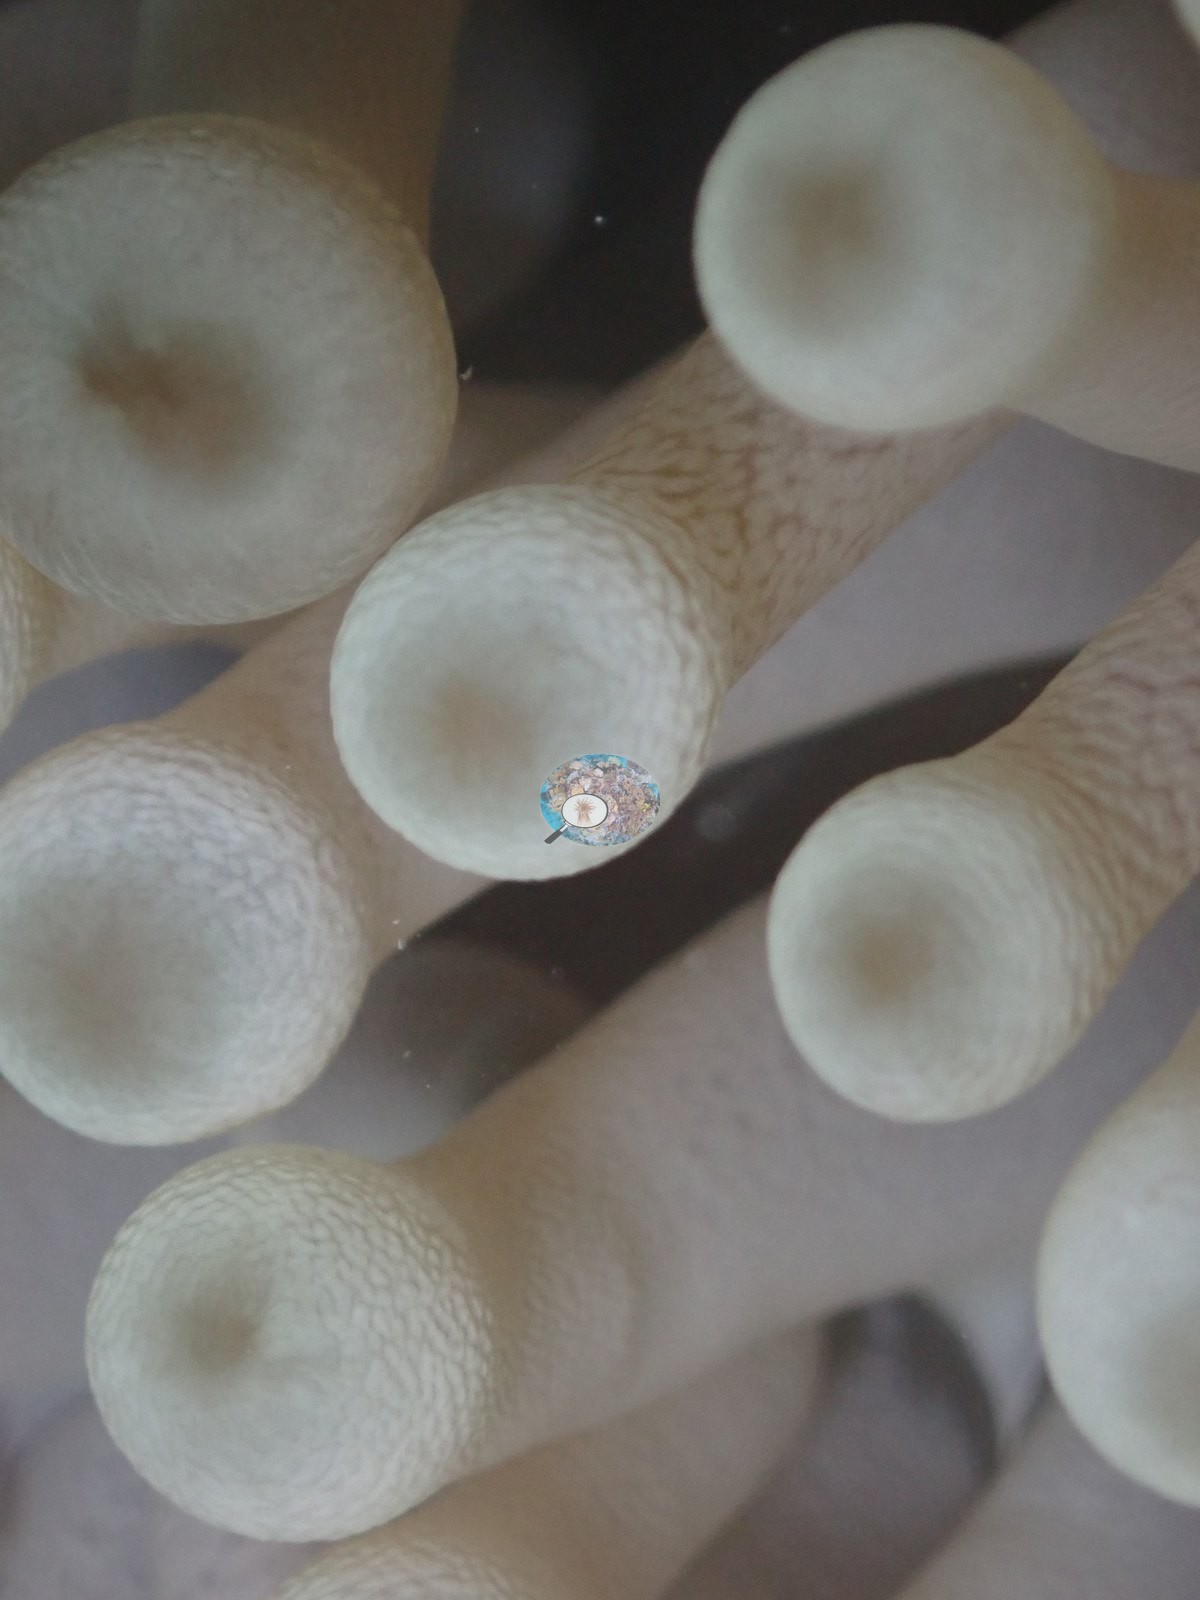
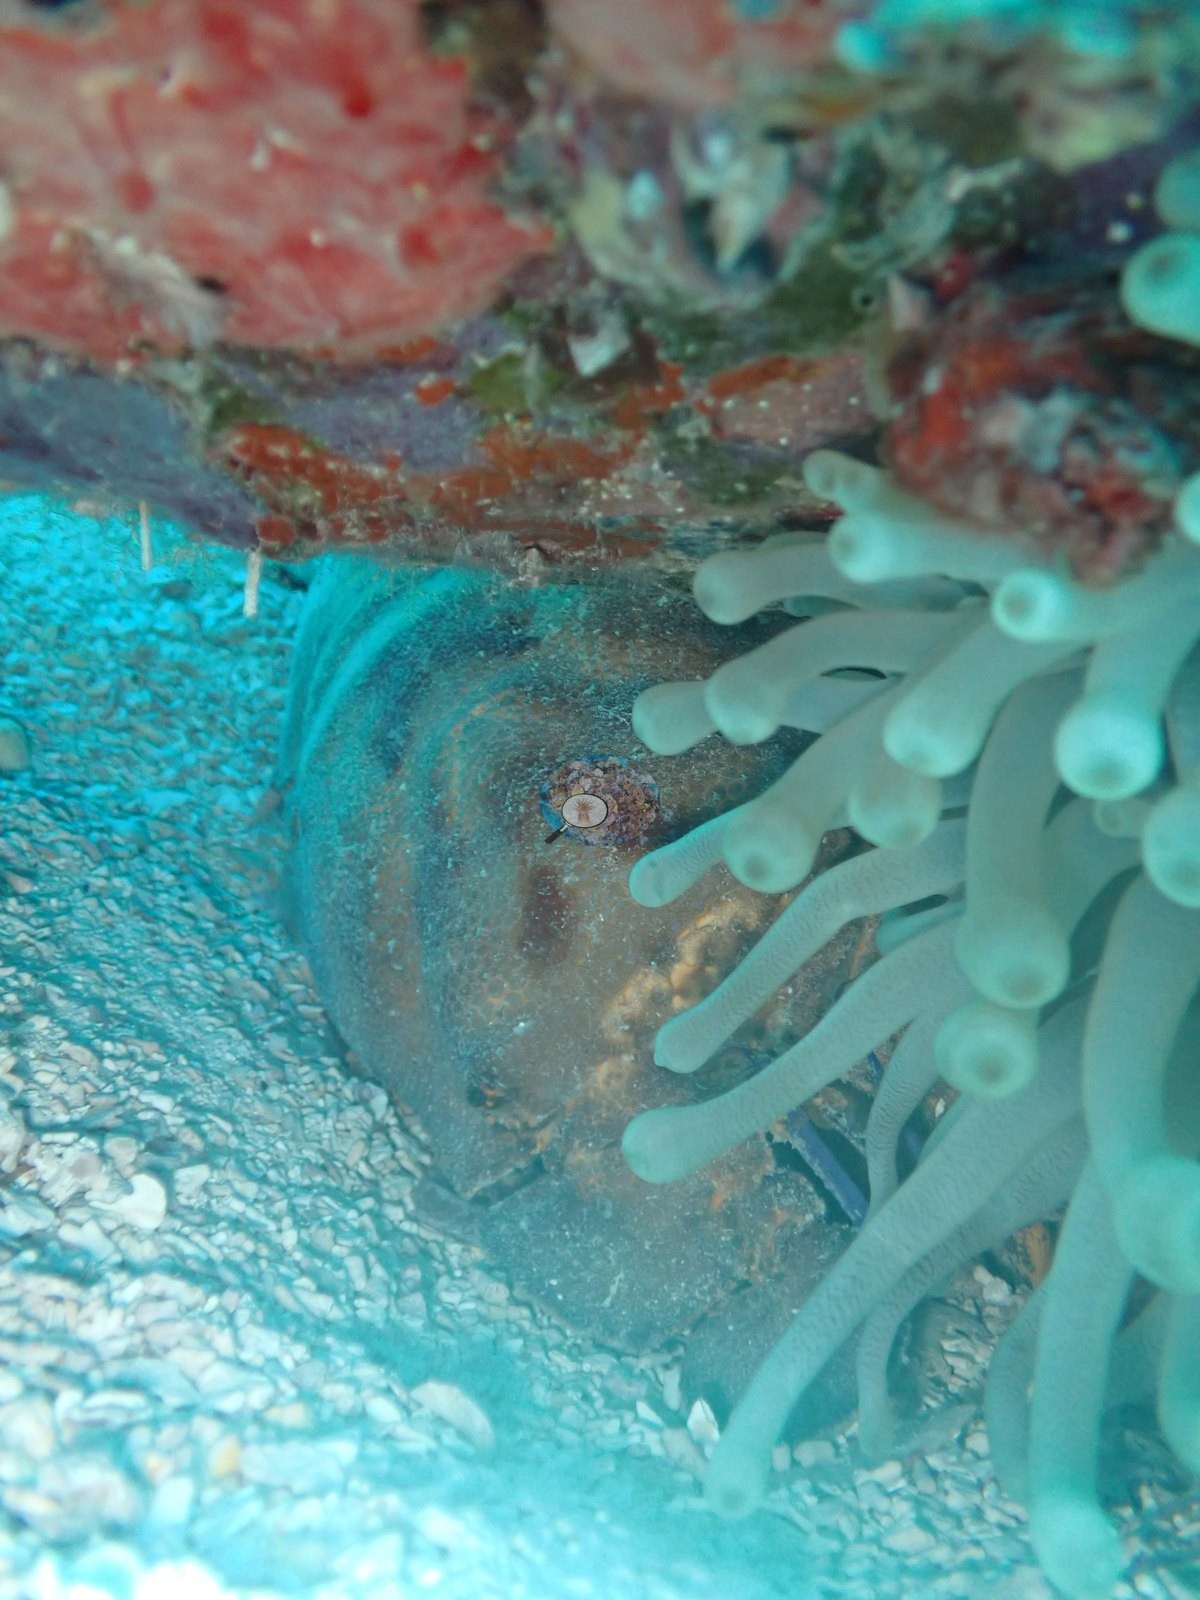
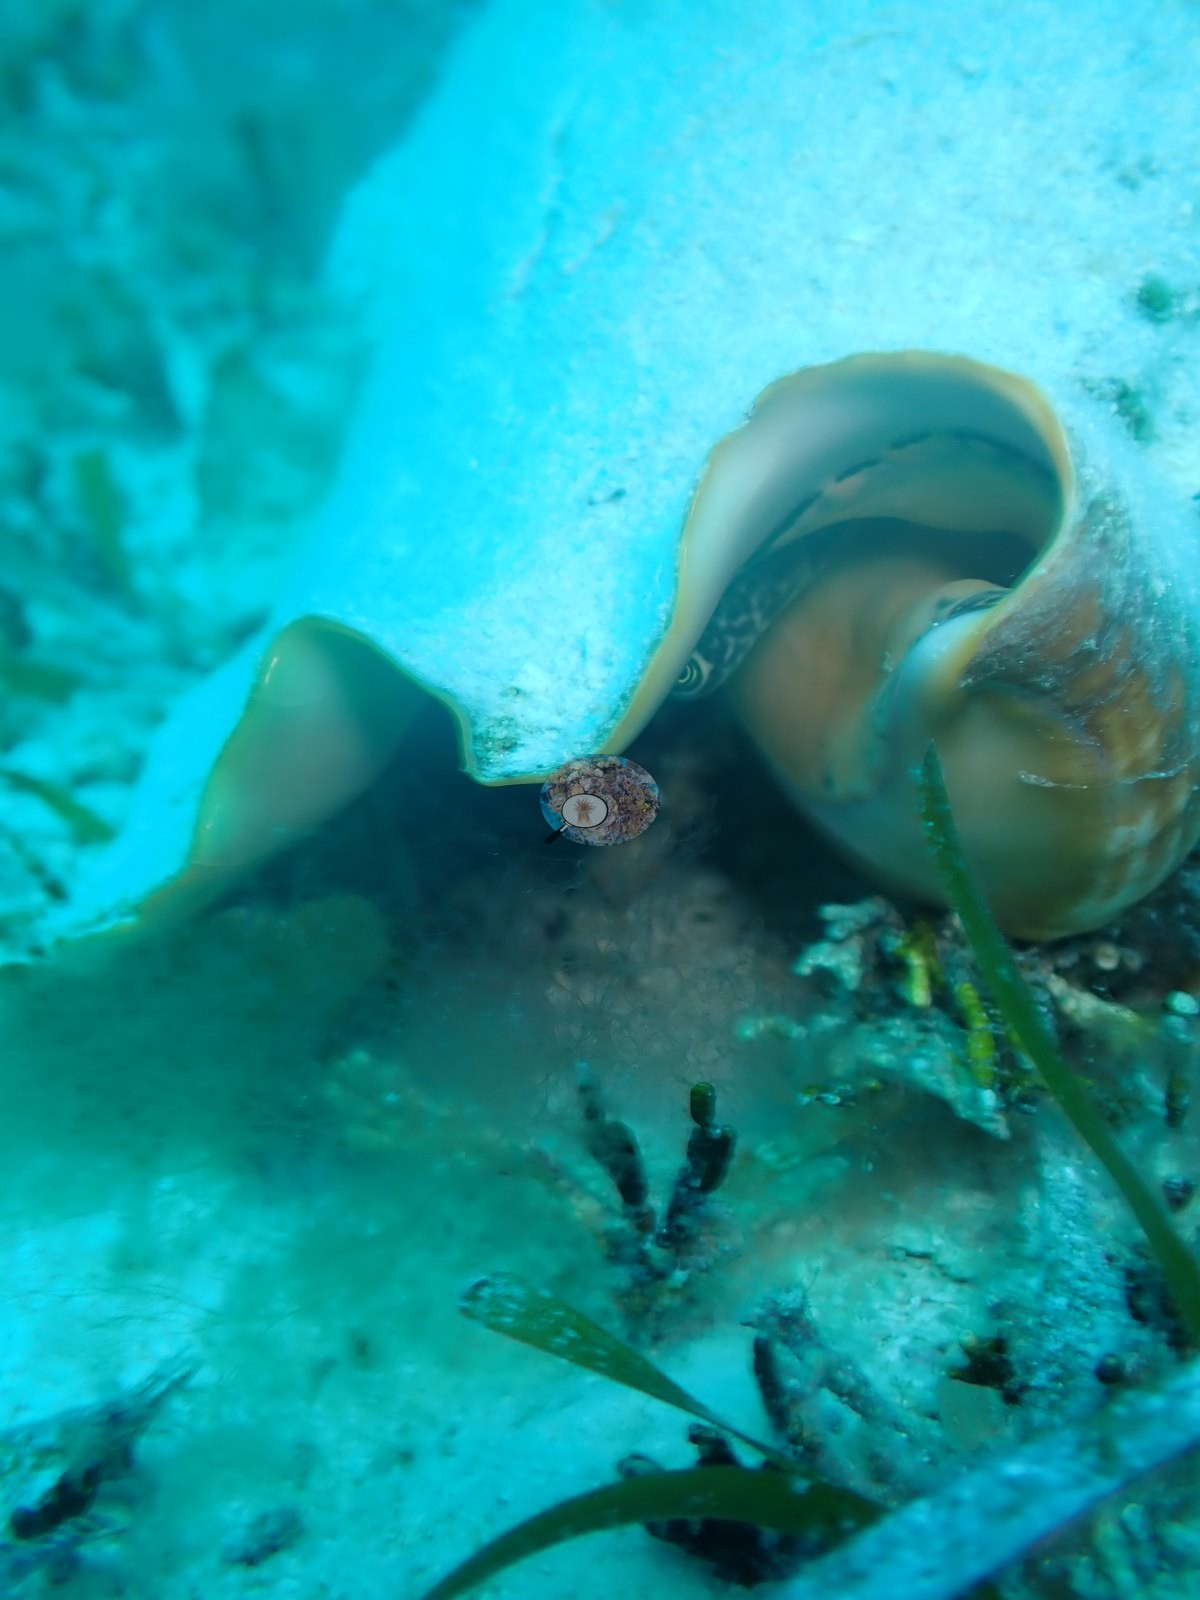
A giant anemone trails slender tentacles from one crevice, and a queen conch grazes the sand nearby (e.g., Image 19, Image 30, Image 38).
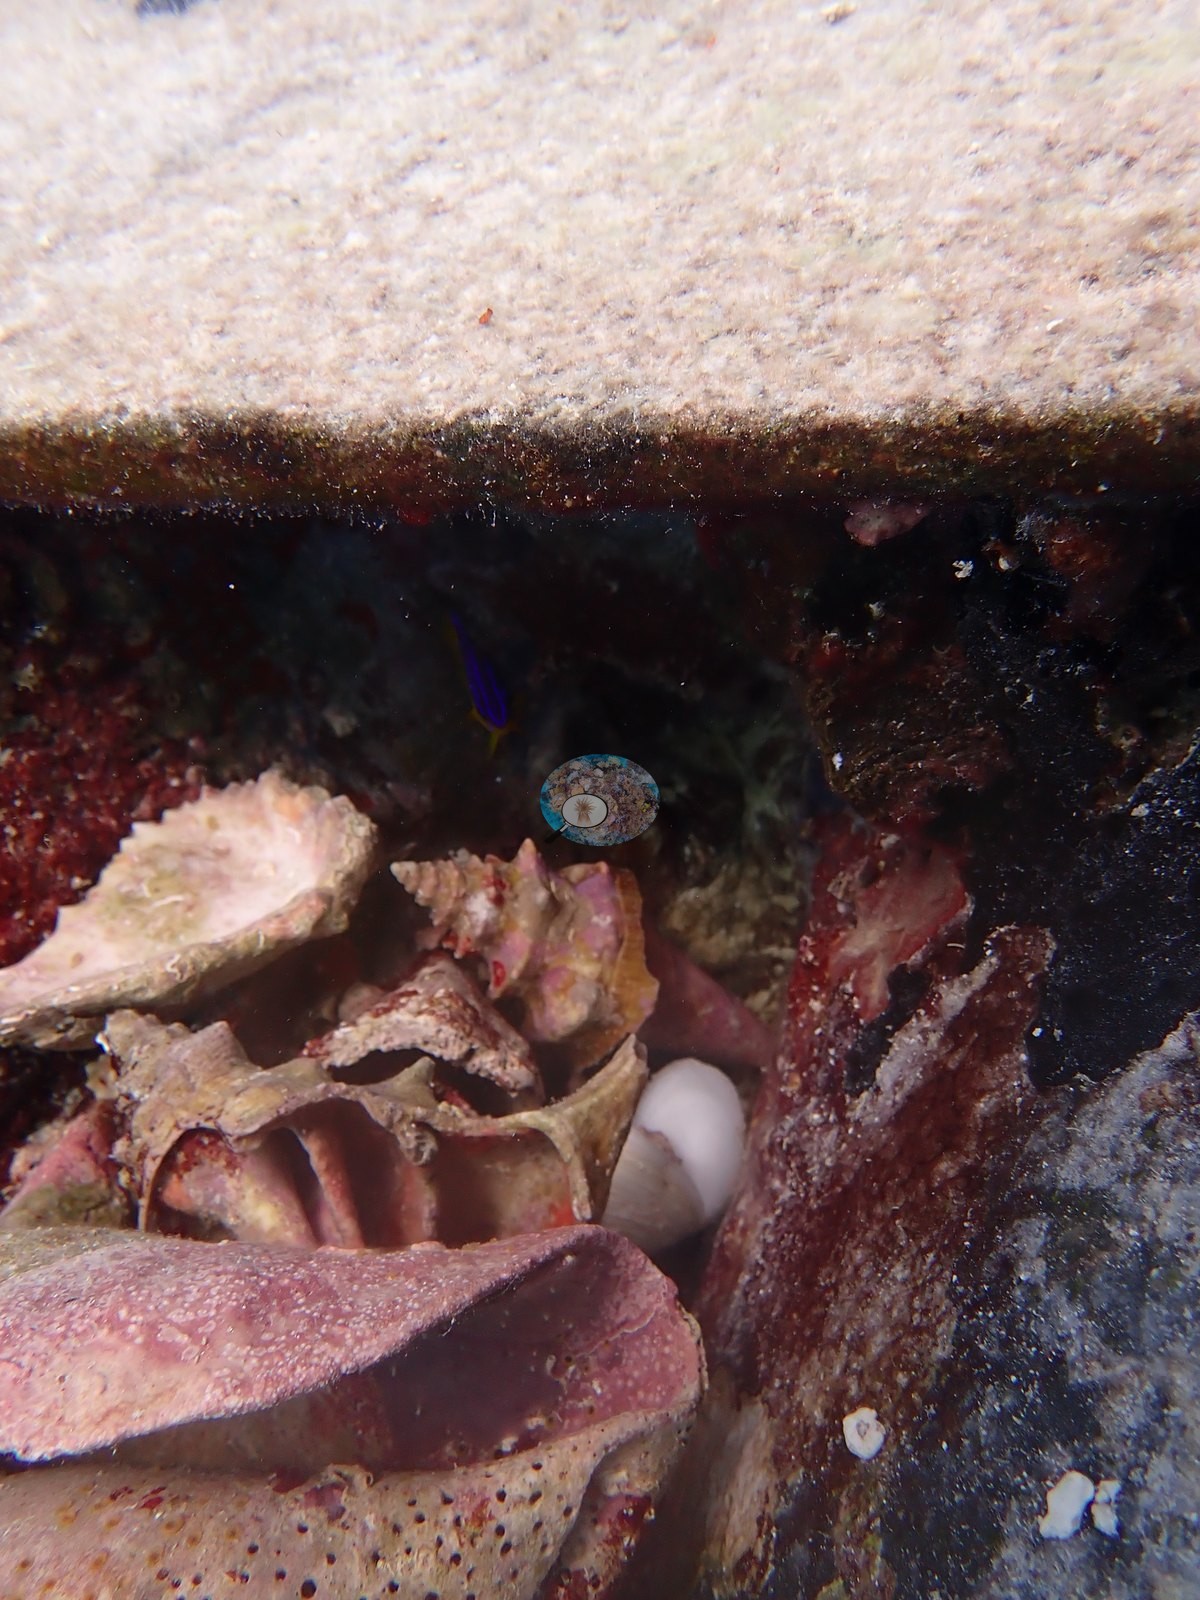
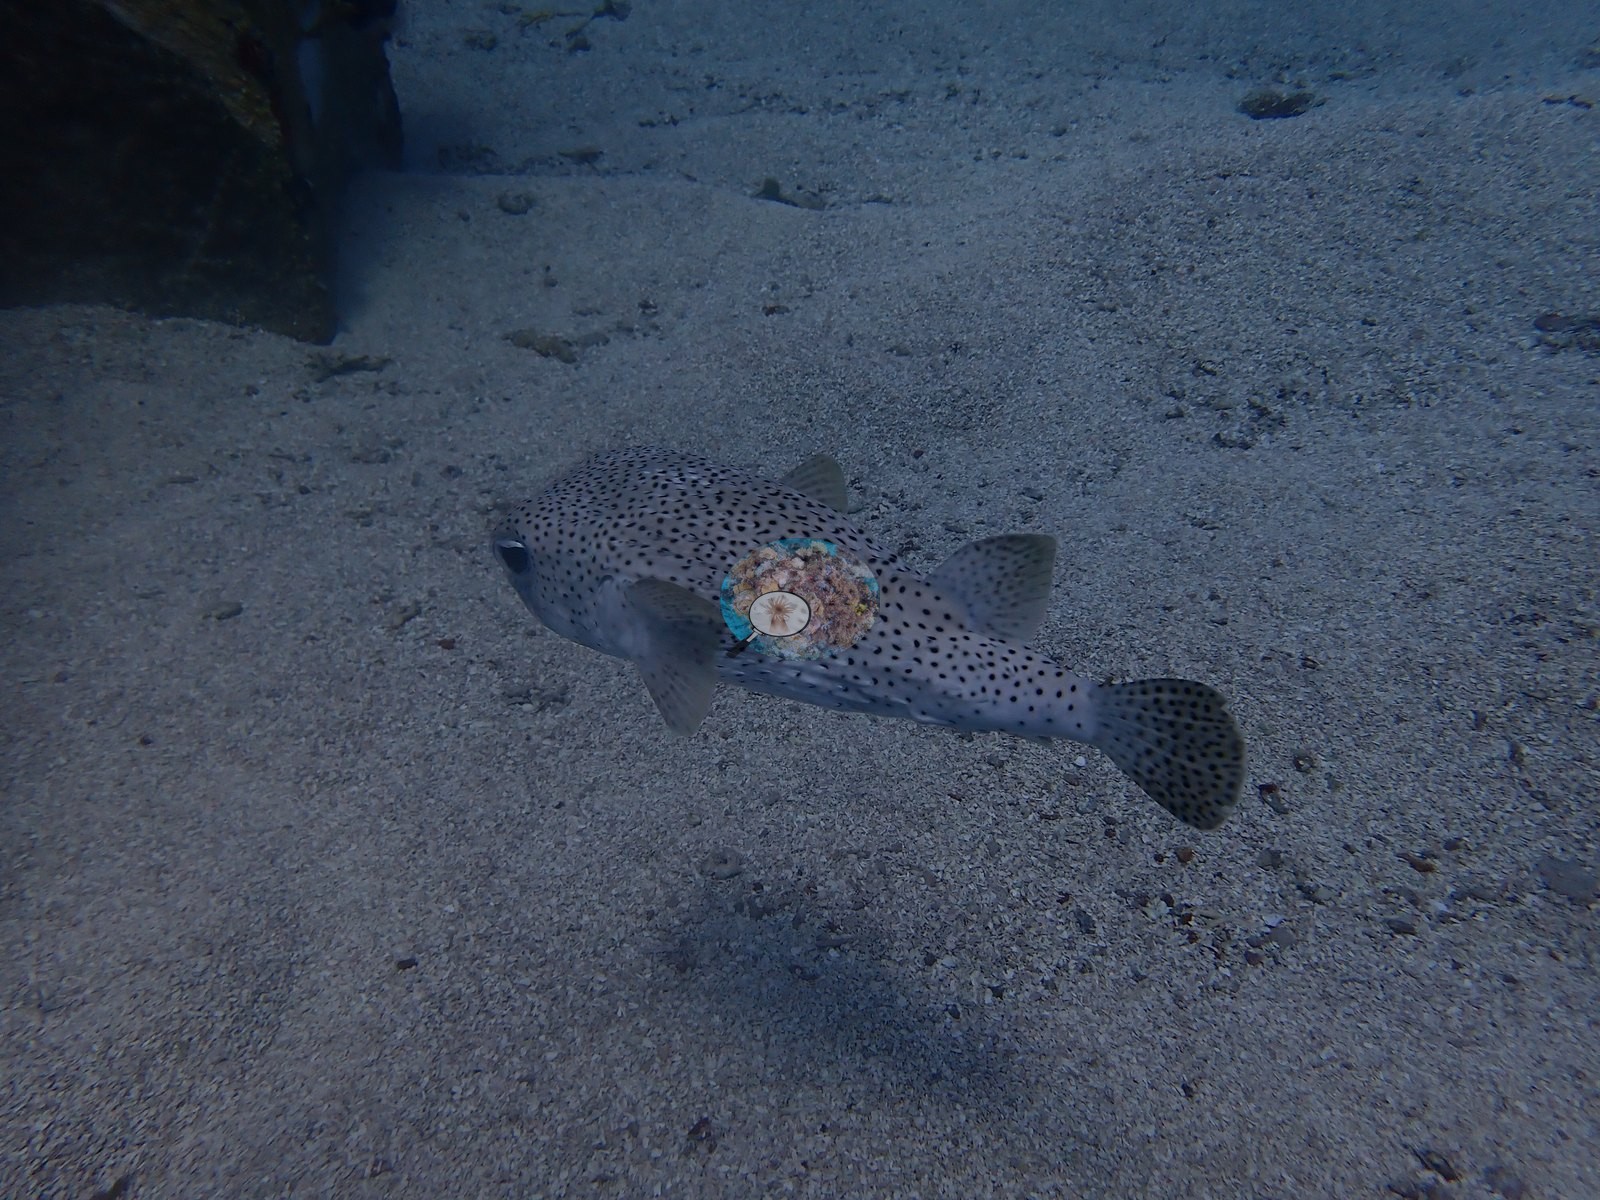
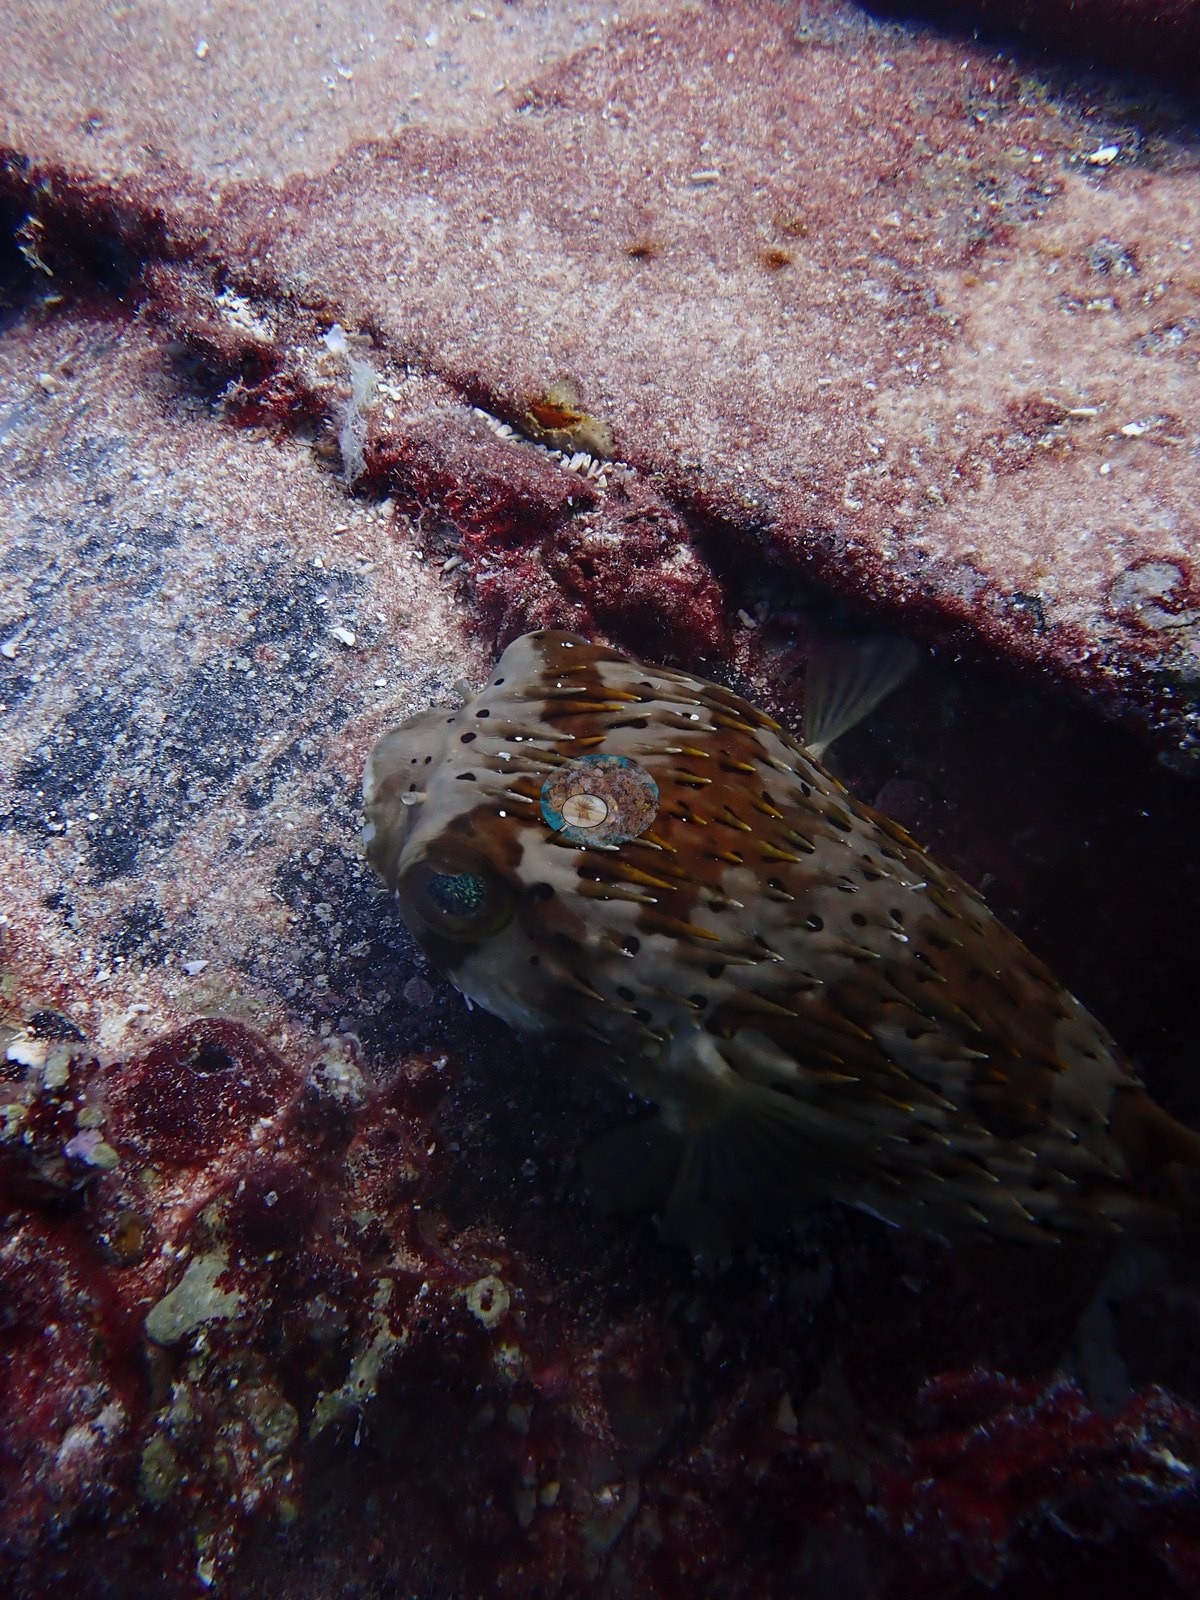
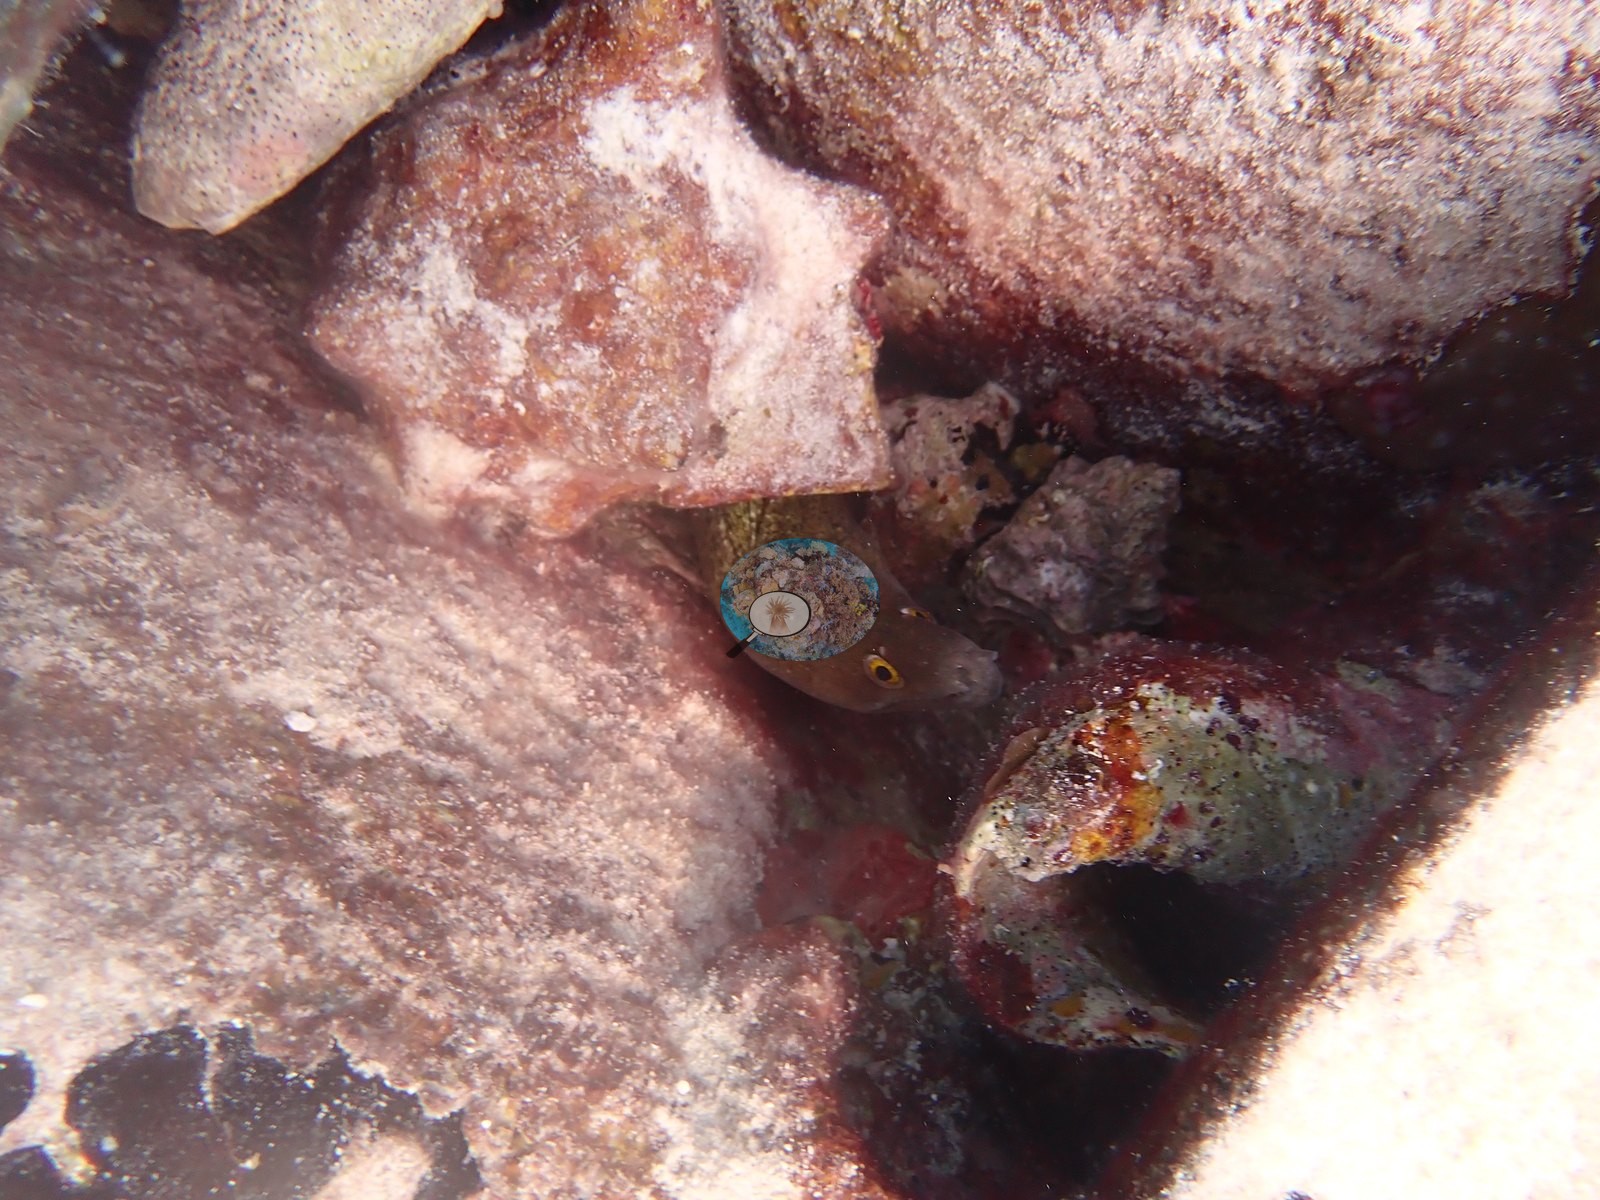
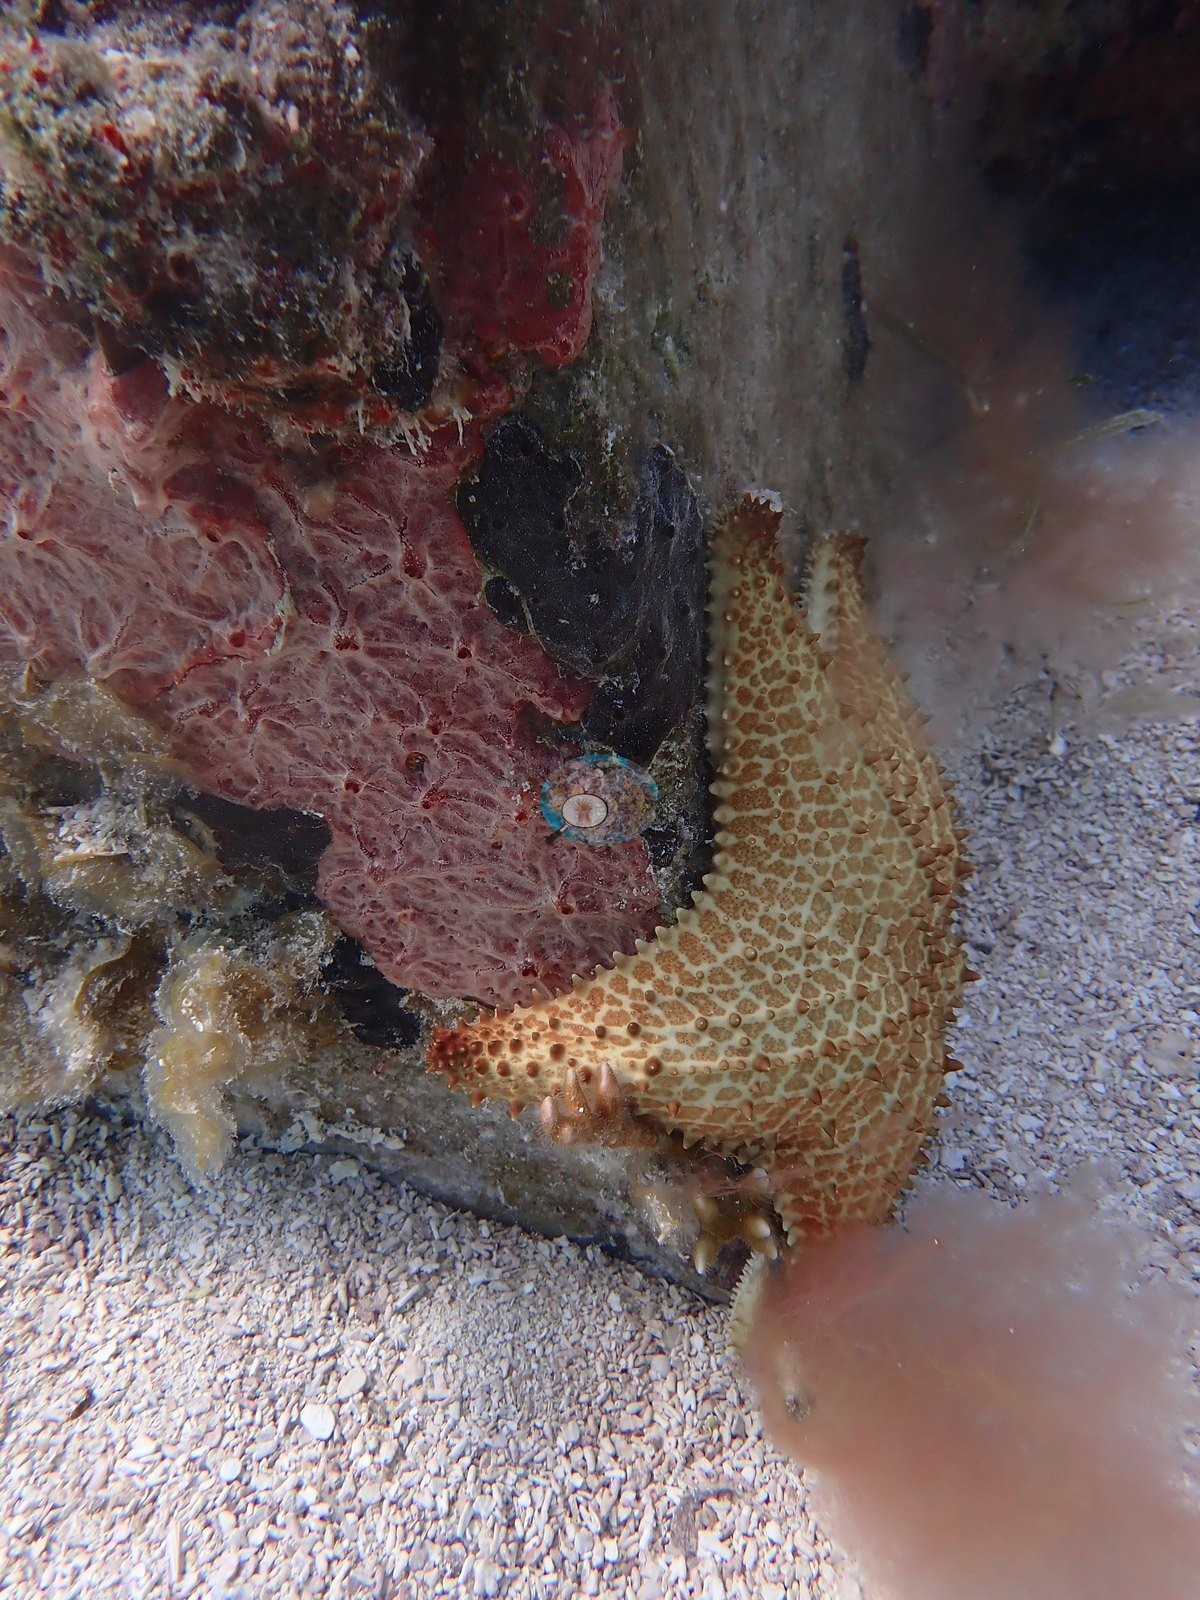
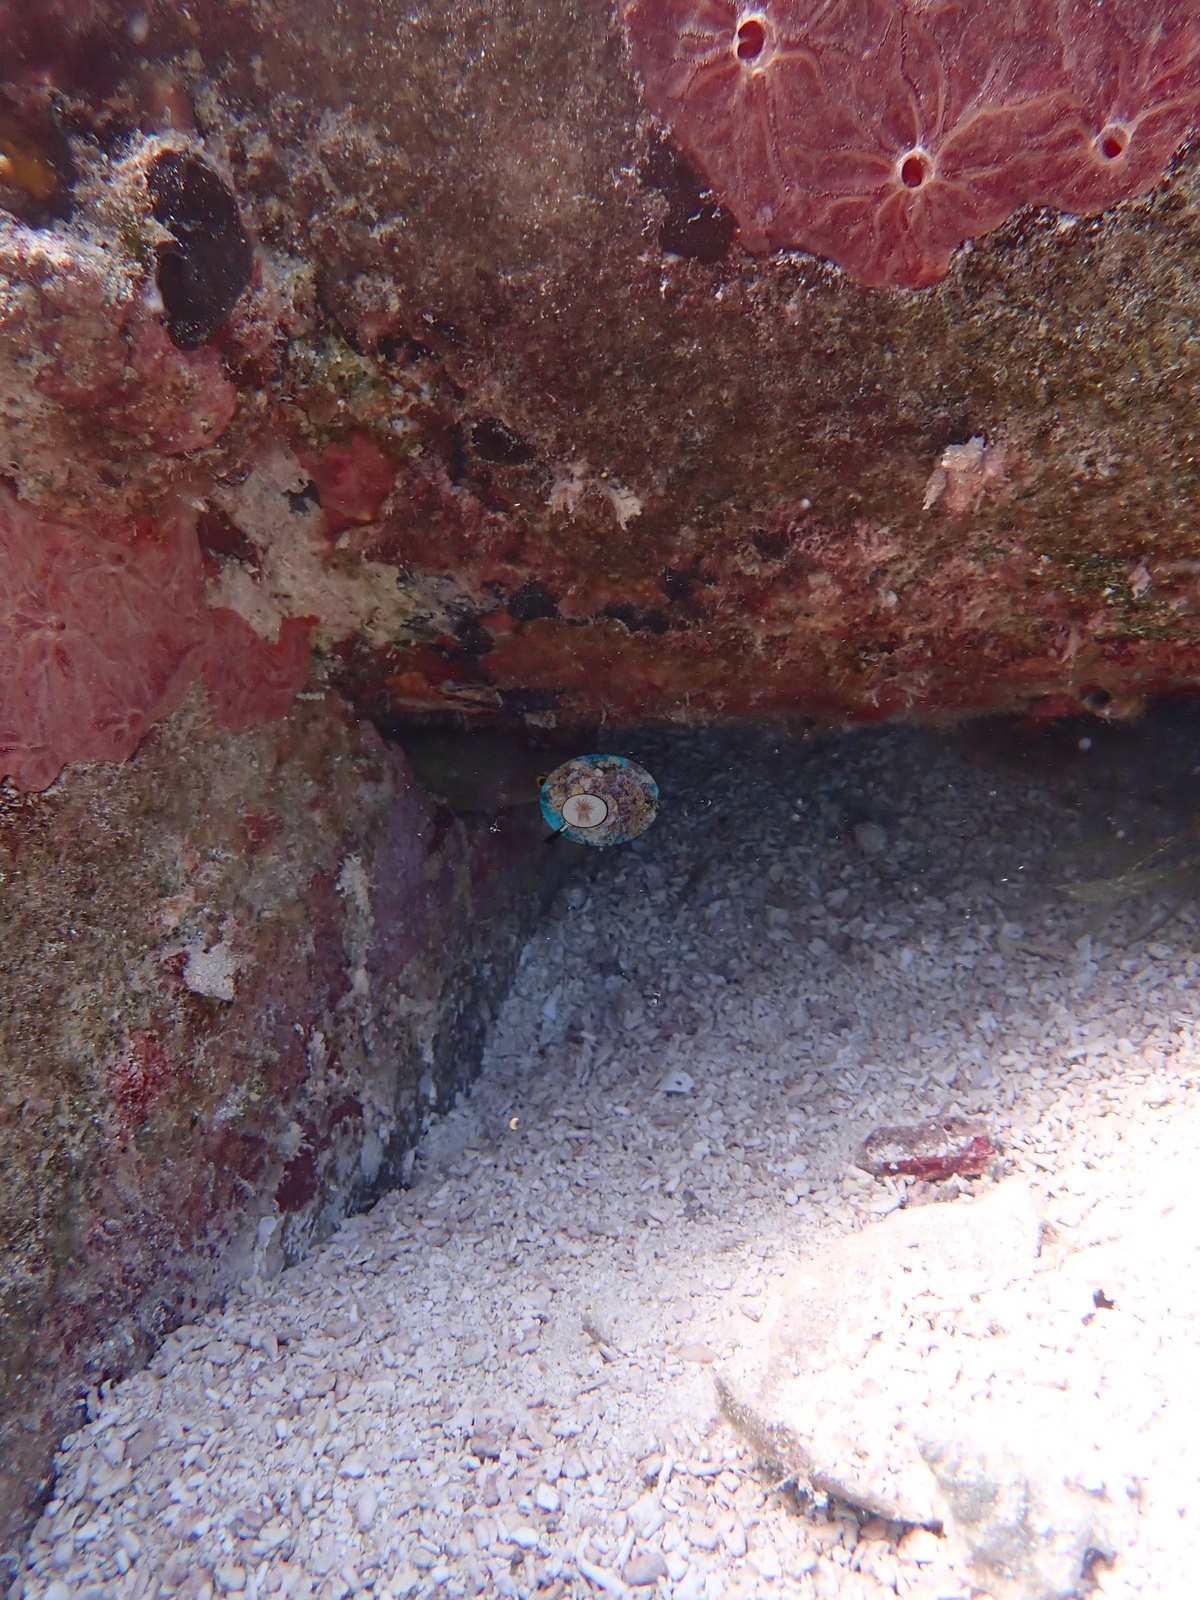
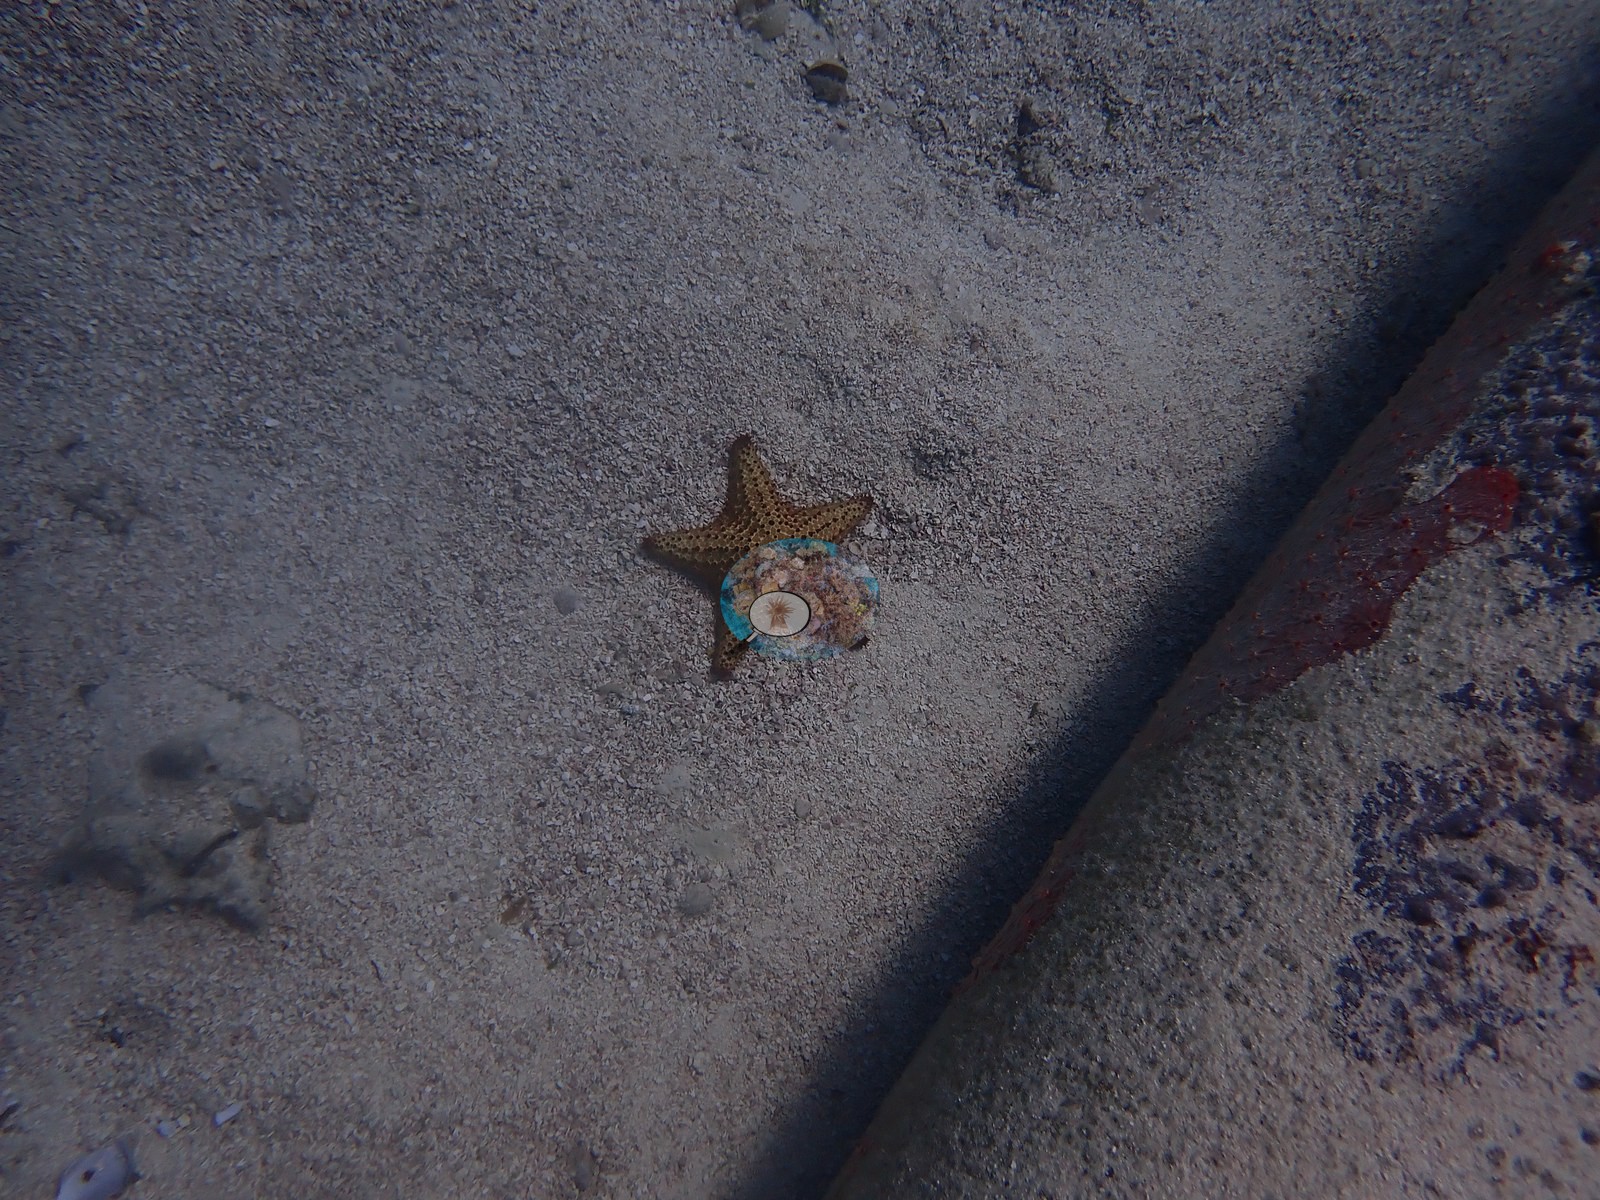
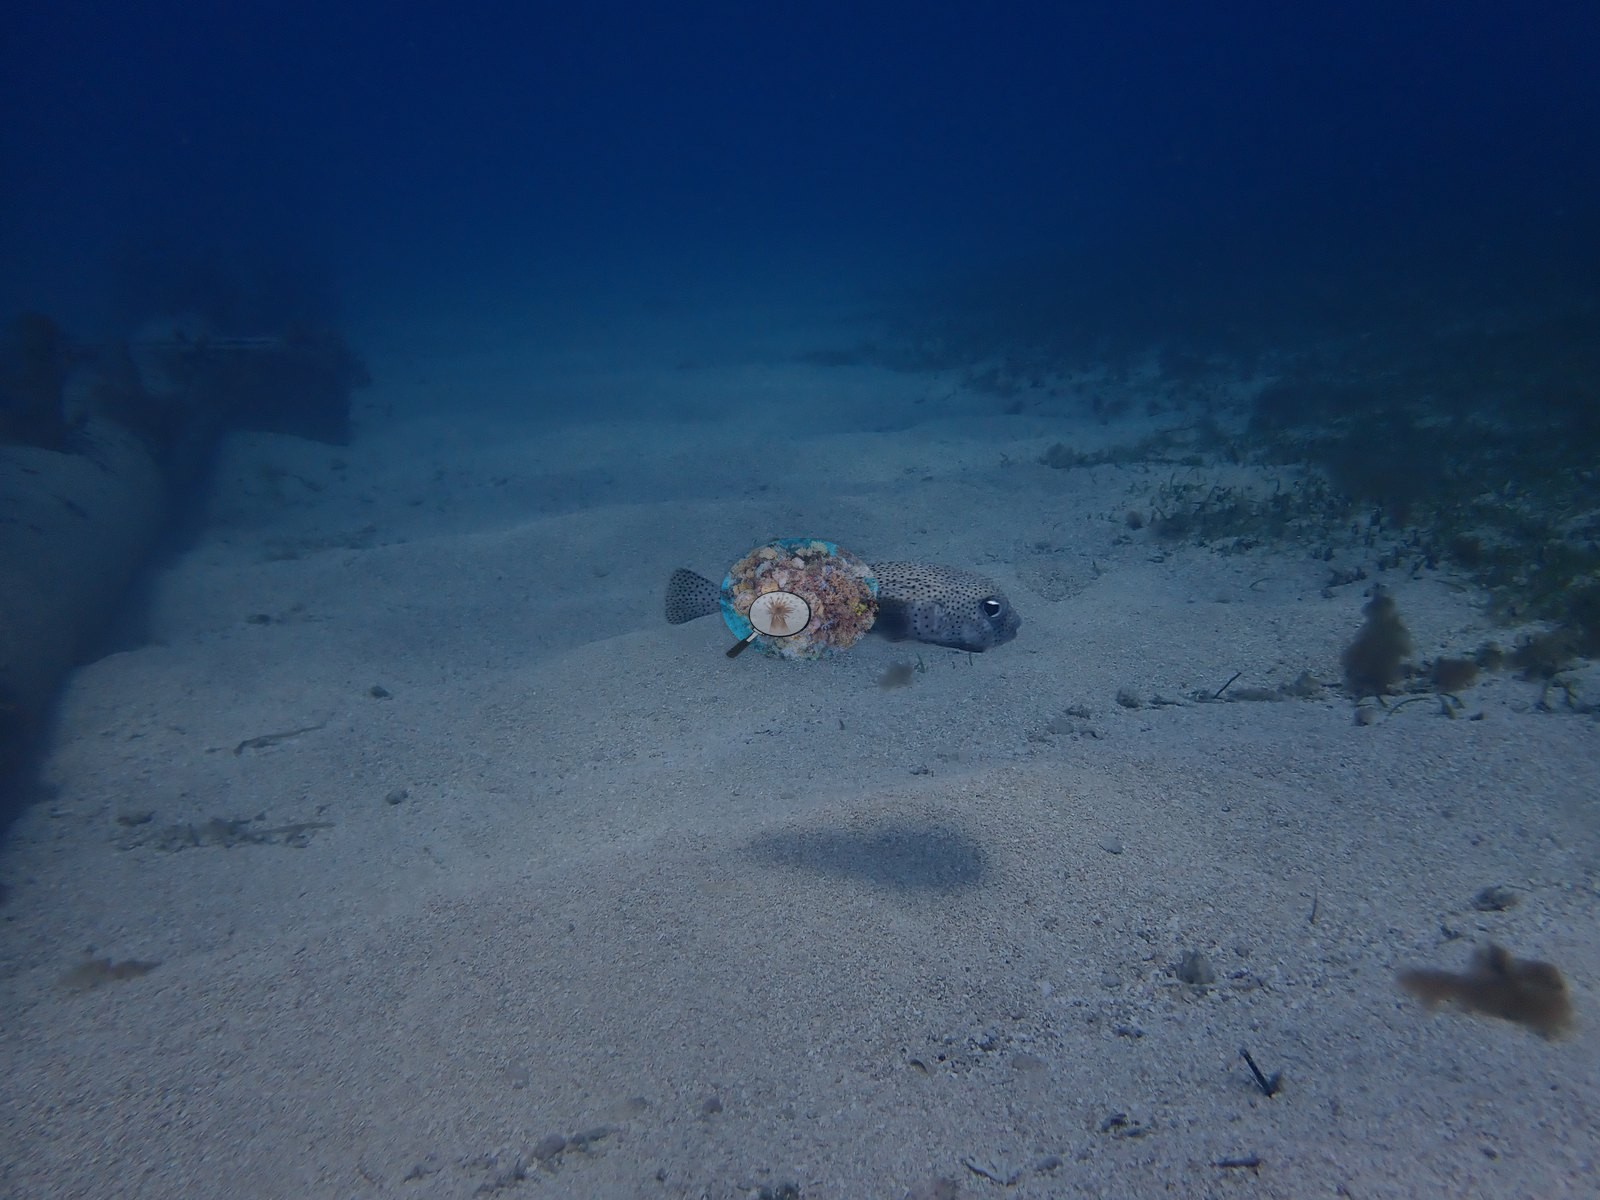
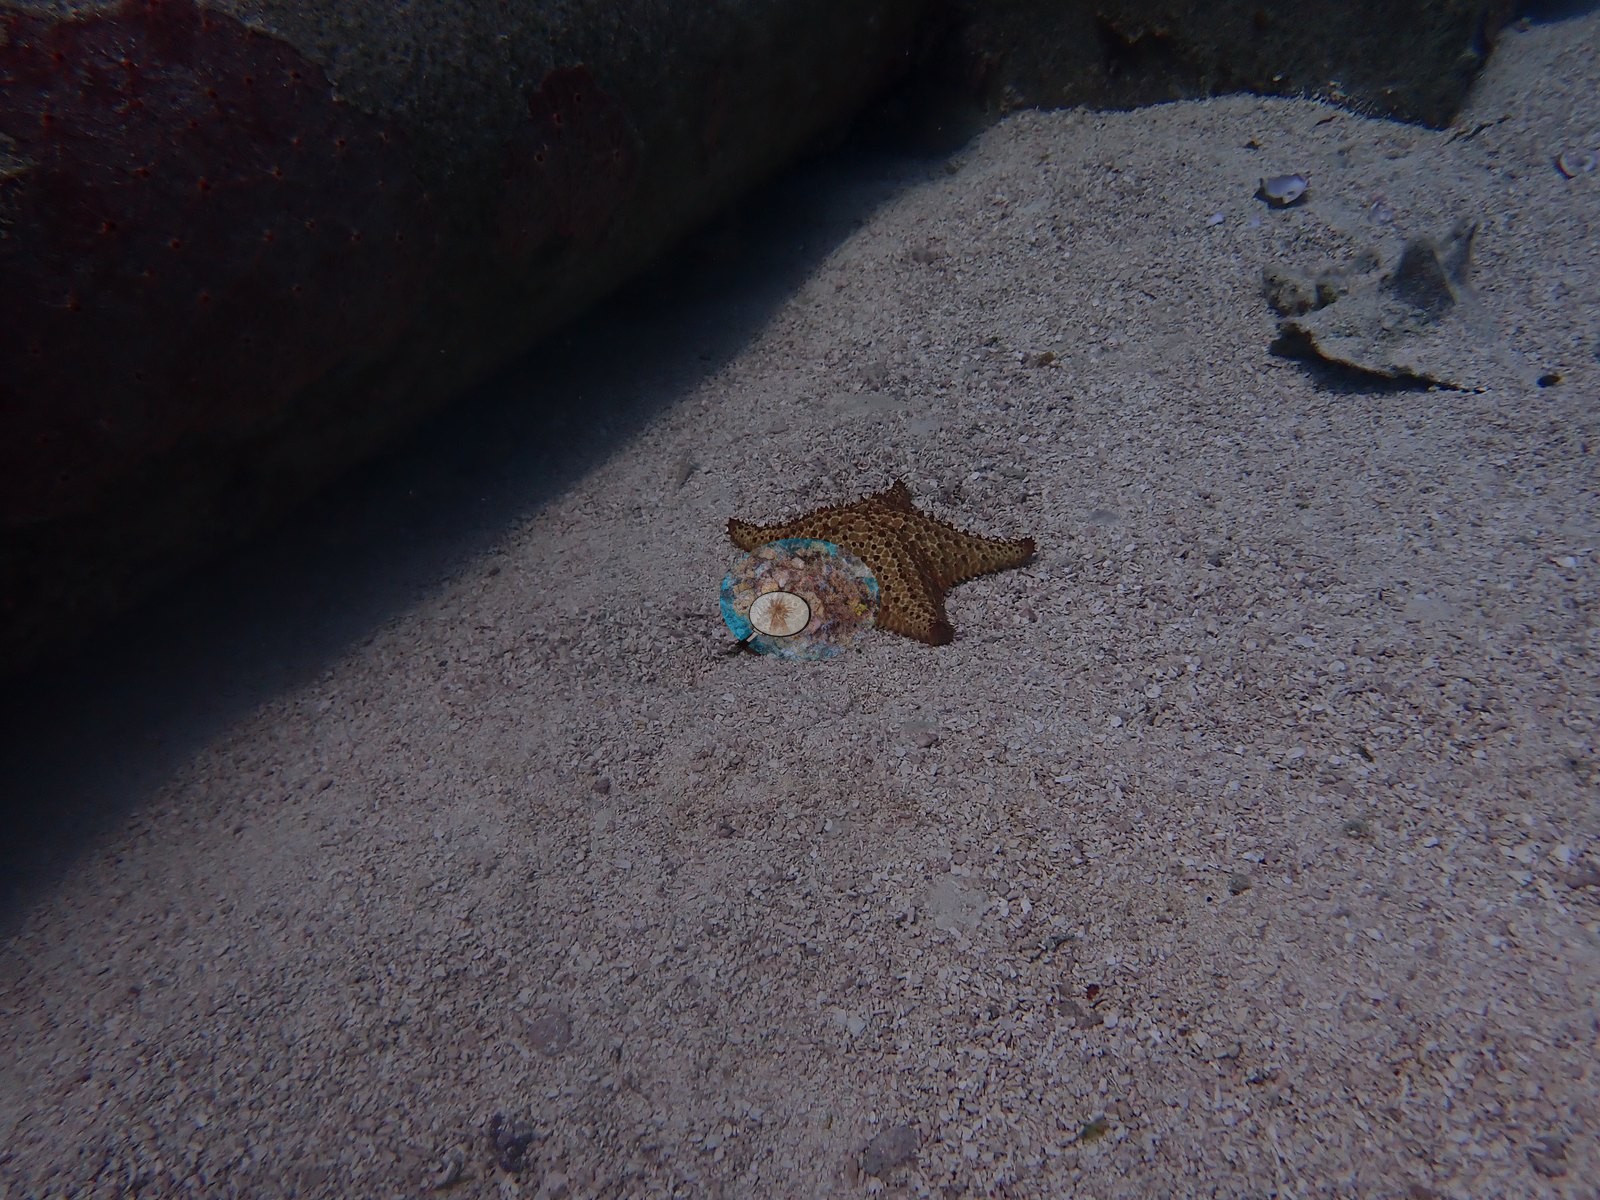
Watch for a black-spotted porcupinefish hovering just off the pipe, a cushion sea star parked on open sand, and small blue chromis schooling around the structure (e.g., Image 1, Image 8, Image 35, Image 40).
Comparisons with other data
No independent survey was made at this exact site; the nearest ones are listed in the table below.
CV model comparison
More info
DINOv3 and CoralSCOP were run on the same photos and are listed for comparison. Coralscapes v2 and v1 were also run but are not shown: Anderson does not consider Coralscapes reliable for these photos. No diver transect exists for this trip, so agreement between the rows is not accuracy, and as of September 2026 no computer-vision method estimates coral cover accurately on new images; treat every row as indicative.| Method | Hard-coral cover (%) |
|---|---|
| In-house DINOv3 | 19.4 |
| CoralSCOP unedited | 19.3 |
| Claude | 6.6 |
Independent surveys nearby
Within 5 km, 1 independent survey station recorded hard coral cover in 2013. The most recent nearby survey is from 2013, so these values predate recent heat stress. This site's own estimate (6.6%) is indistinguishable from the range of these surveys (2.8%): the 3.8-point gap is inside the ±7 percentage-point noise between methods; the methods differ, so the comparison is context, not a like-for-like test.
Collected by other programs using different methods (the XL Catlin Seaview Survey uses photo-transects with automated image annotation), so these are context for the figures above, not a like-for-like comparison. Where a station was surveyed more than once the range is shown. Station names are not dive-site names.
| Agency | Site / location | Date | Hard coral cover (%) | Distance | Link |
|---|---|---|---|---|---|
| XL Catlin Seaview Survey | transect 25018 | 2013 | 2.8% | 1.56 km | — |
Data & links
All images from Coral Reef Diagnostics. Data are from Coral Reef Diagnostics and the organizations named in the data-sources table above.
© Coral Reef Diagnostics.