
Anguilla - Catheley H
Part of the regional summary: Anguilla
More about this place: Anguilla on Wikipedia
More info
Leeward Caribbean Islands (NOAA CRW virtual station) · Eastern Caribbean ecoregion mean=13.1°C-heating weeksCatheley H is part reef, part reclaimed junkyard - derelict fish traps, concrete rings, and pilings now crowded with brain and boulder corals, with a nurse shark tucked in a swim-through and lobsters sheltering nearby. A blind Claude computer-vision point count puts coral cover around 6.2%. Wreck and artificial-structure site: this cover value counts coral growing on man-made structure (steel, concrete, wreck debris) and the bottom around it, so it isn't comparable with natural-reef cover or with regional averages.
Two independent survey stations shown with the program’s logo — click one to see how far it is from this site.
One other CRD dive site within 5 km shown in orange — click a marker to open its page.
12 of these 52 photographs are shown beside the text that discusses them under "Site description" below.
Site description
Setting
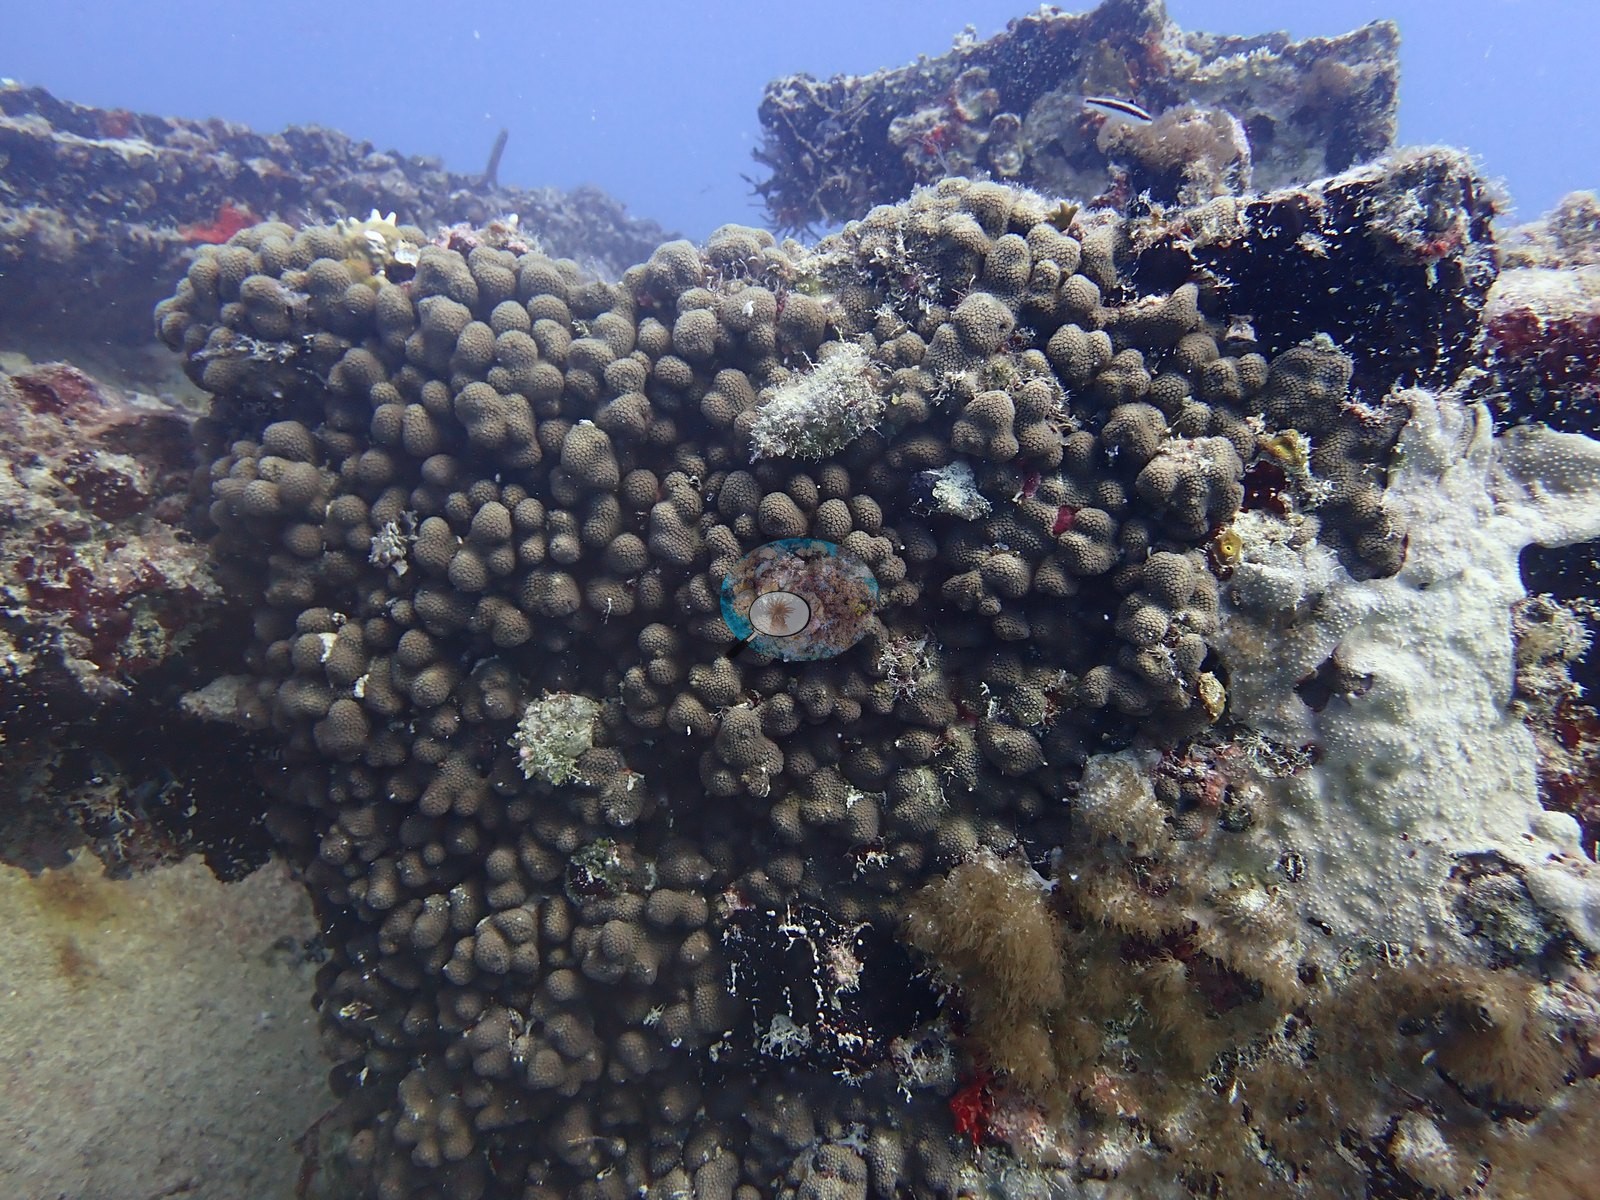
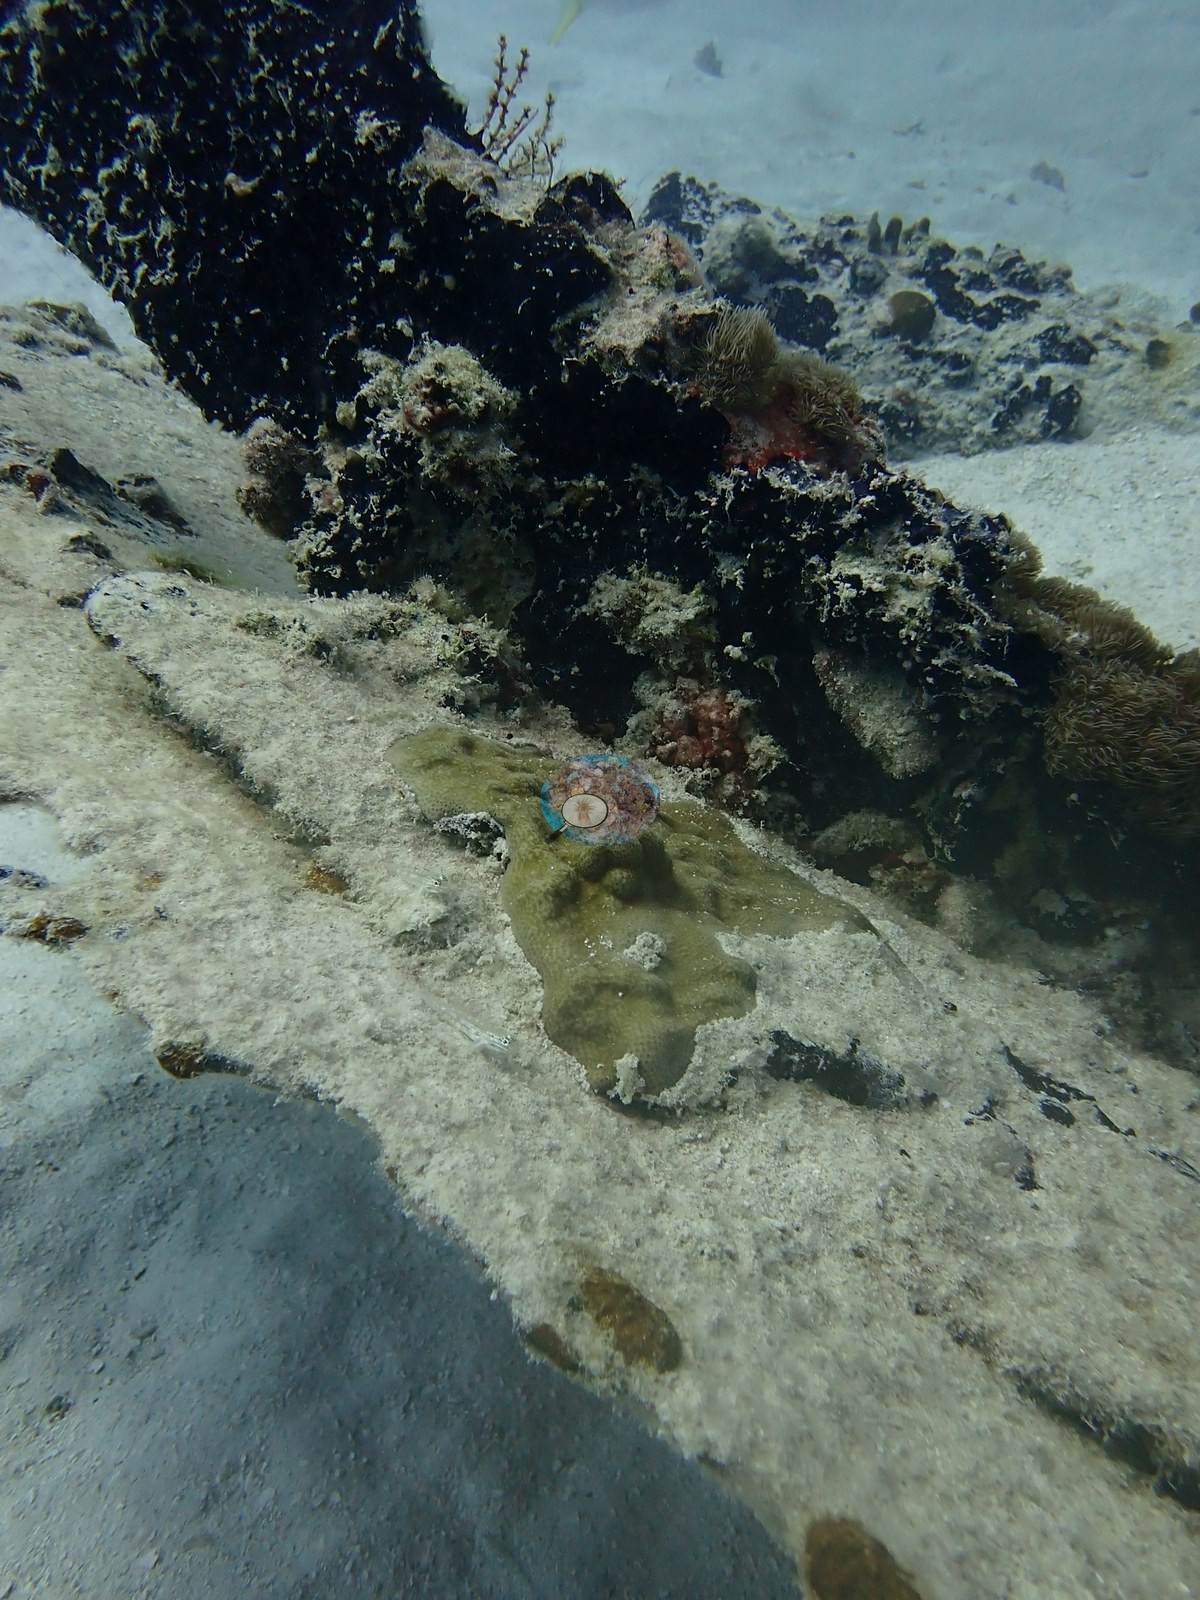
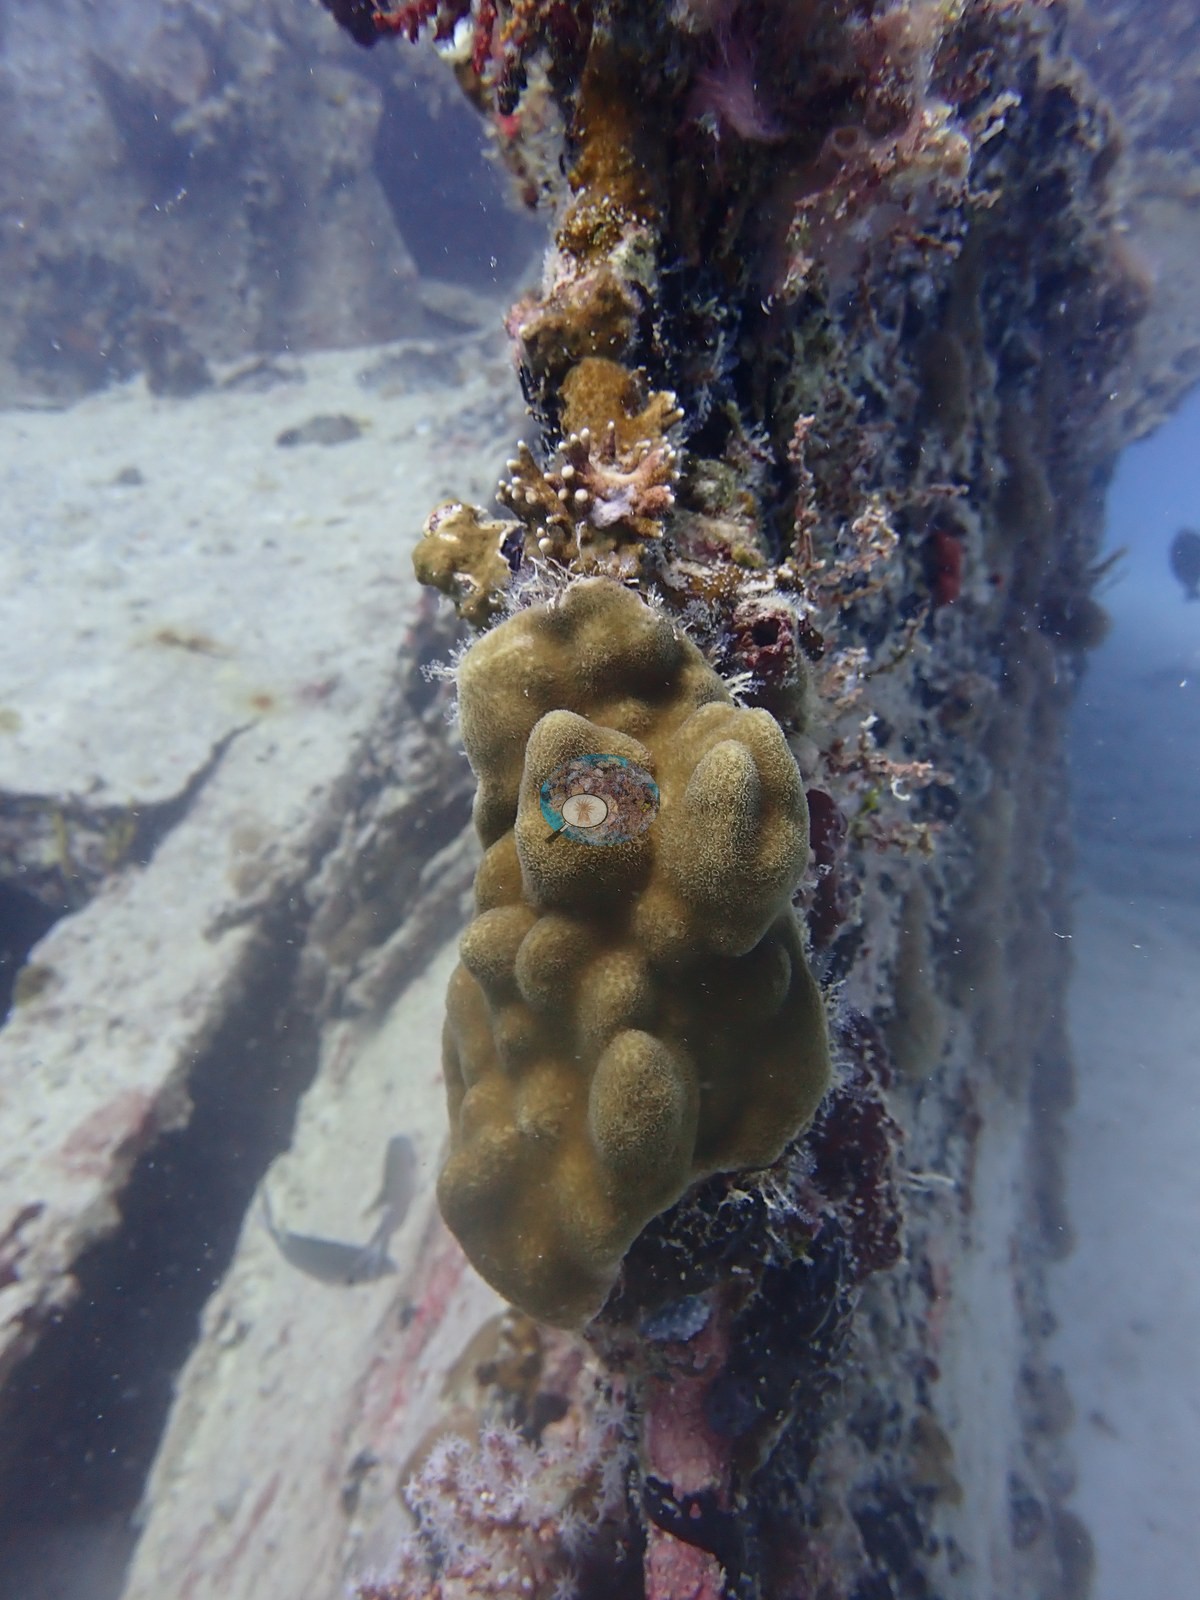
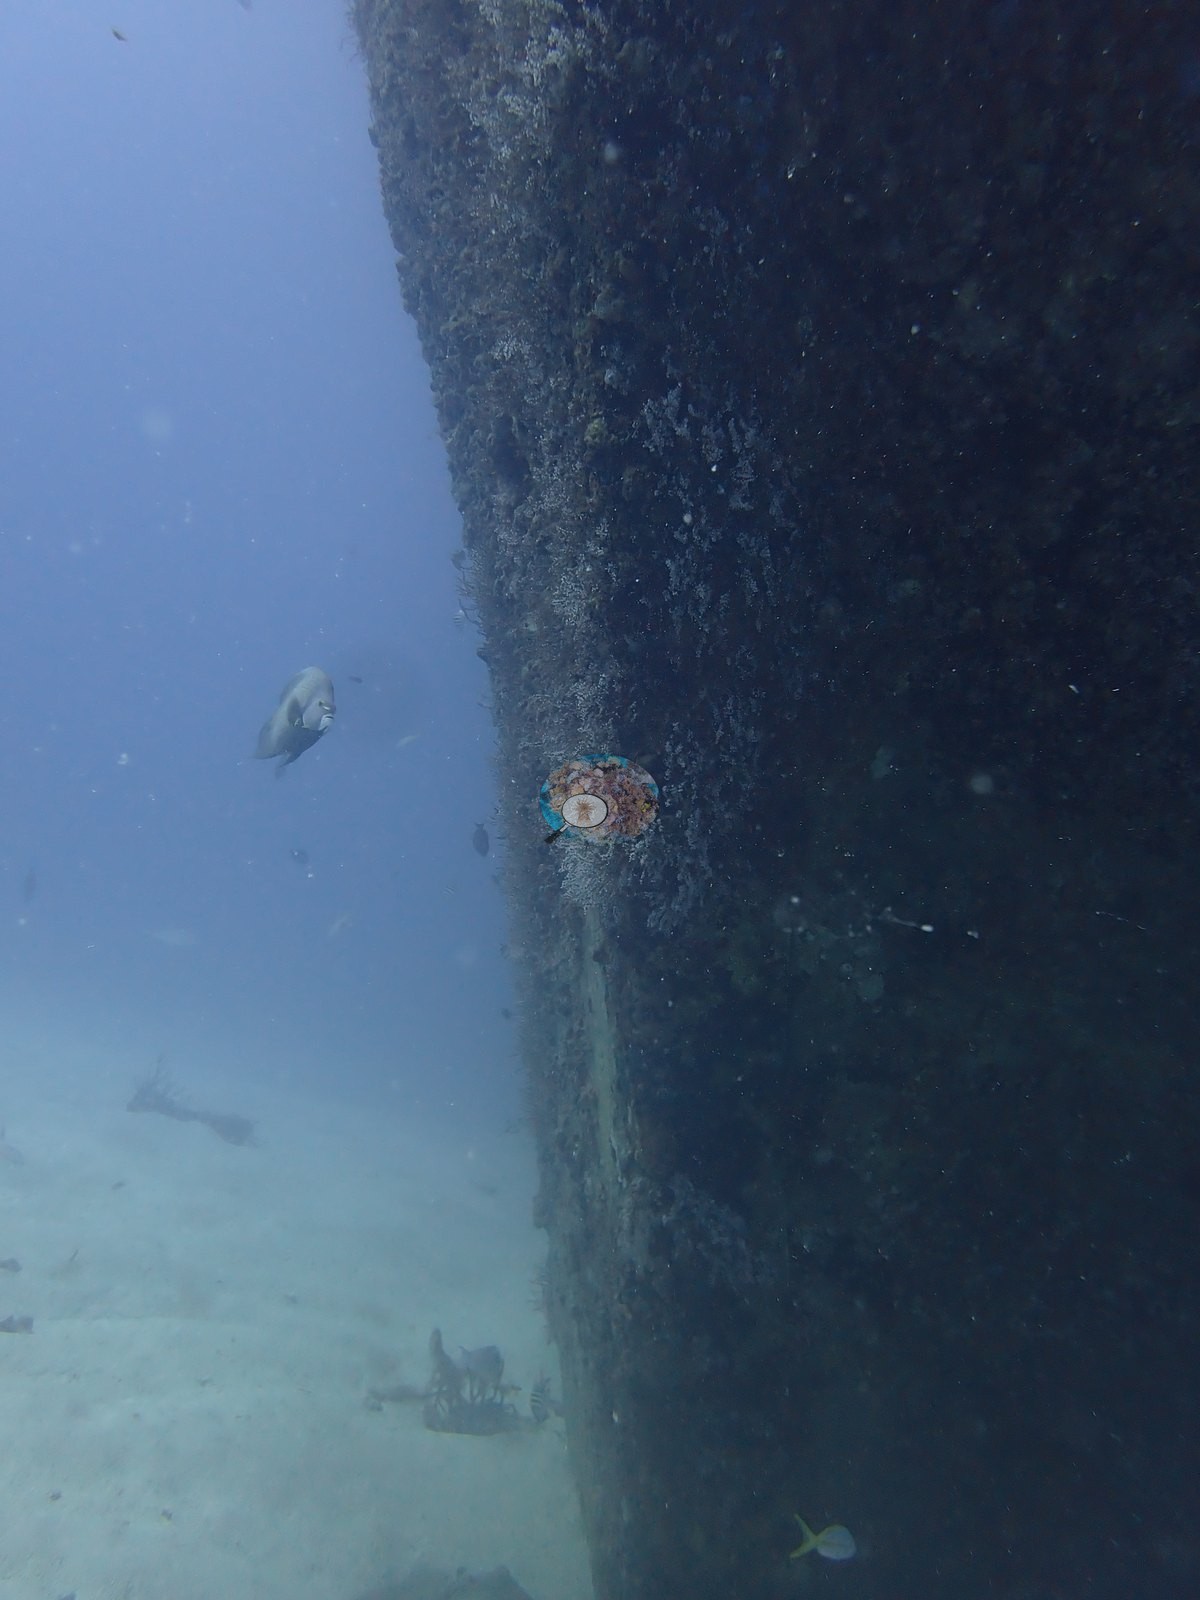
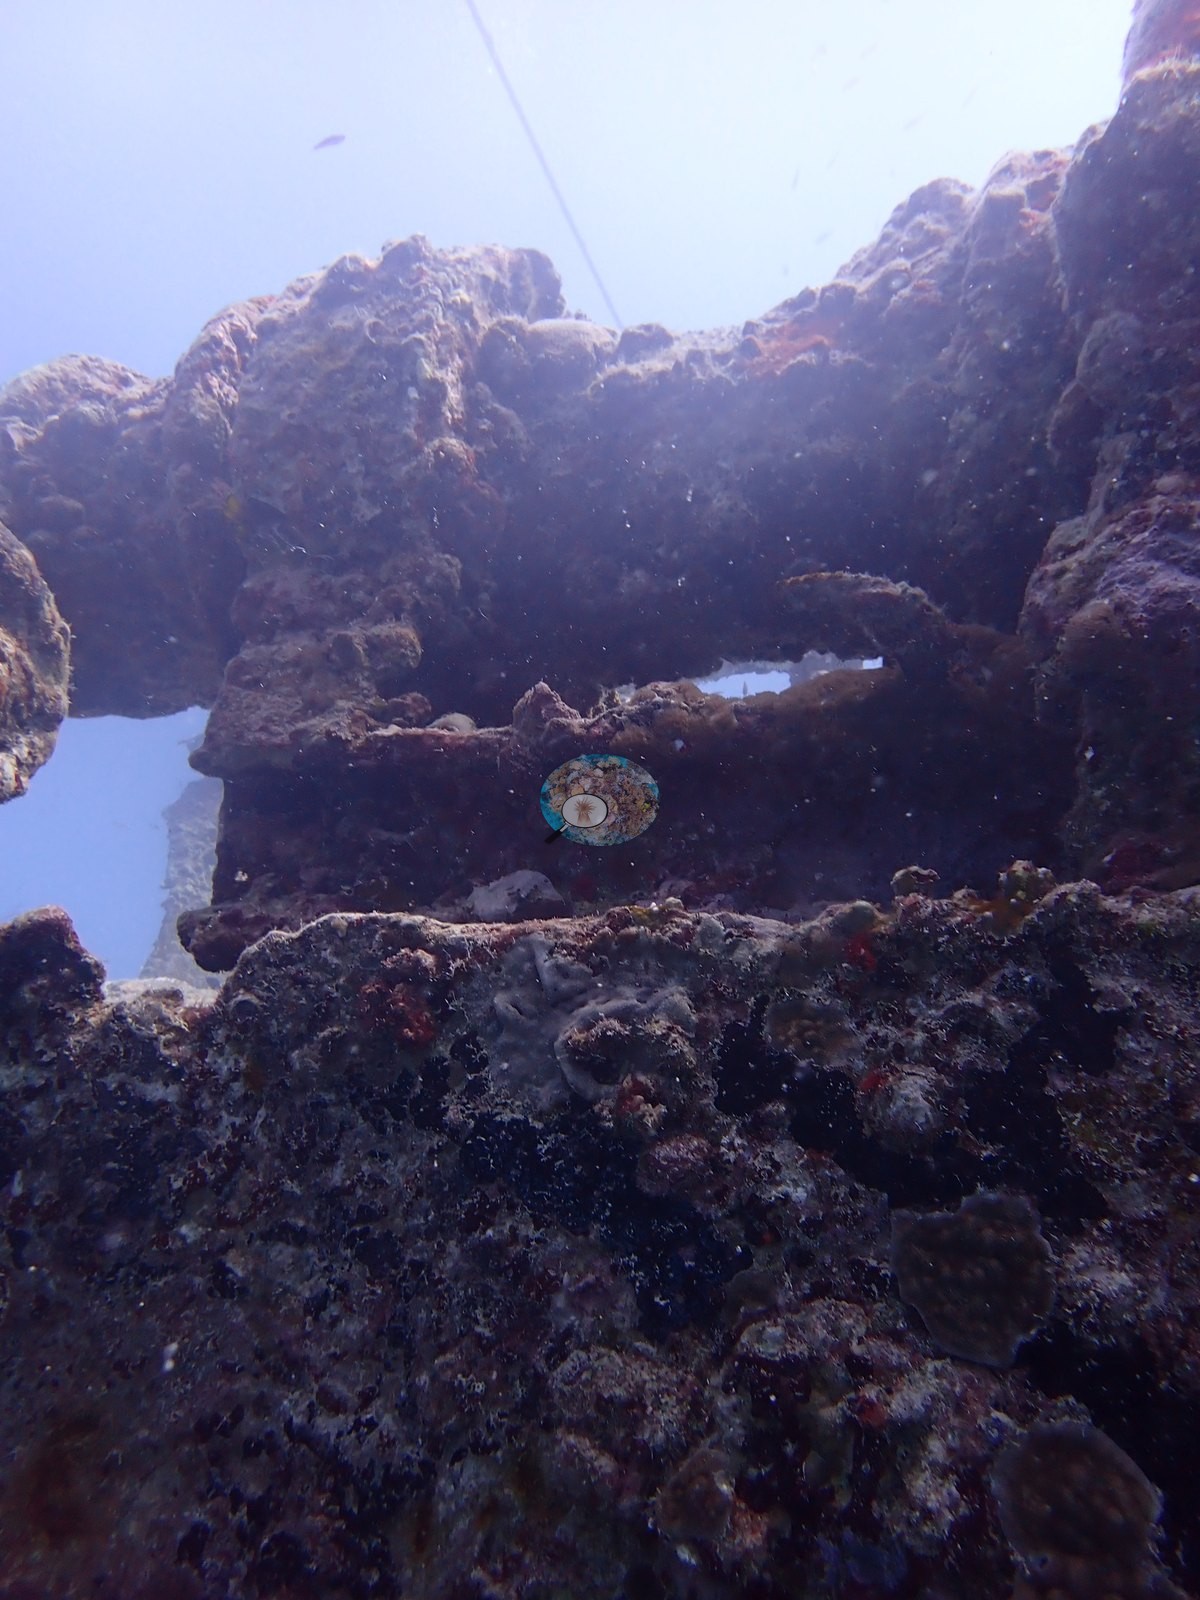
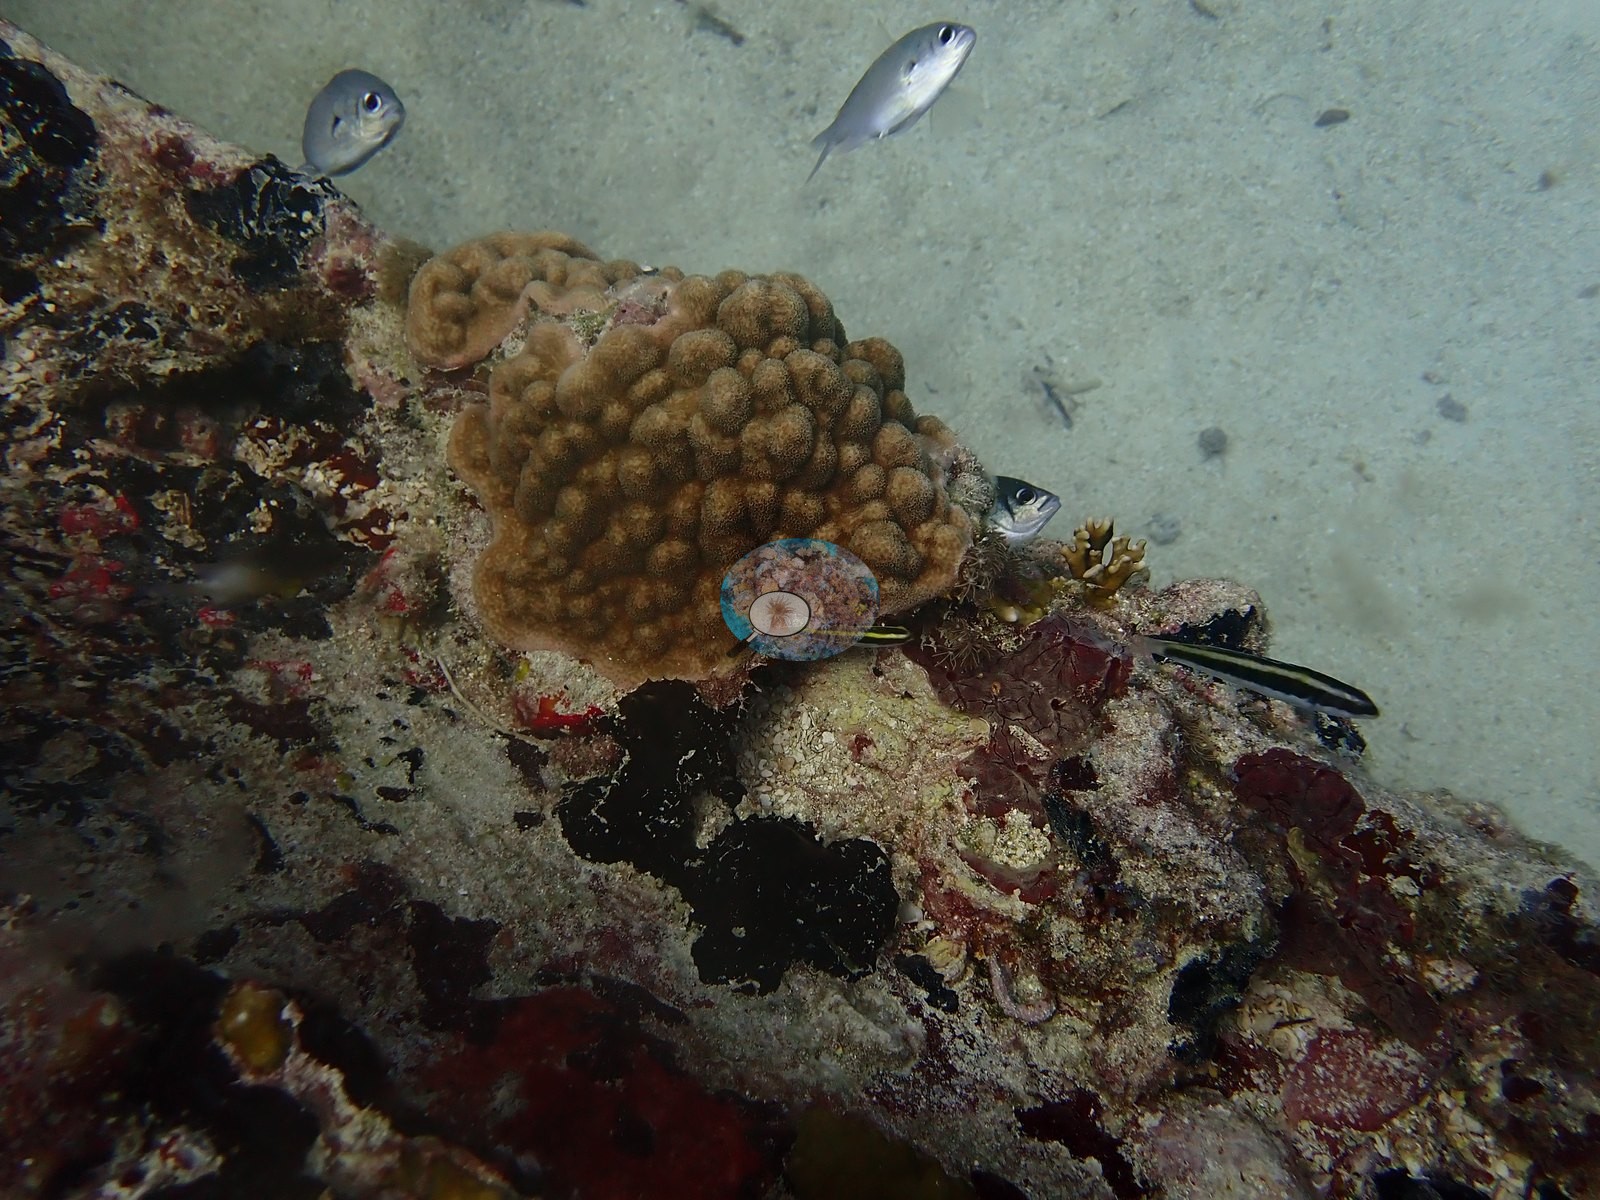
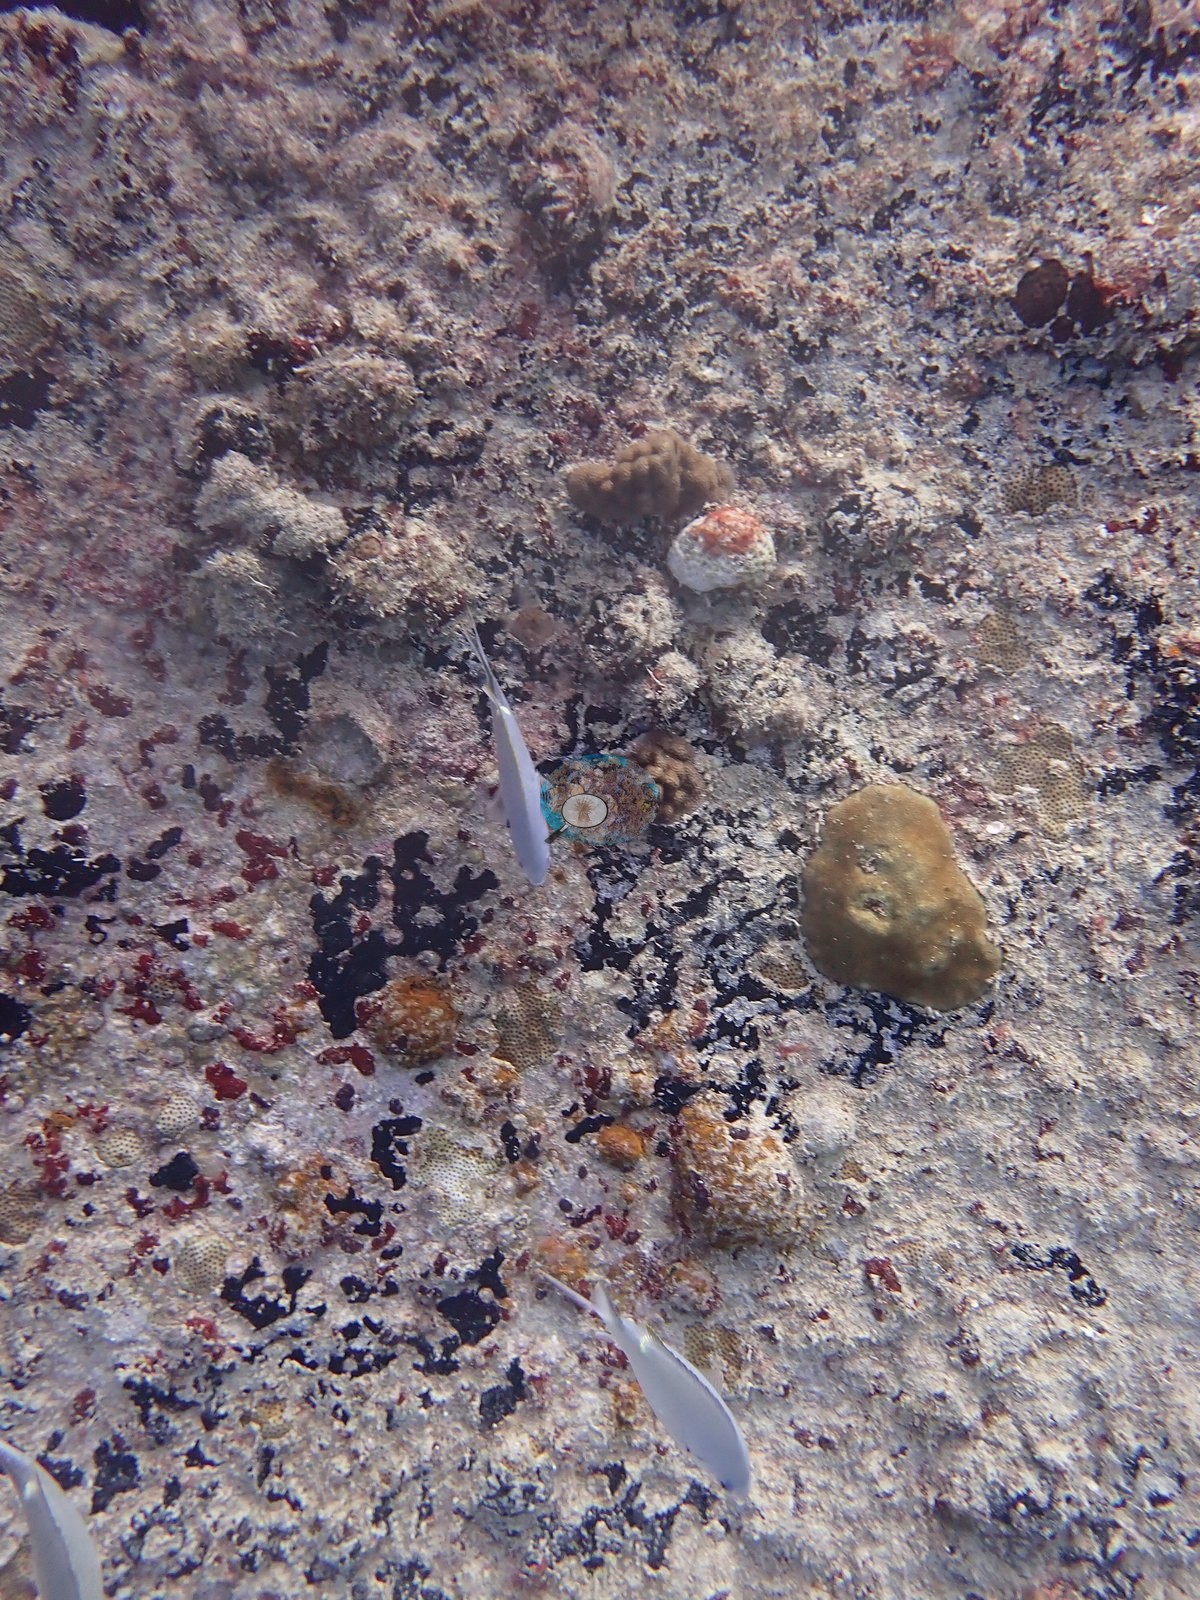
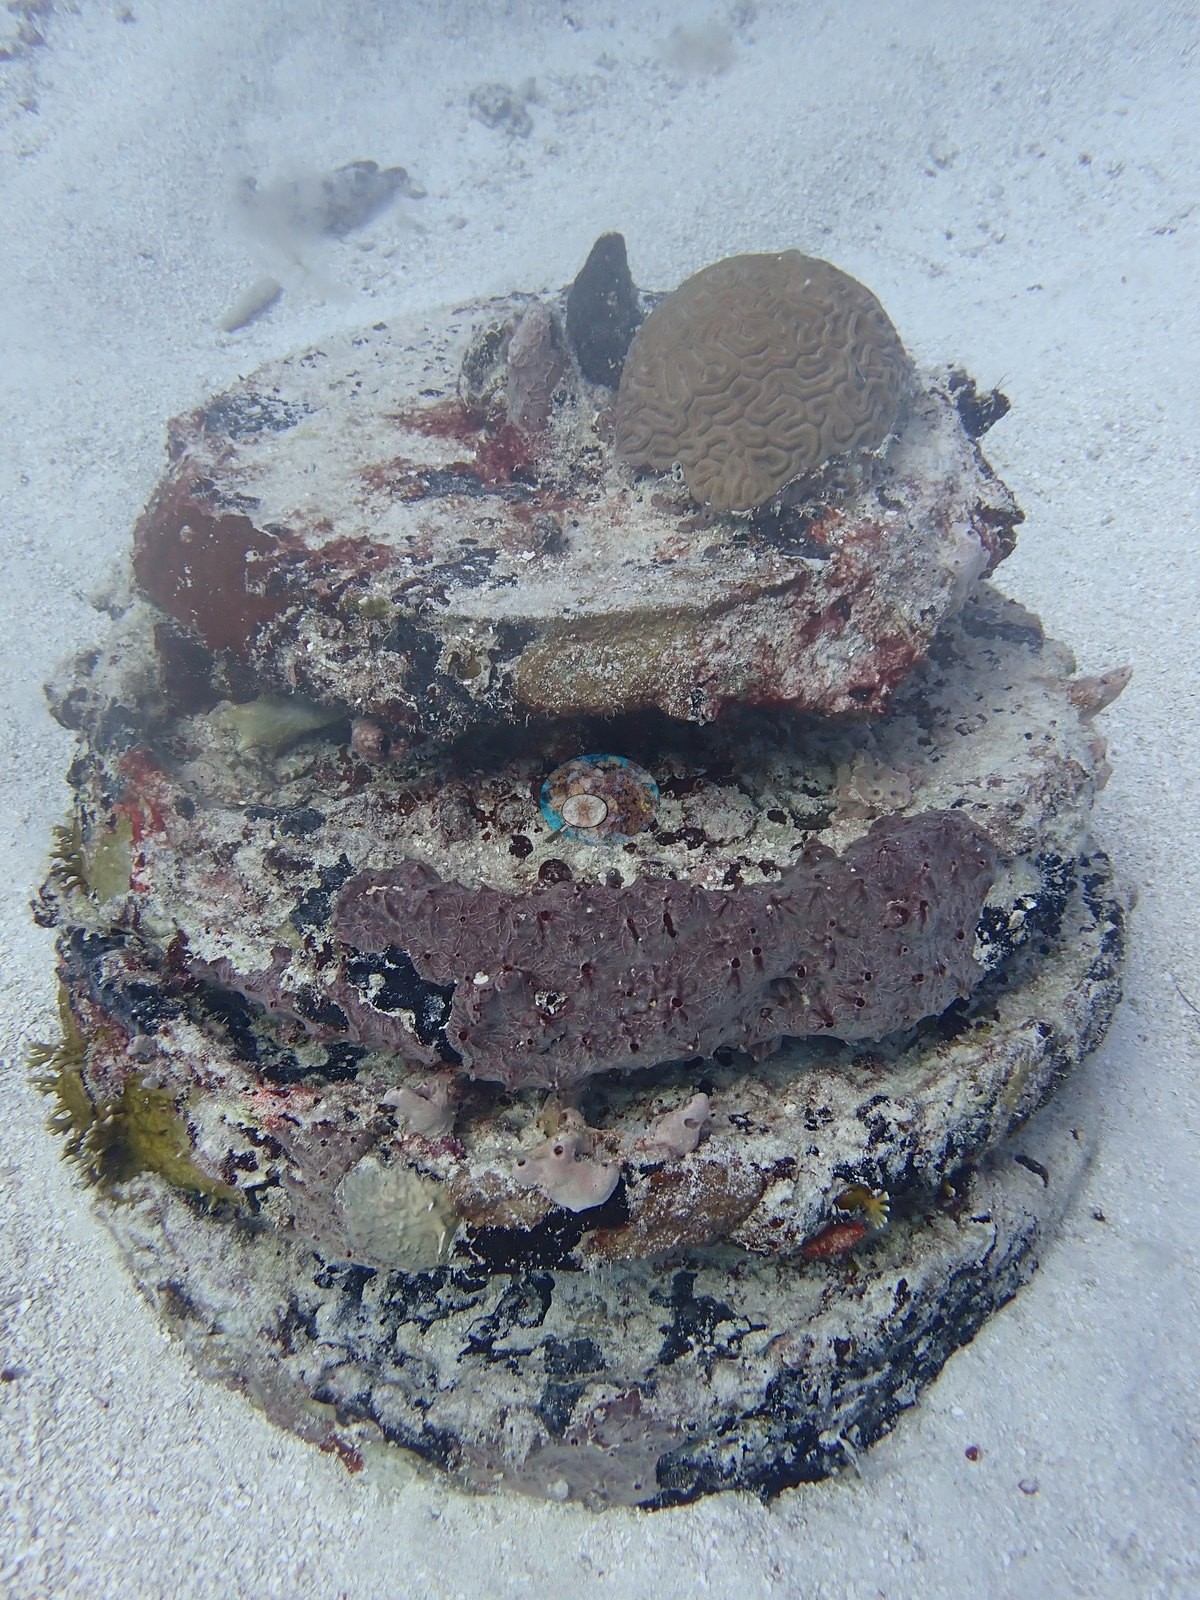
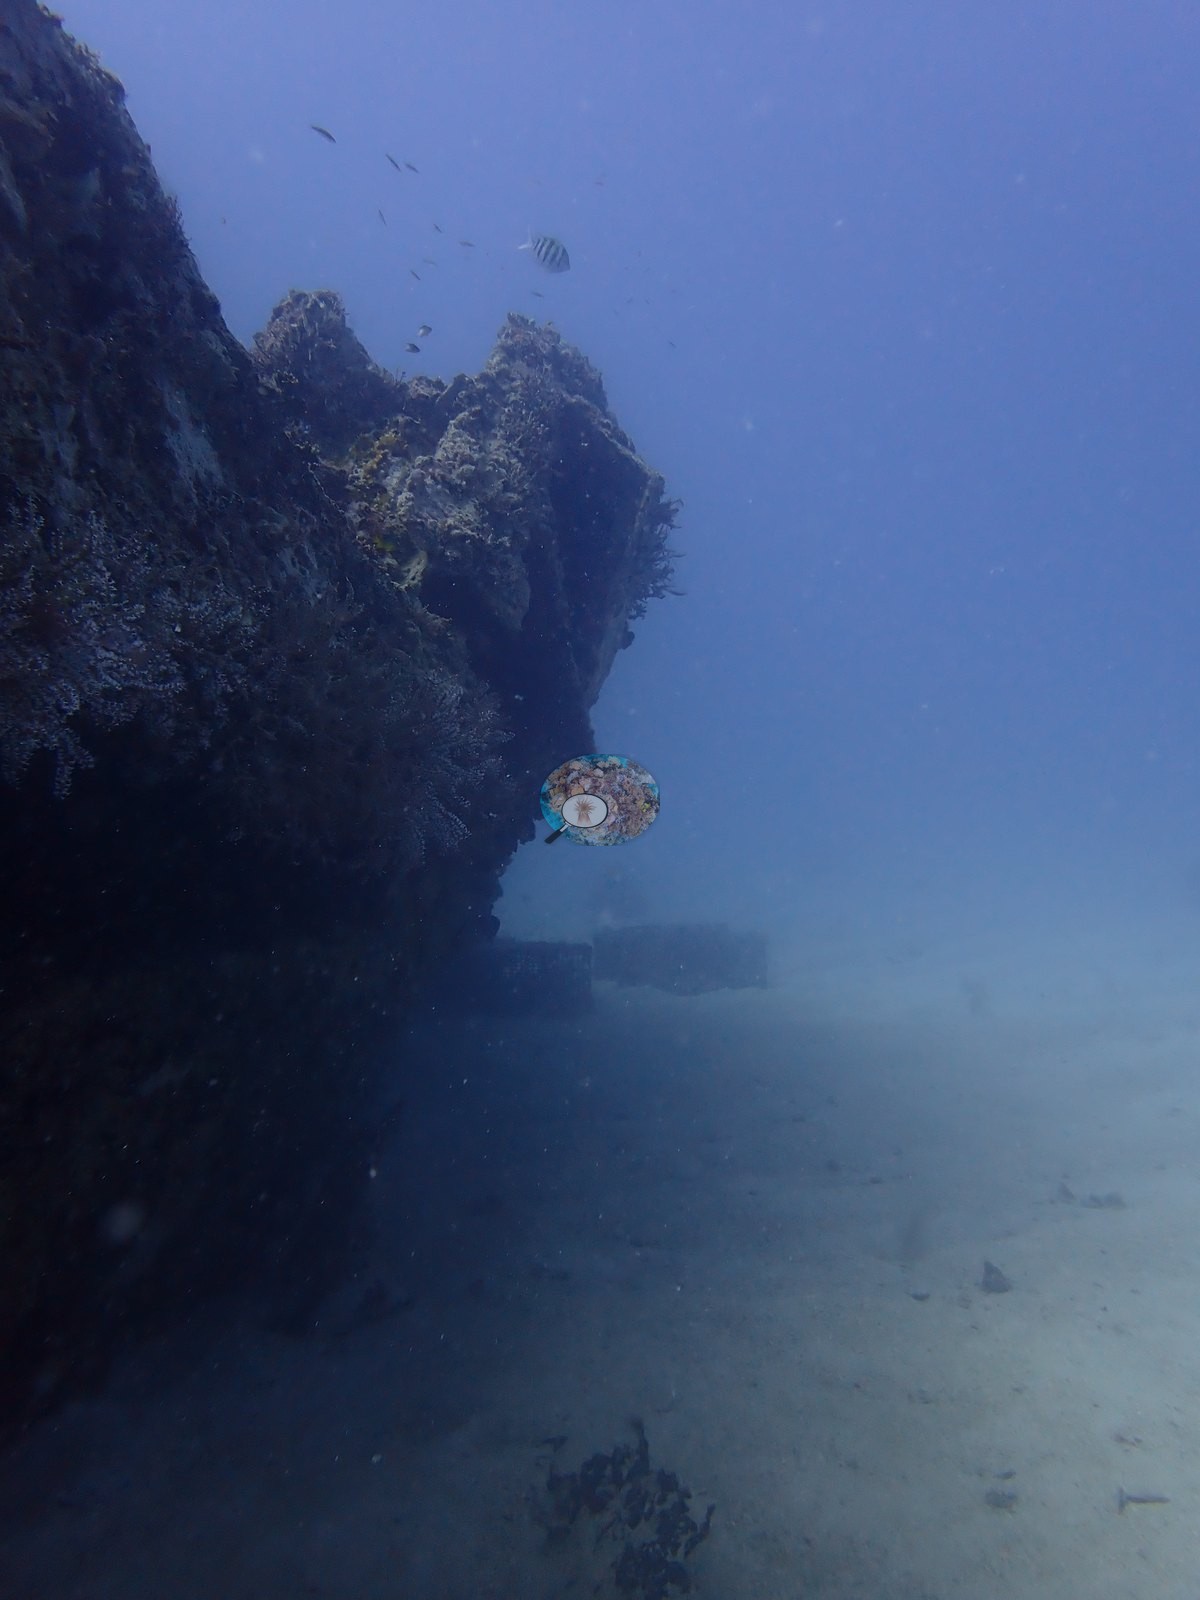
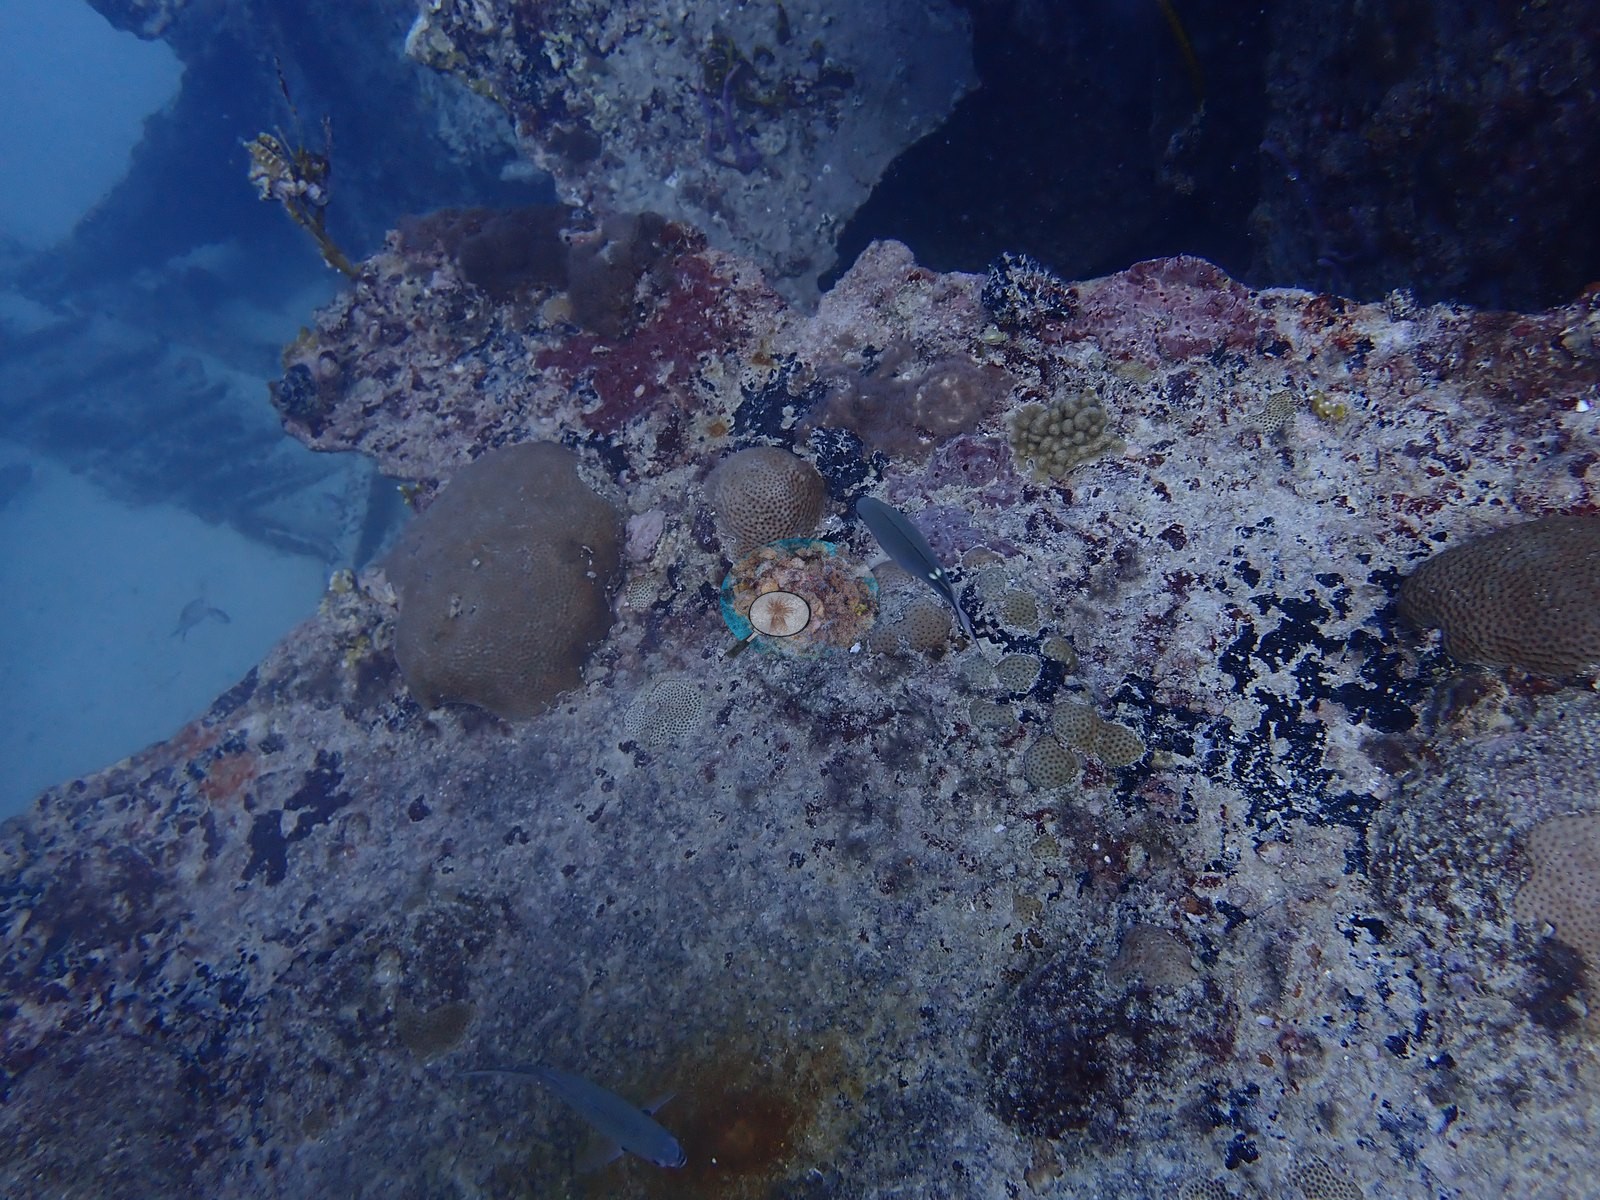
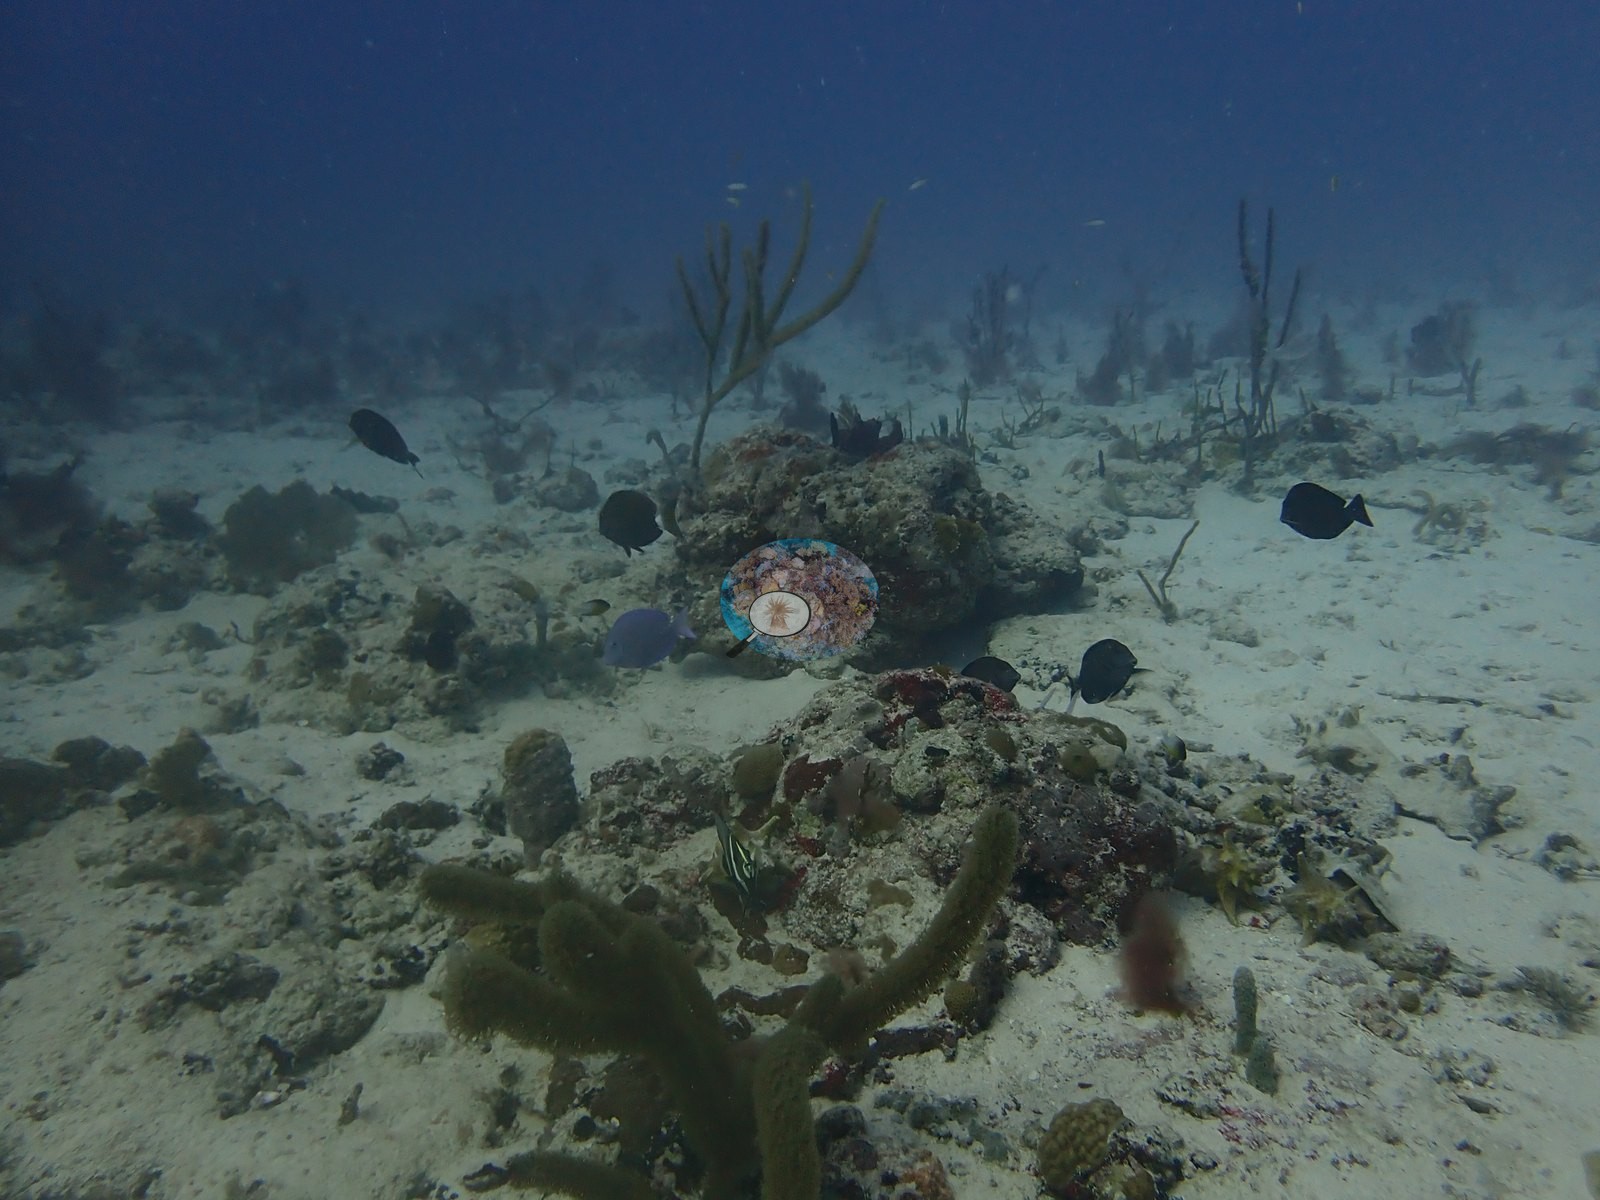
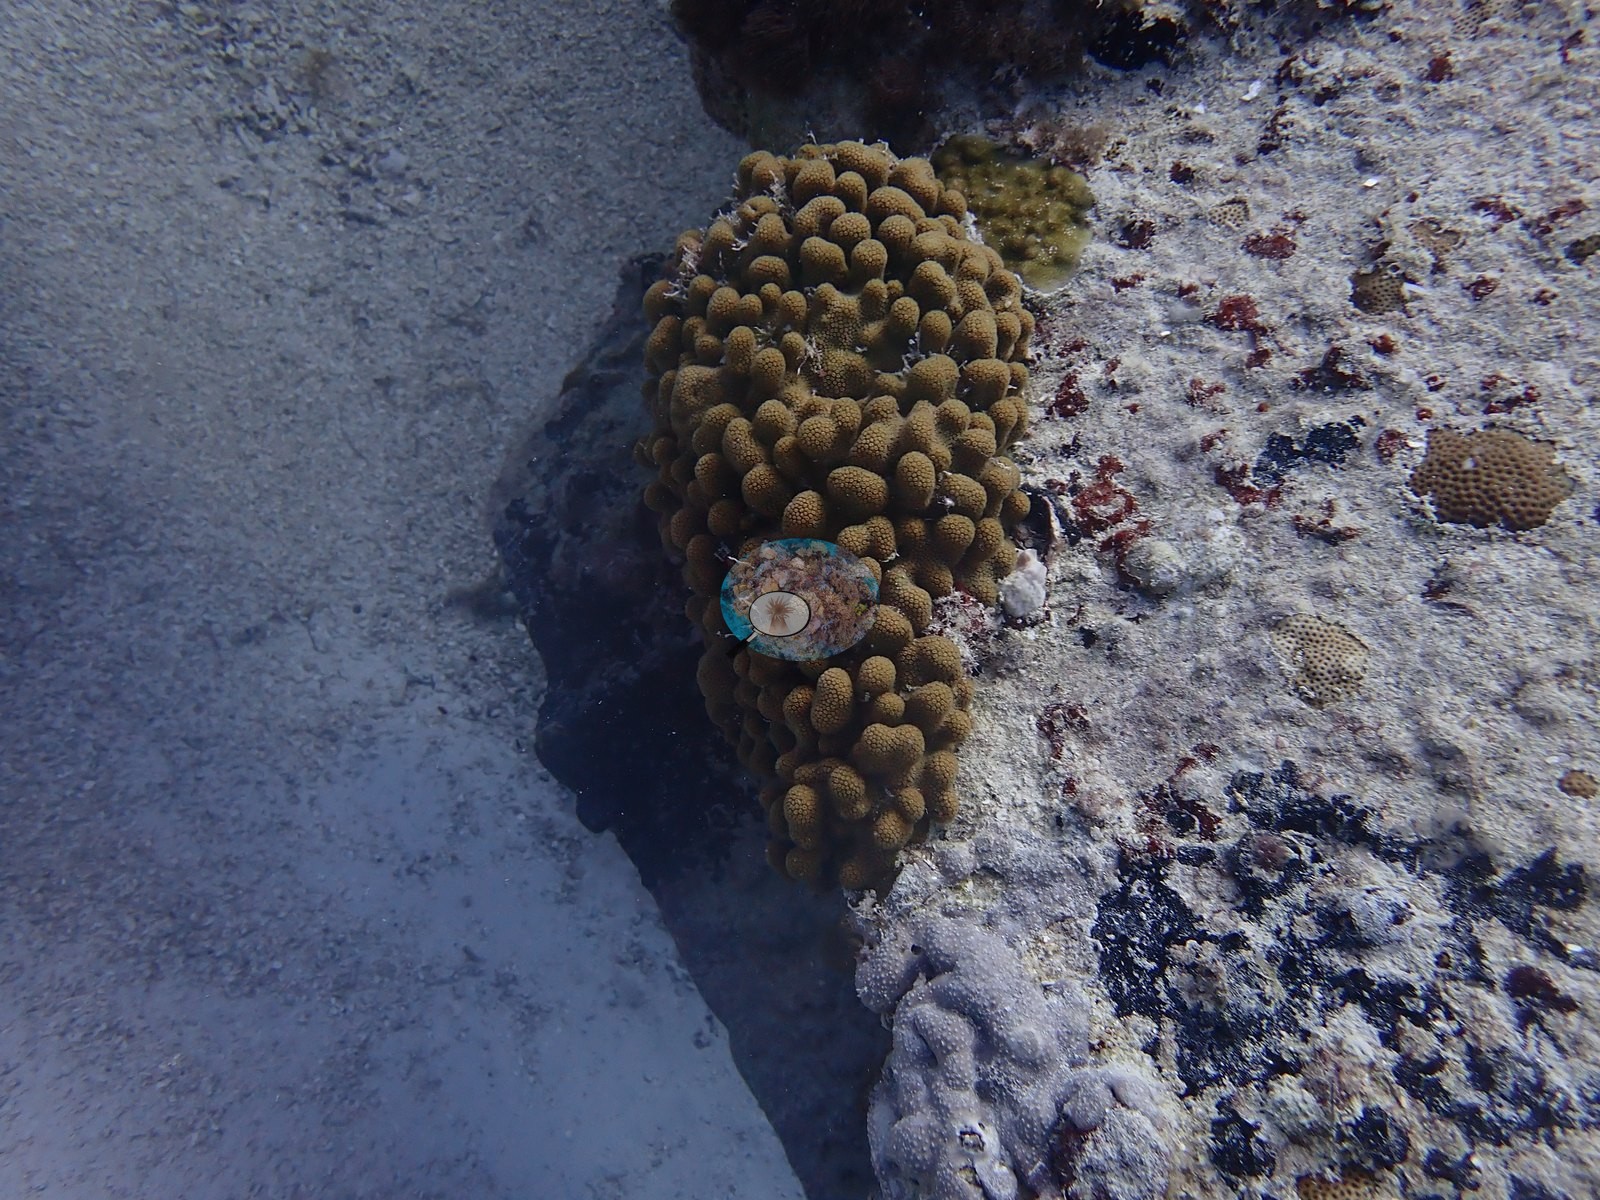
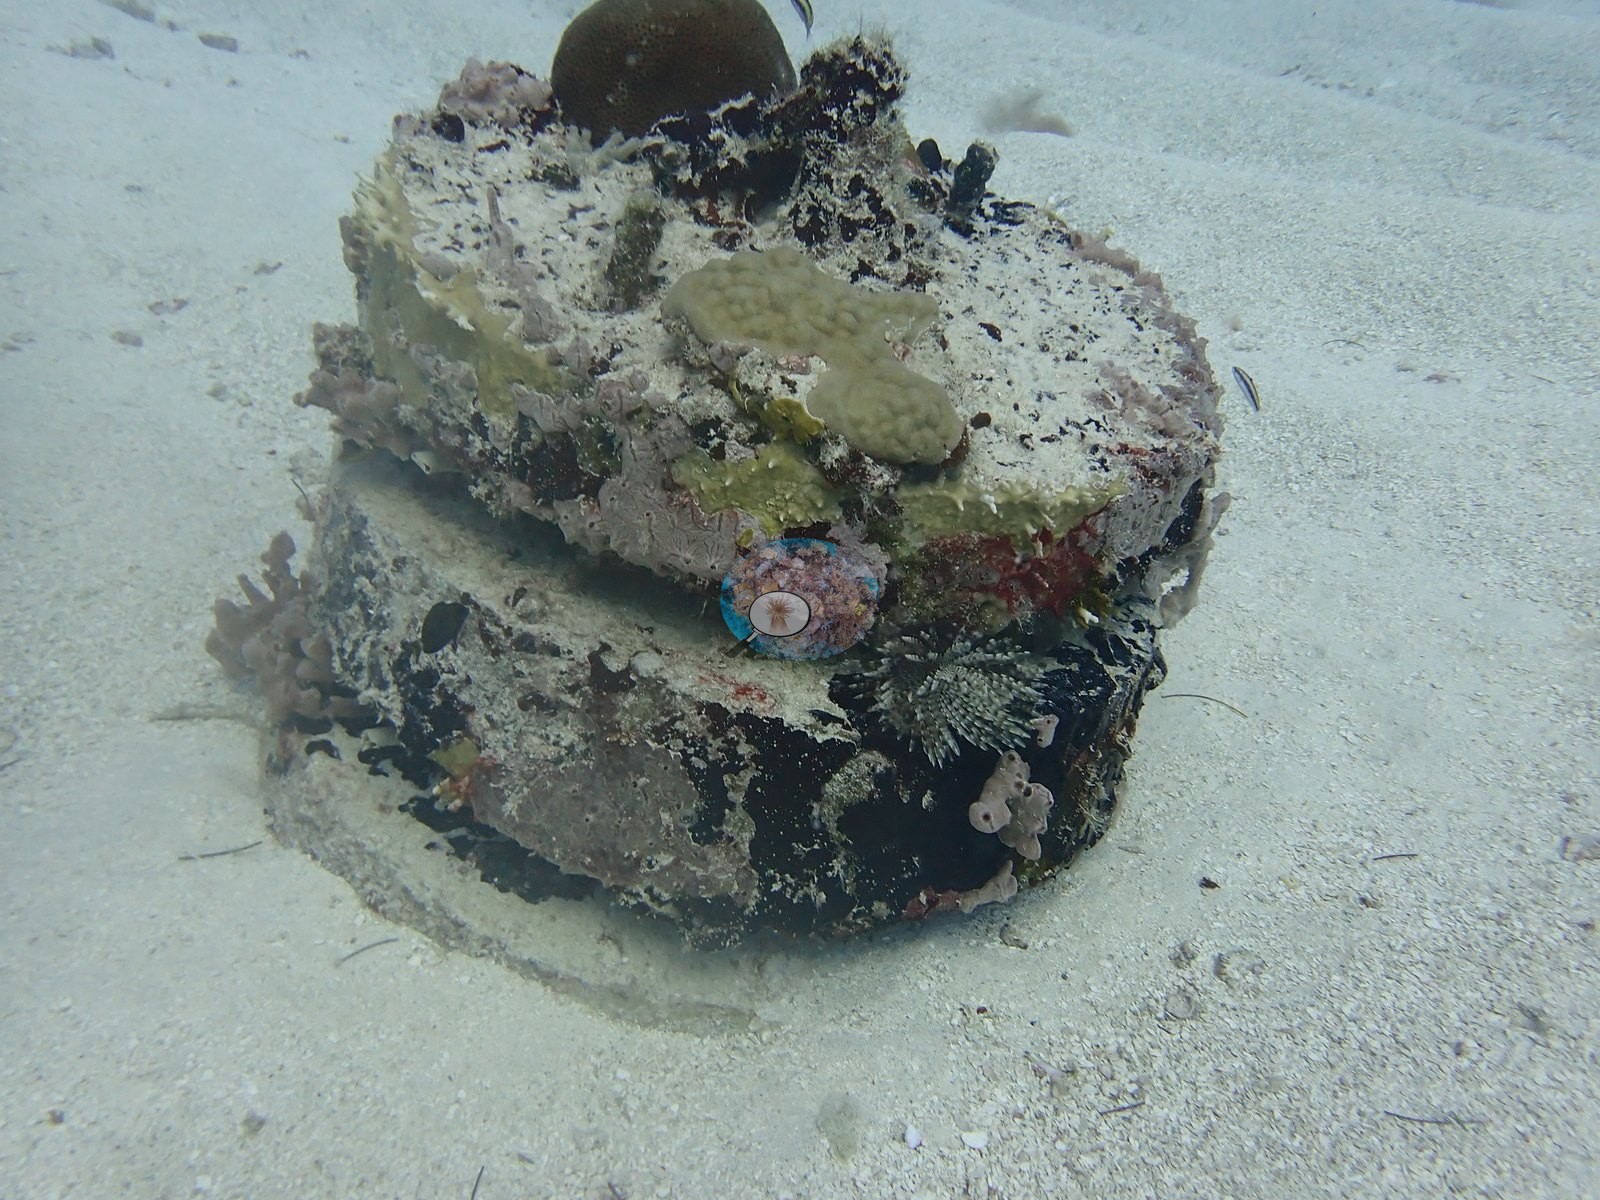
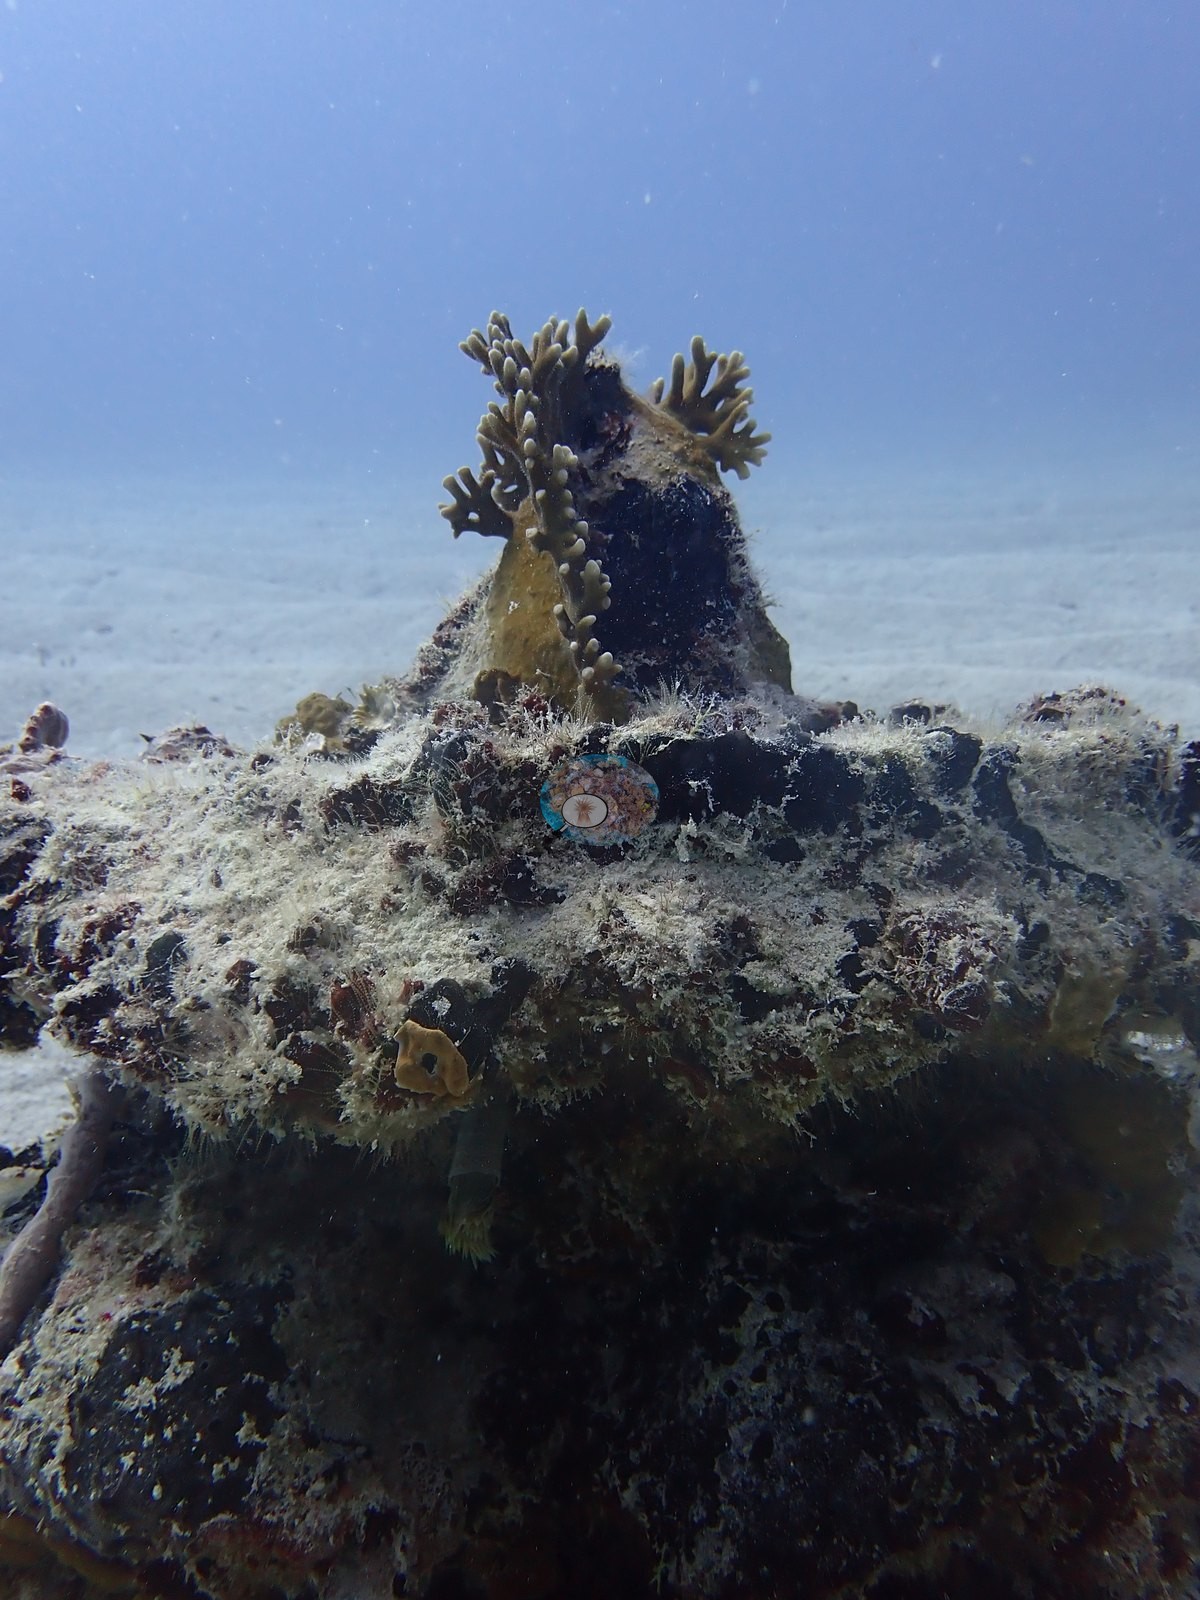
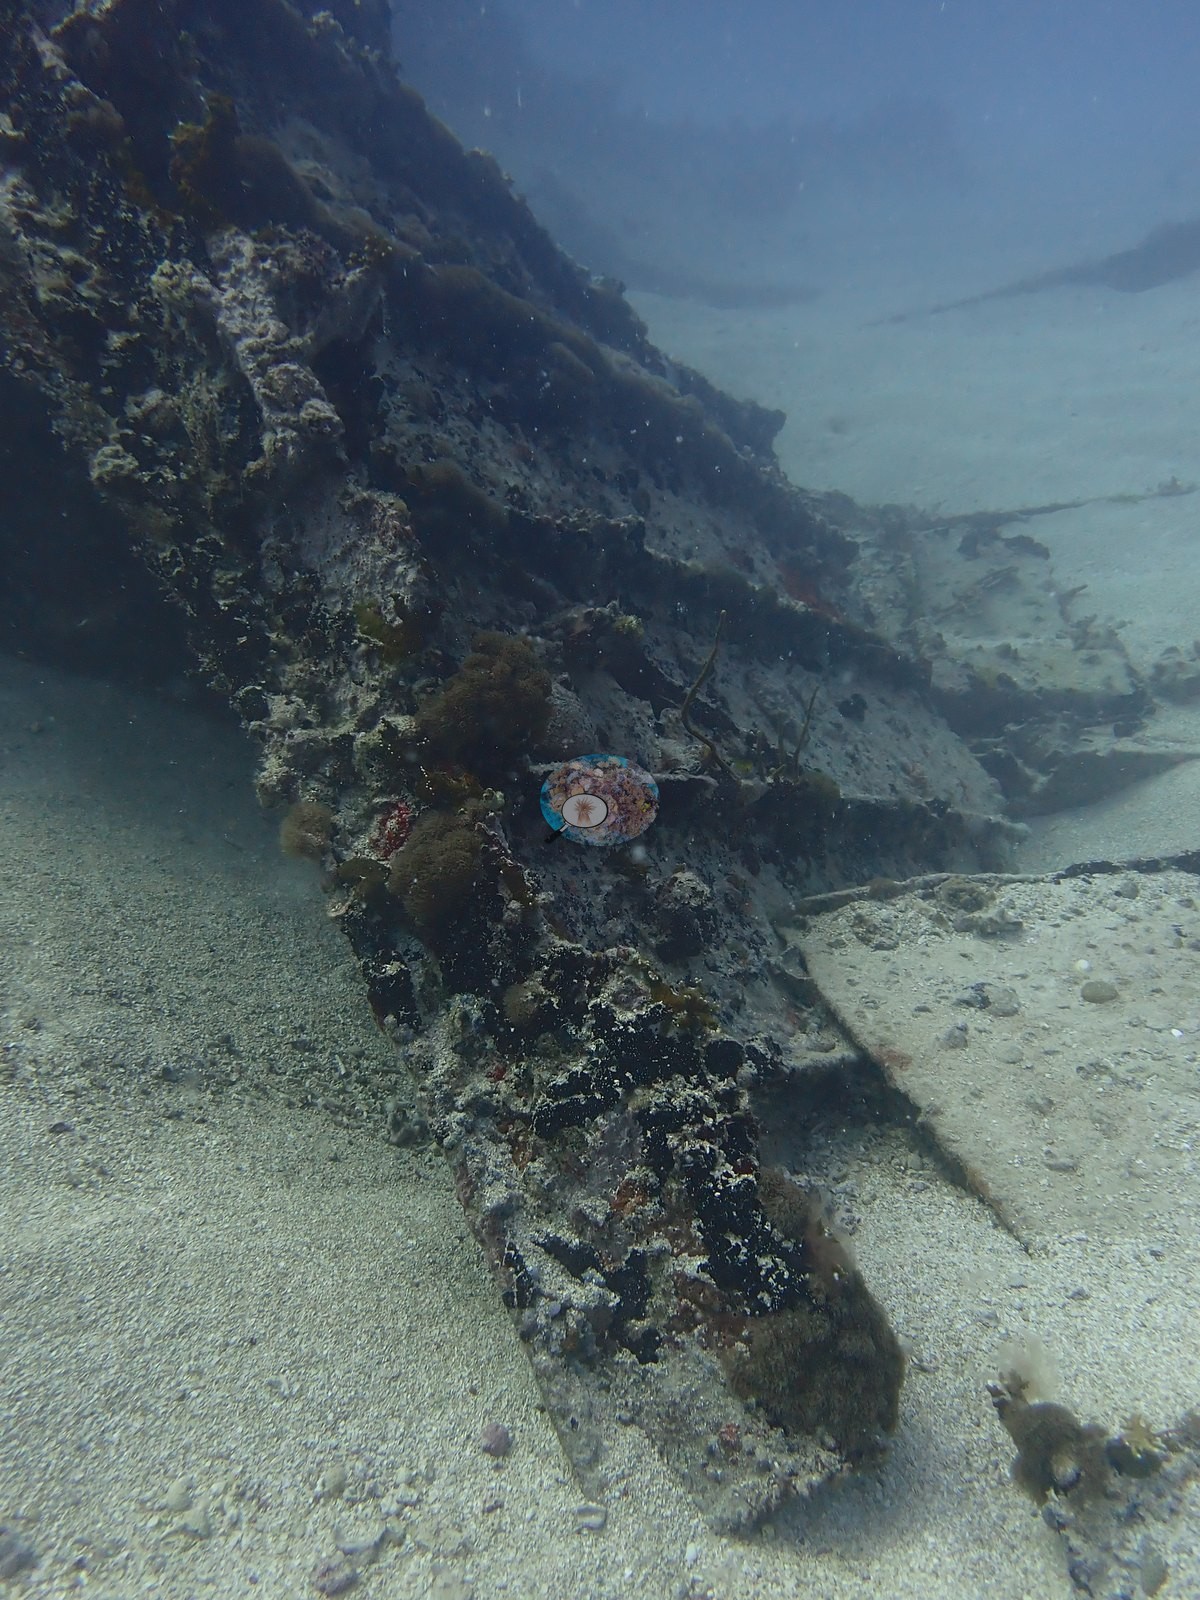
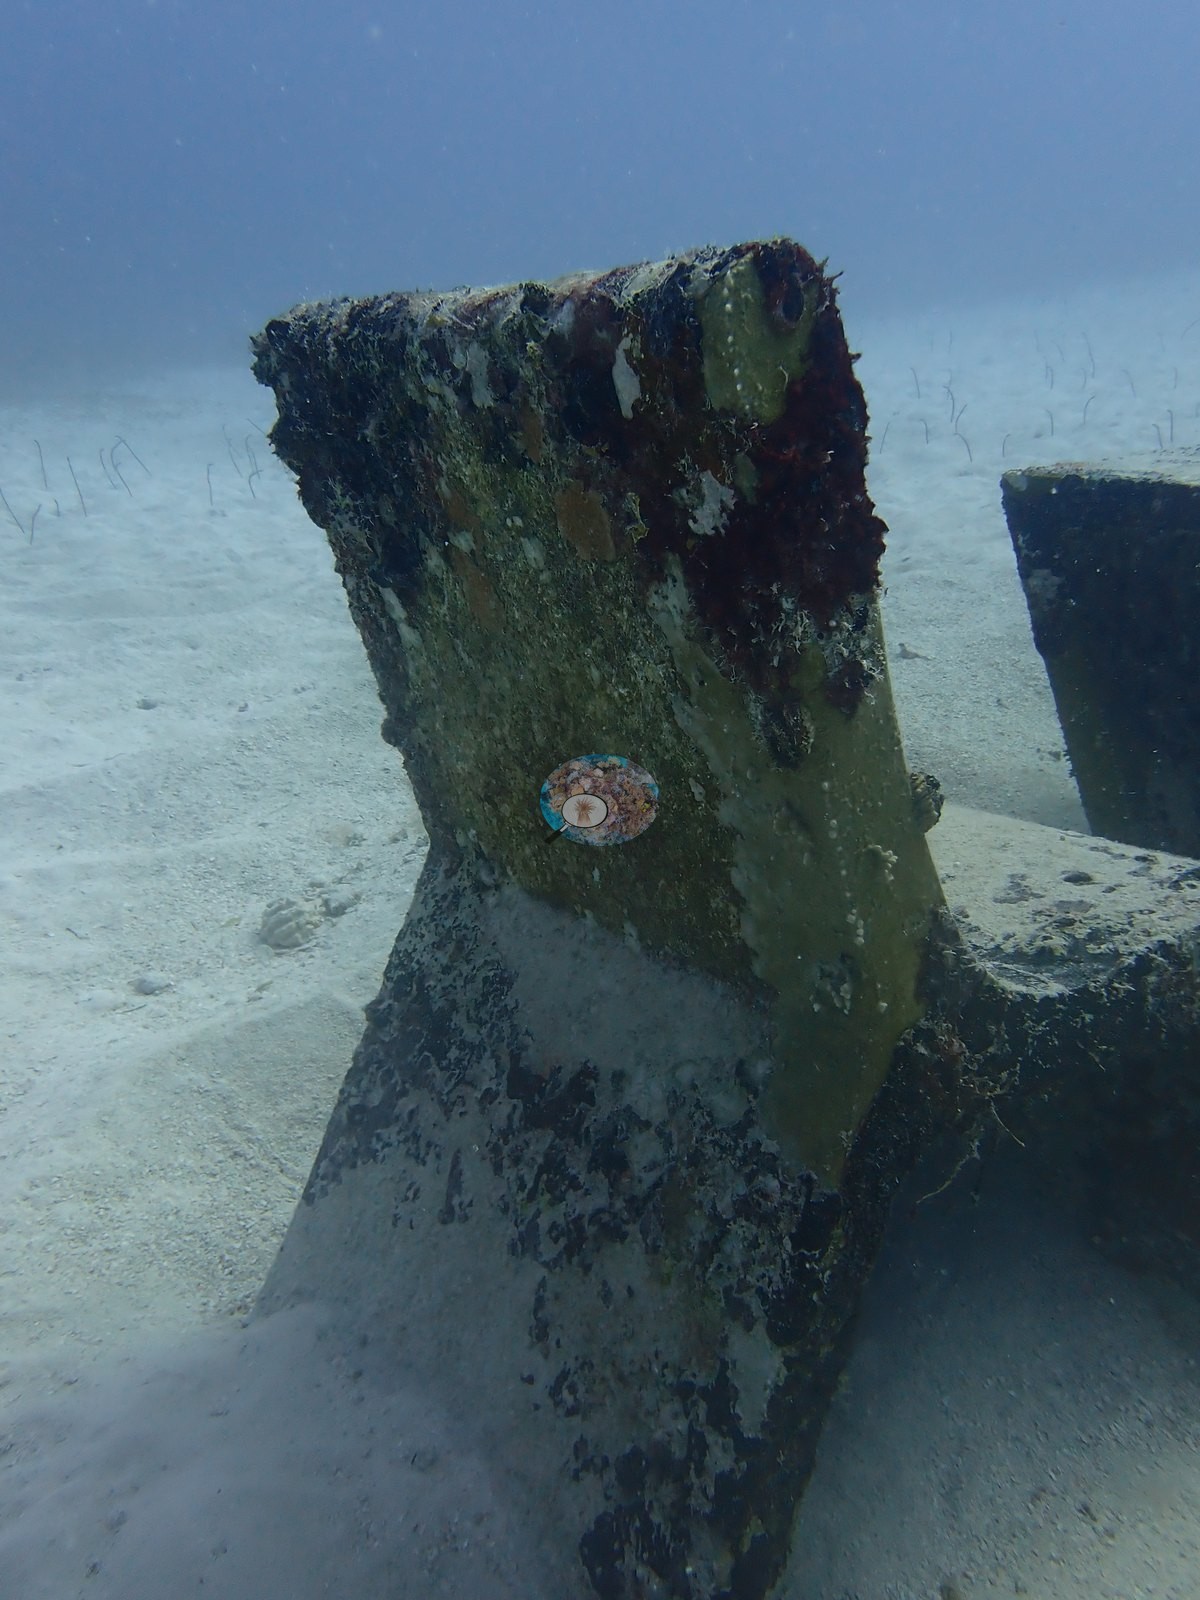
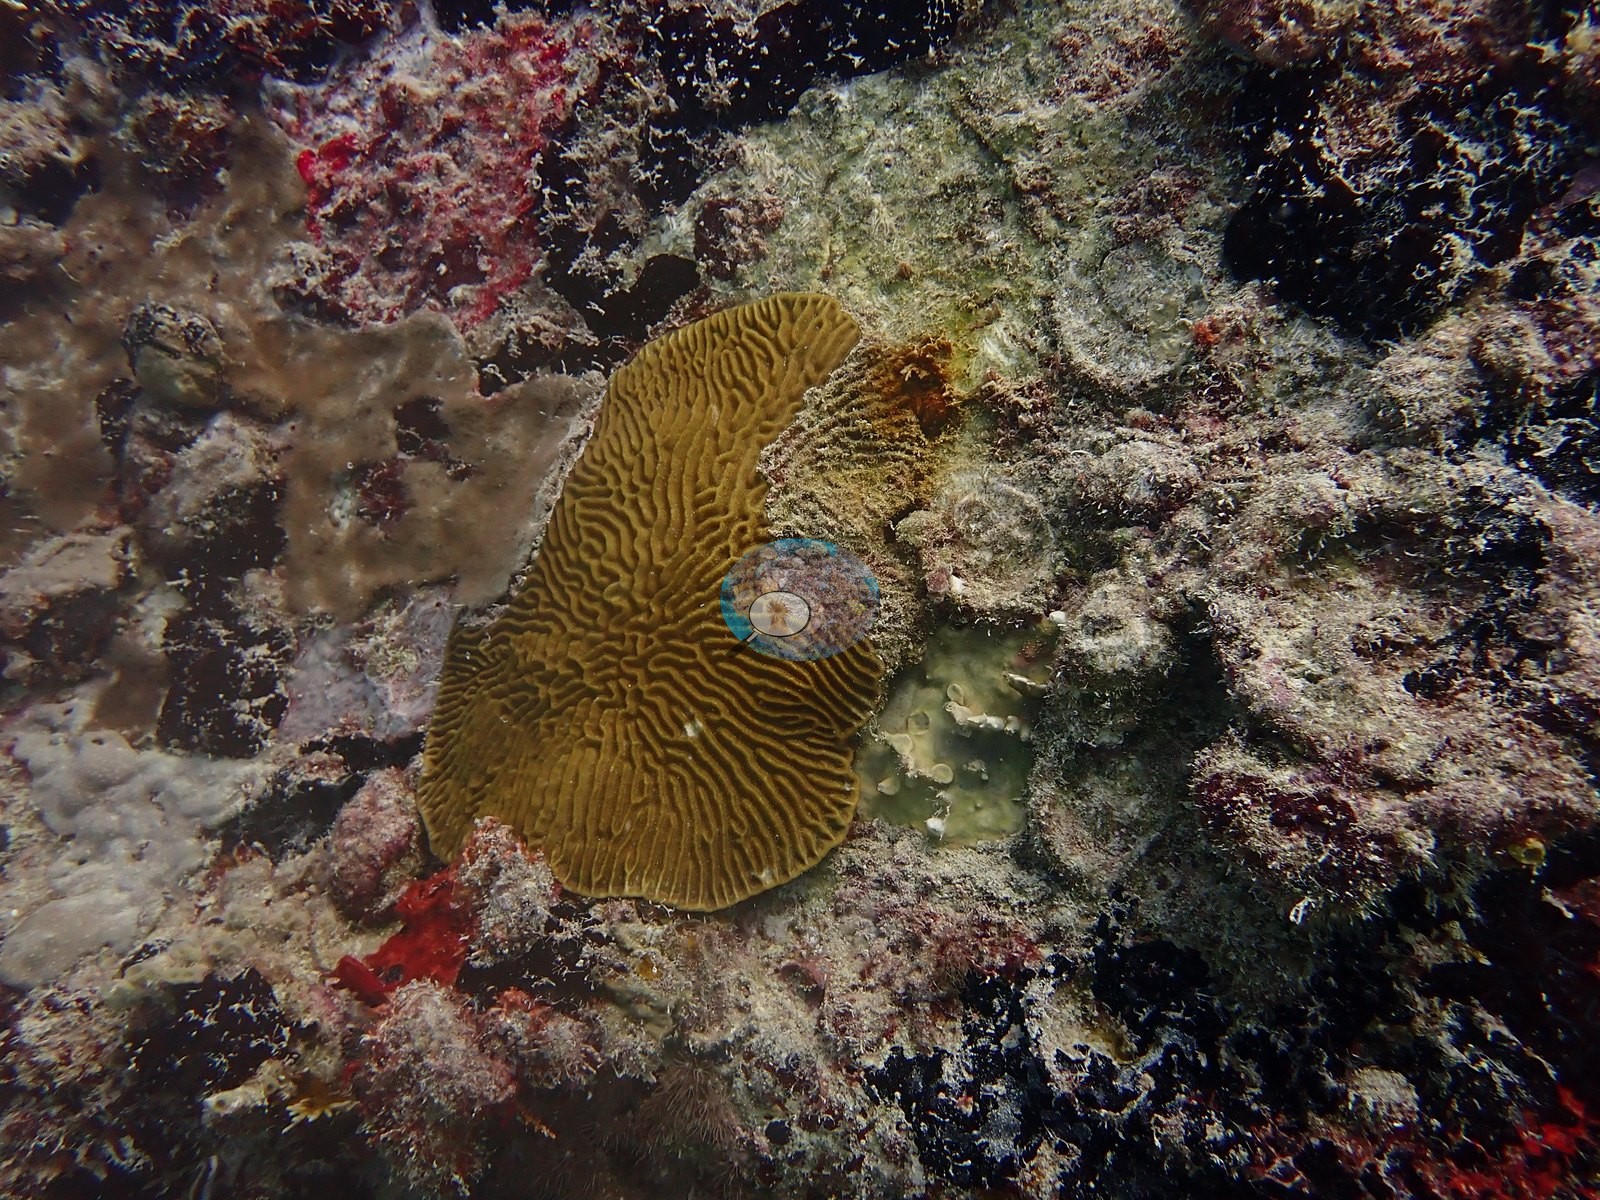
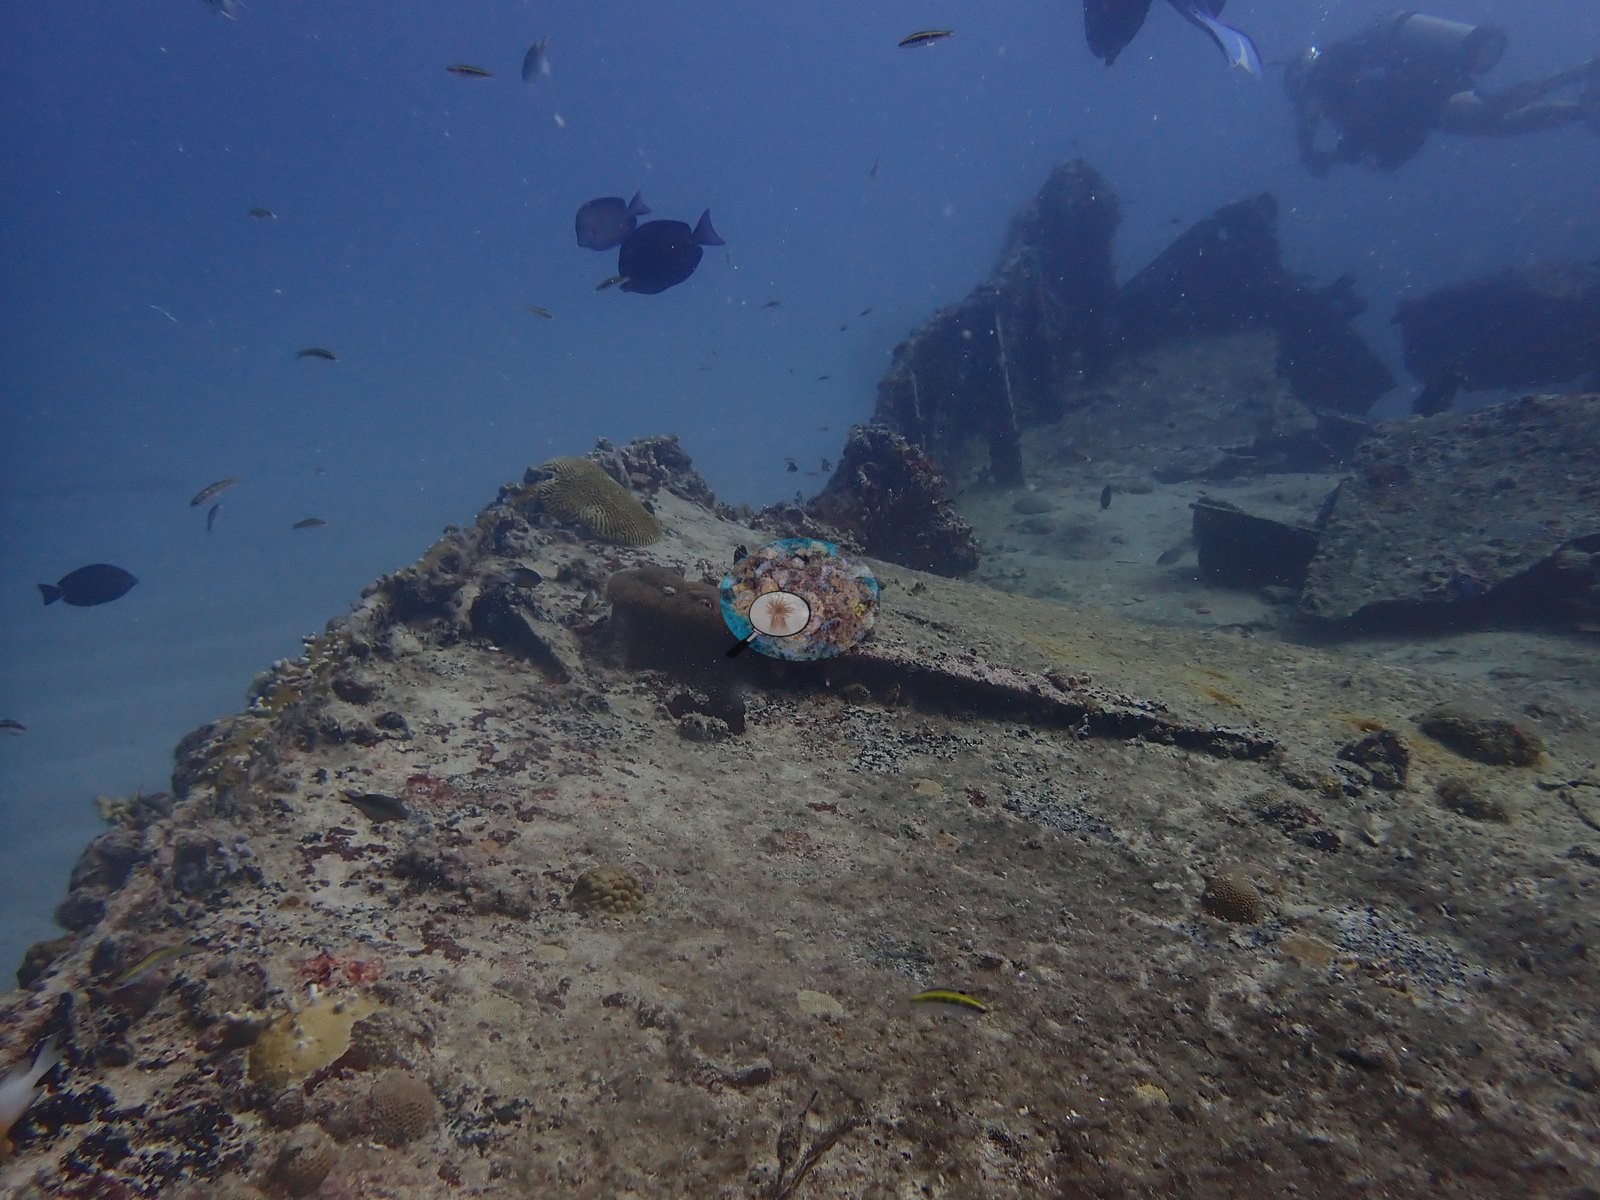
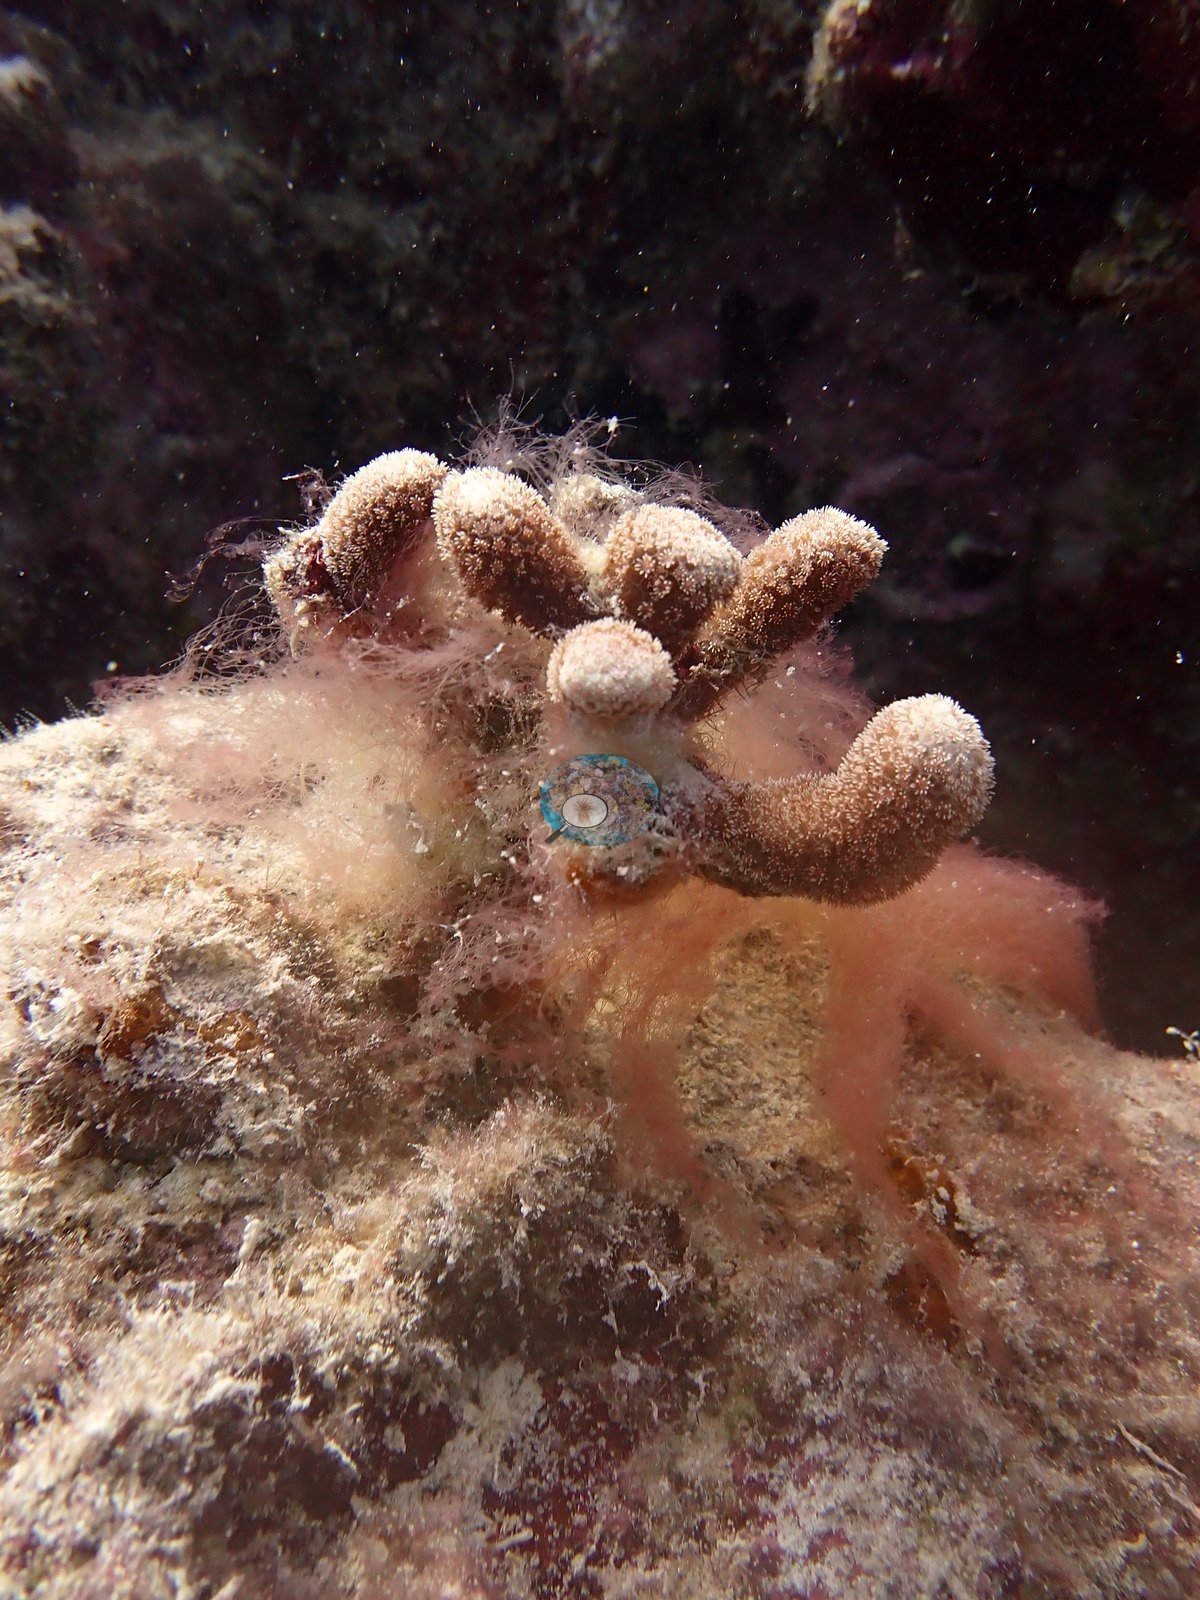
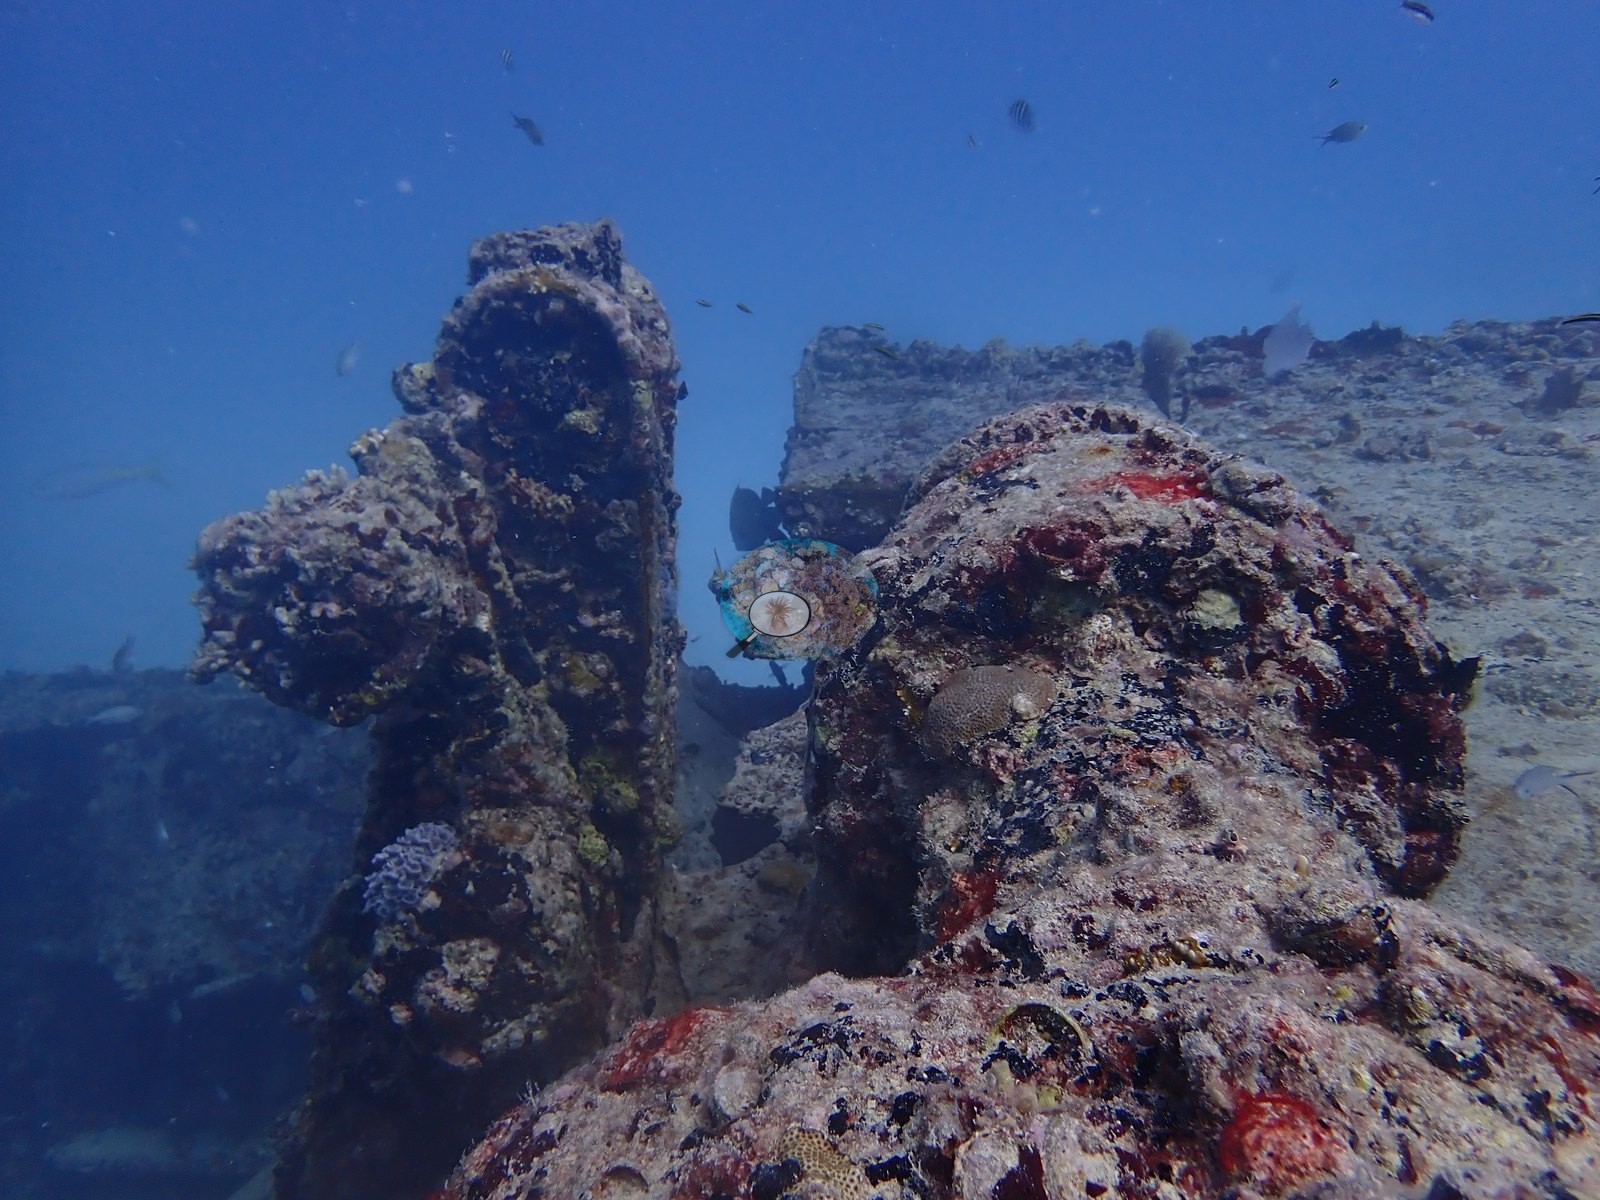
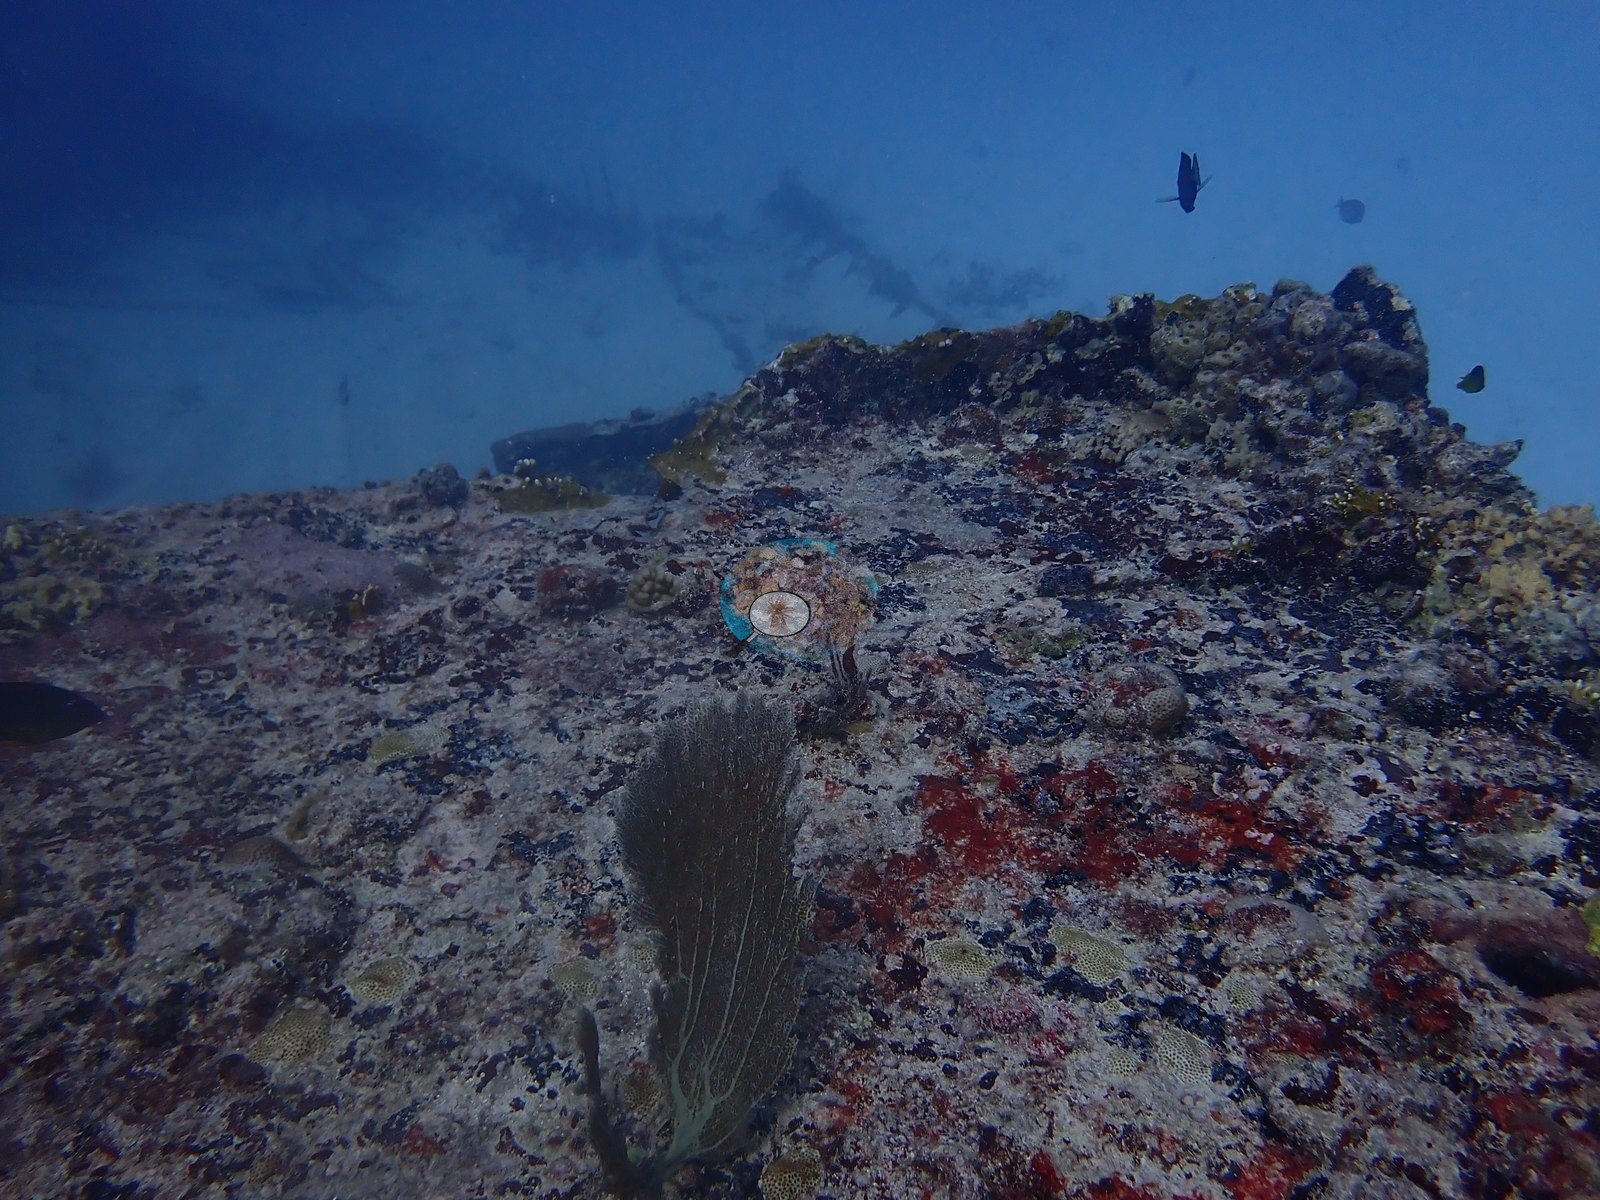
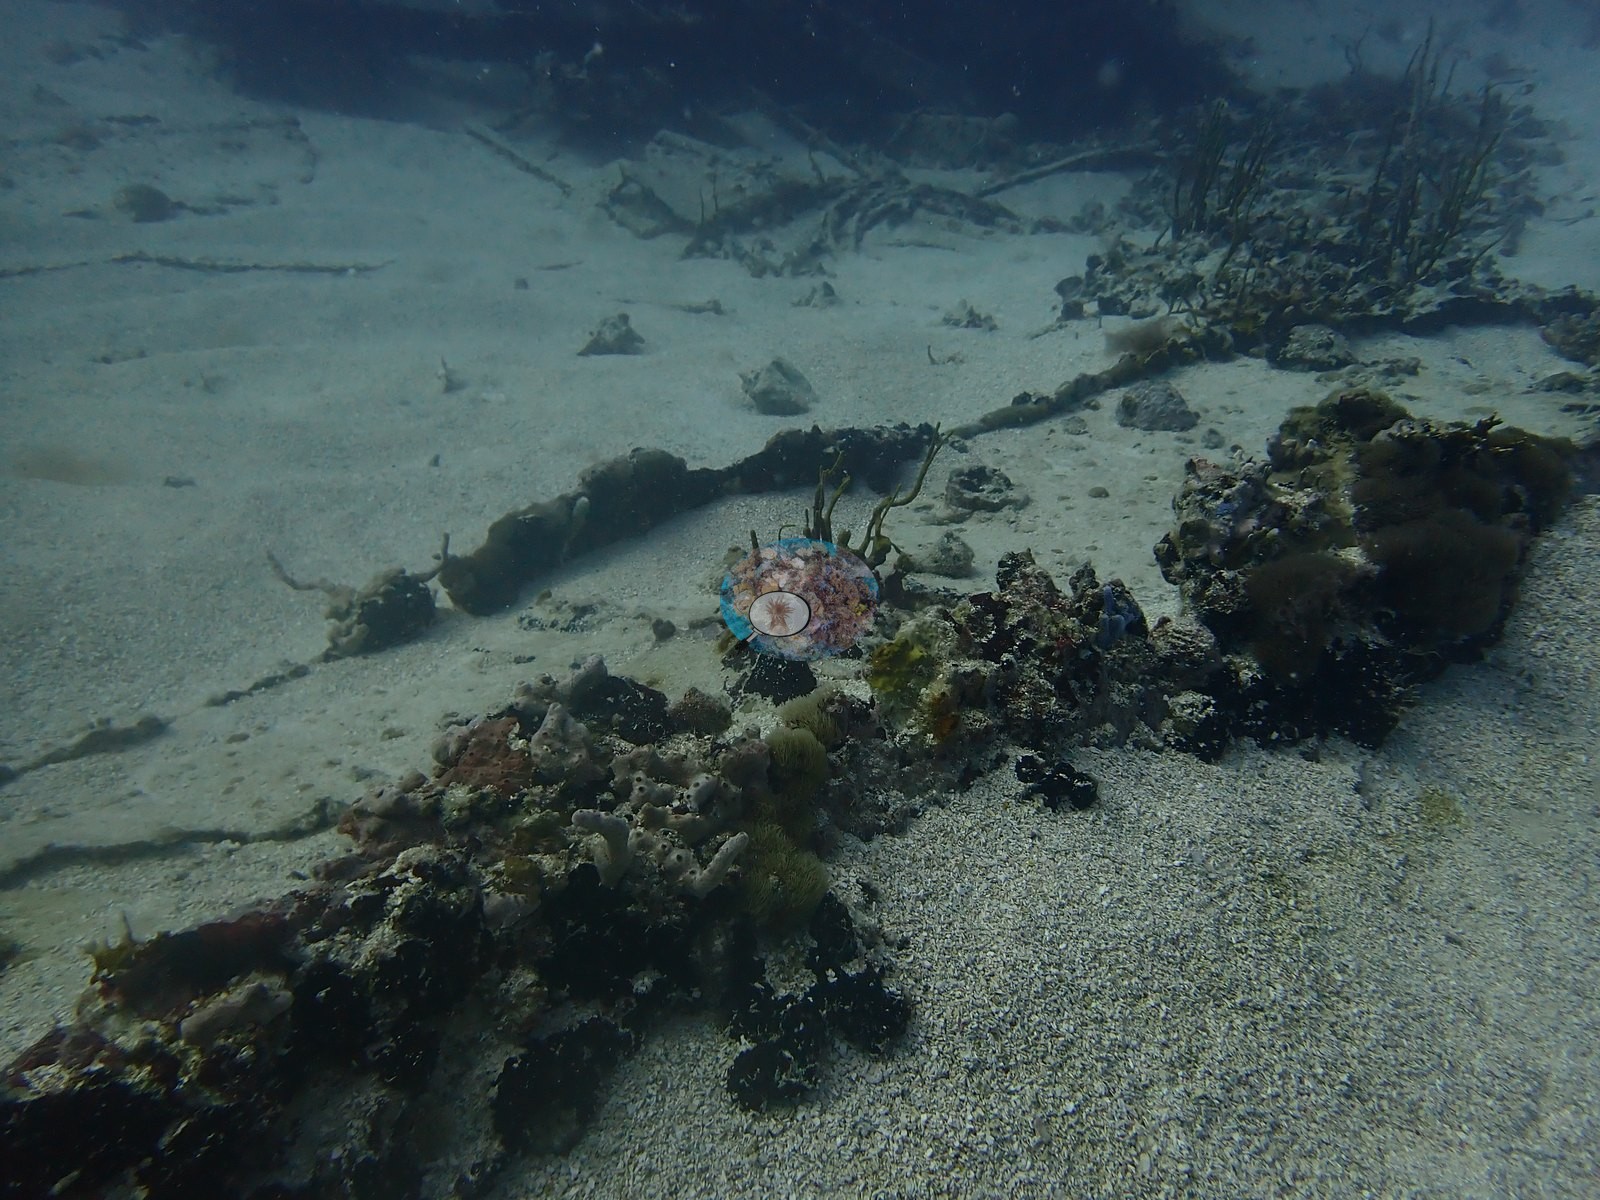
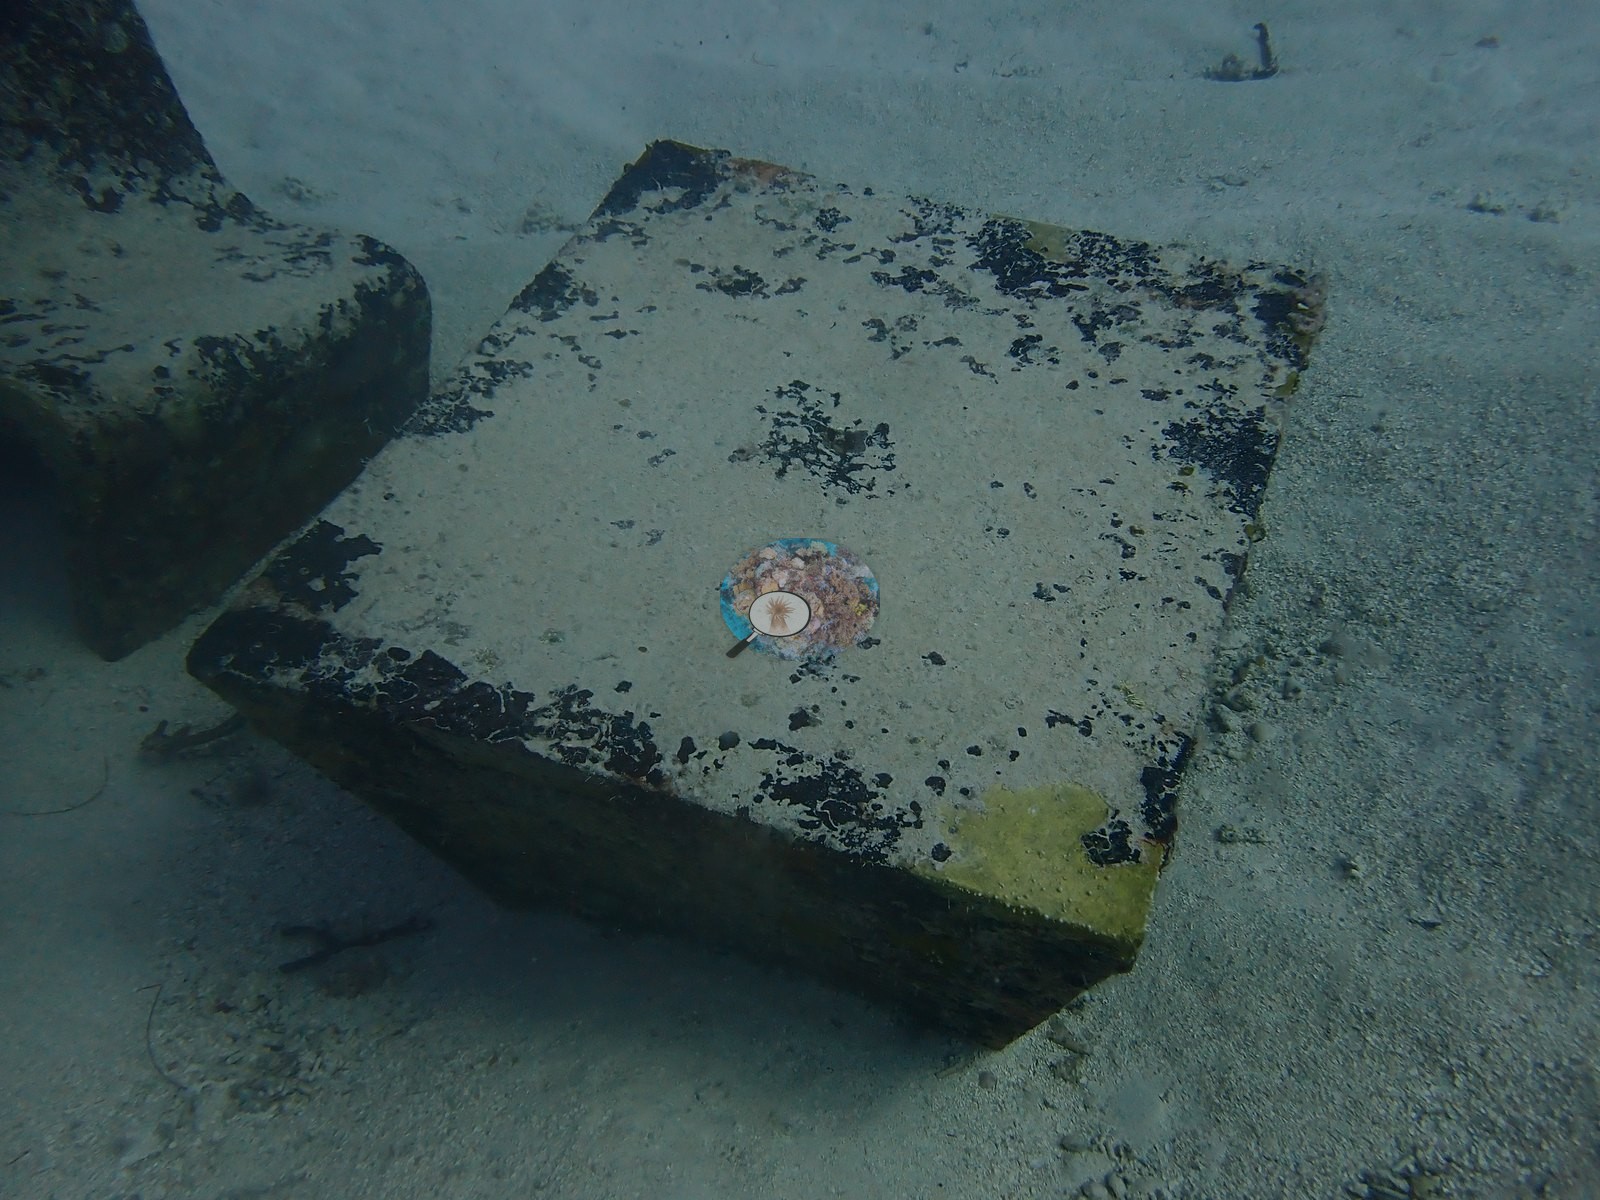
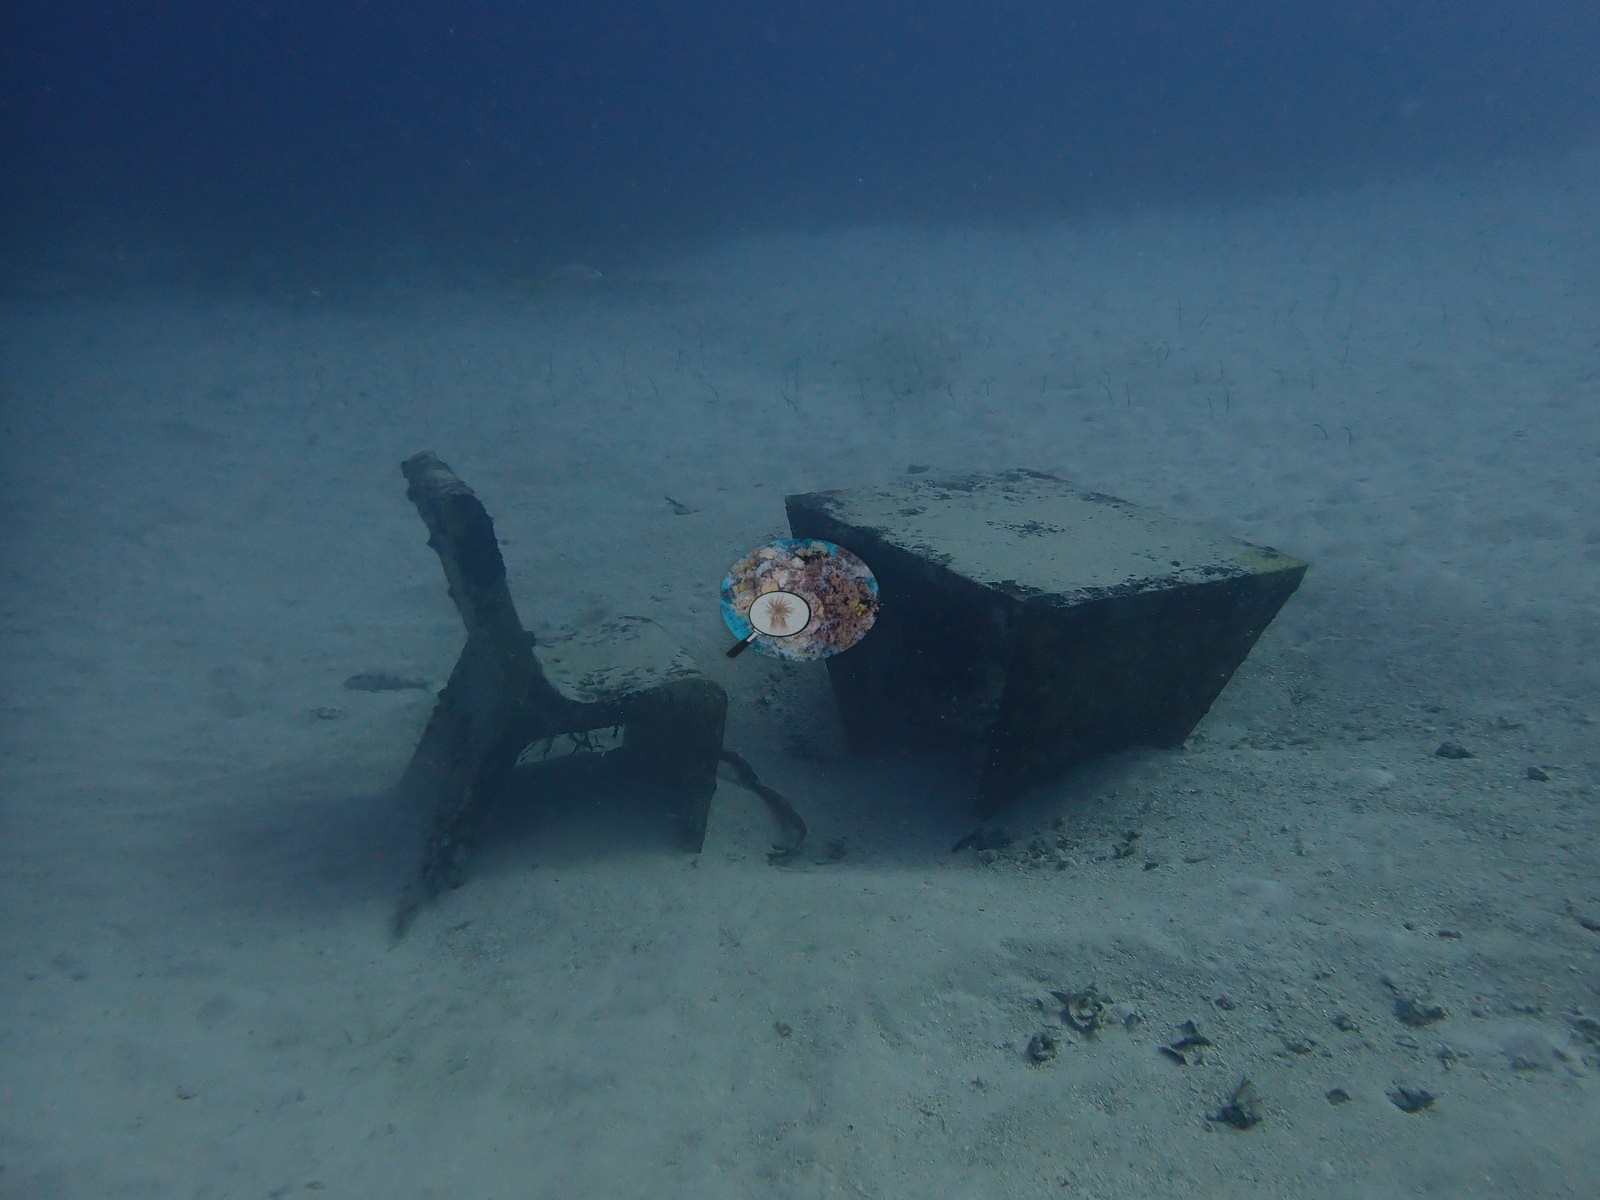
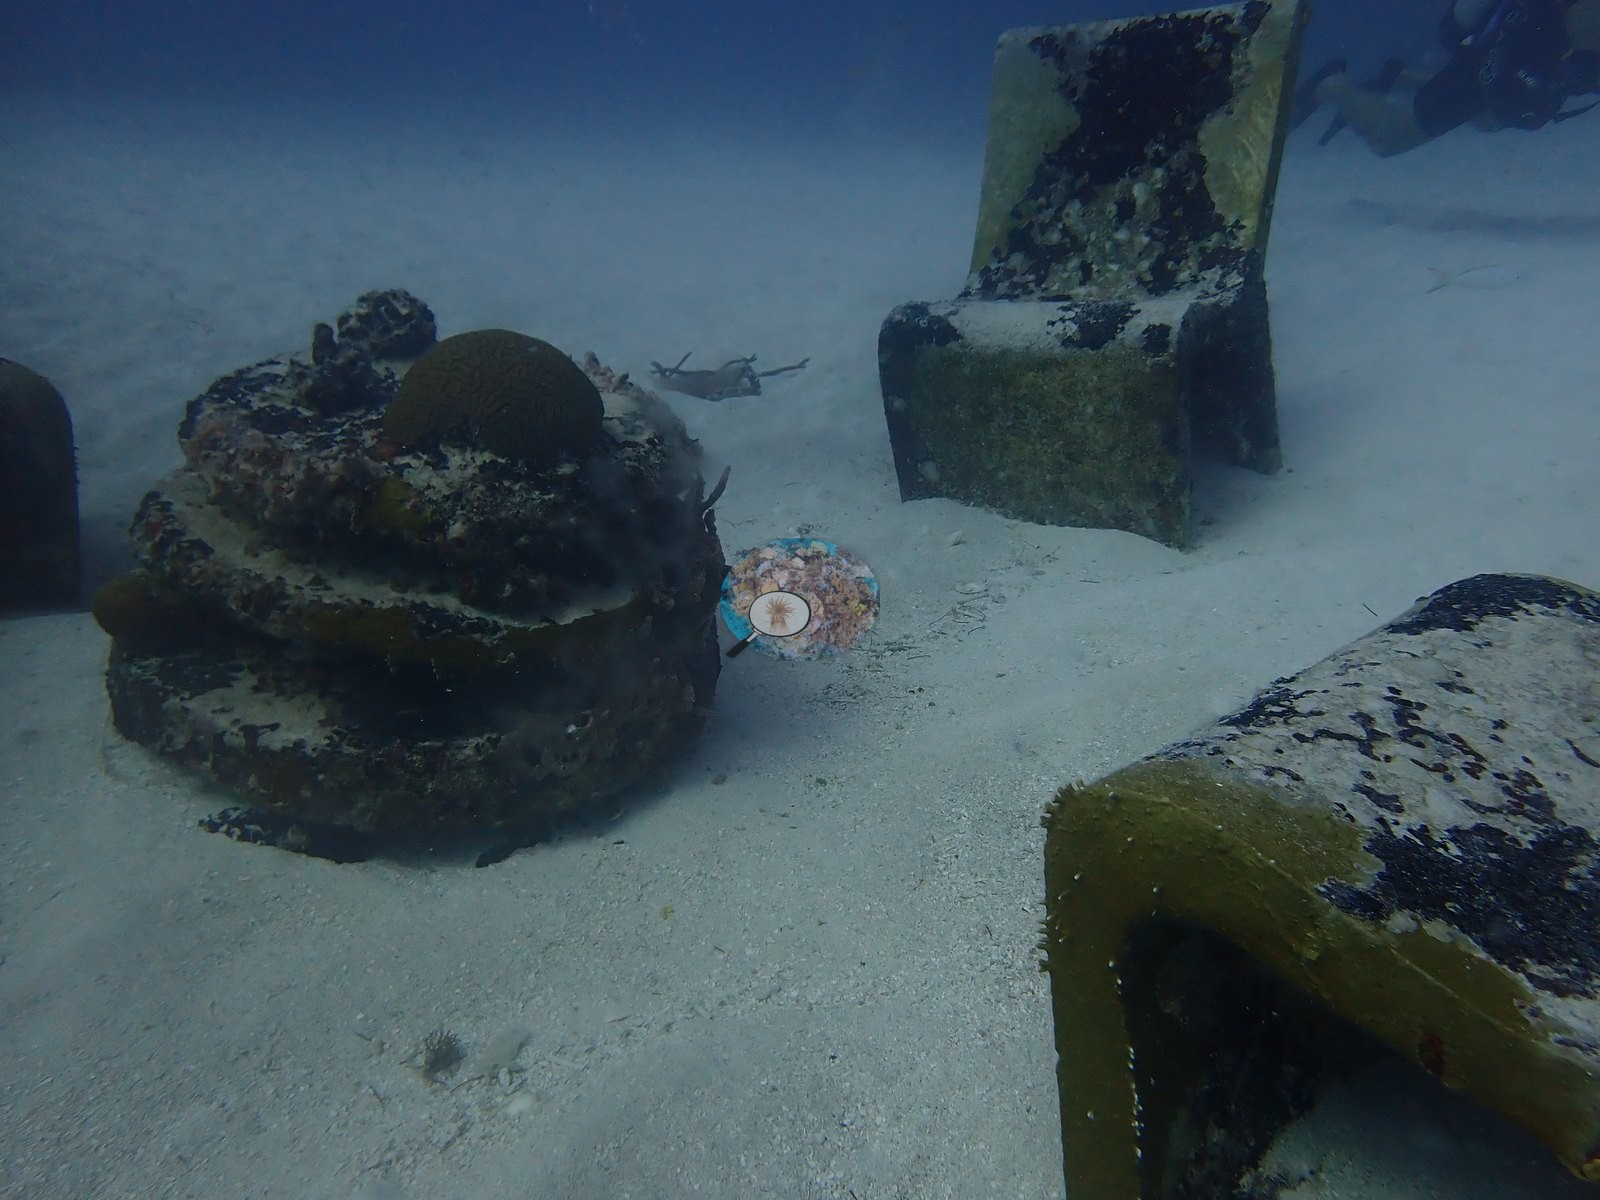
Catheley H is one of Anguilla's more curious dives — a patchwork of natural rock and rubble seafloor threaded with derelict fish traps, stacked concrete rings, and a pair of upright pilings that has slowly become its own small reef (e.g., Image 3, Image 15, Image 41, Image 48).
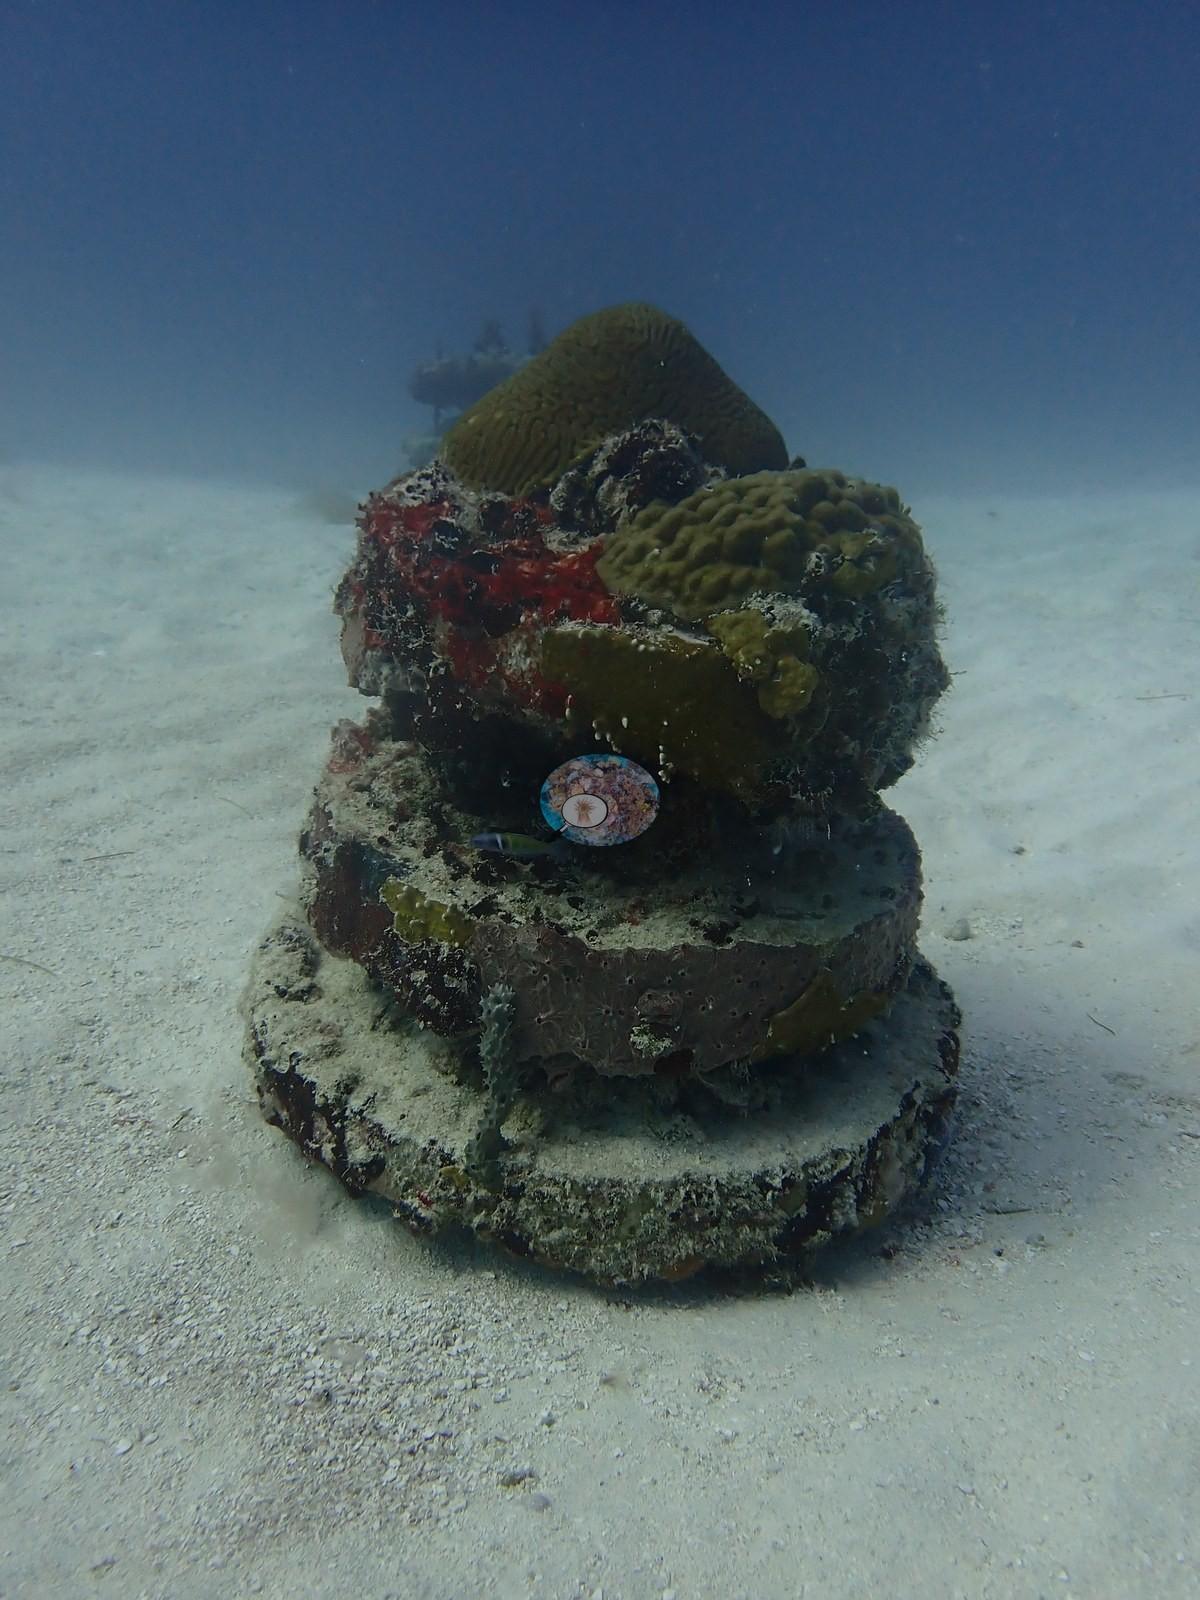
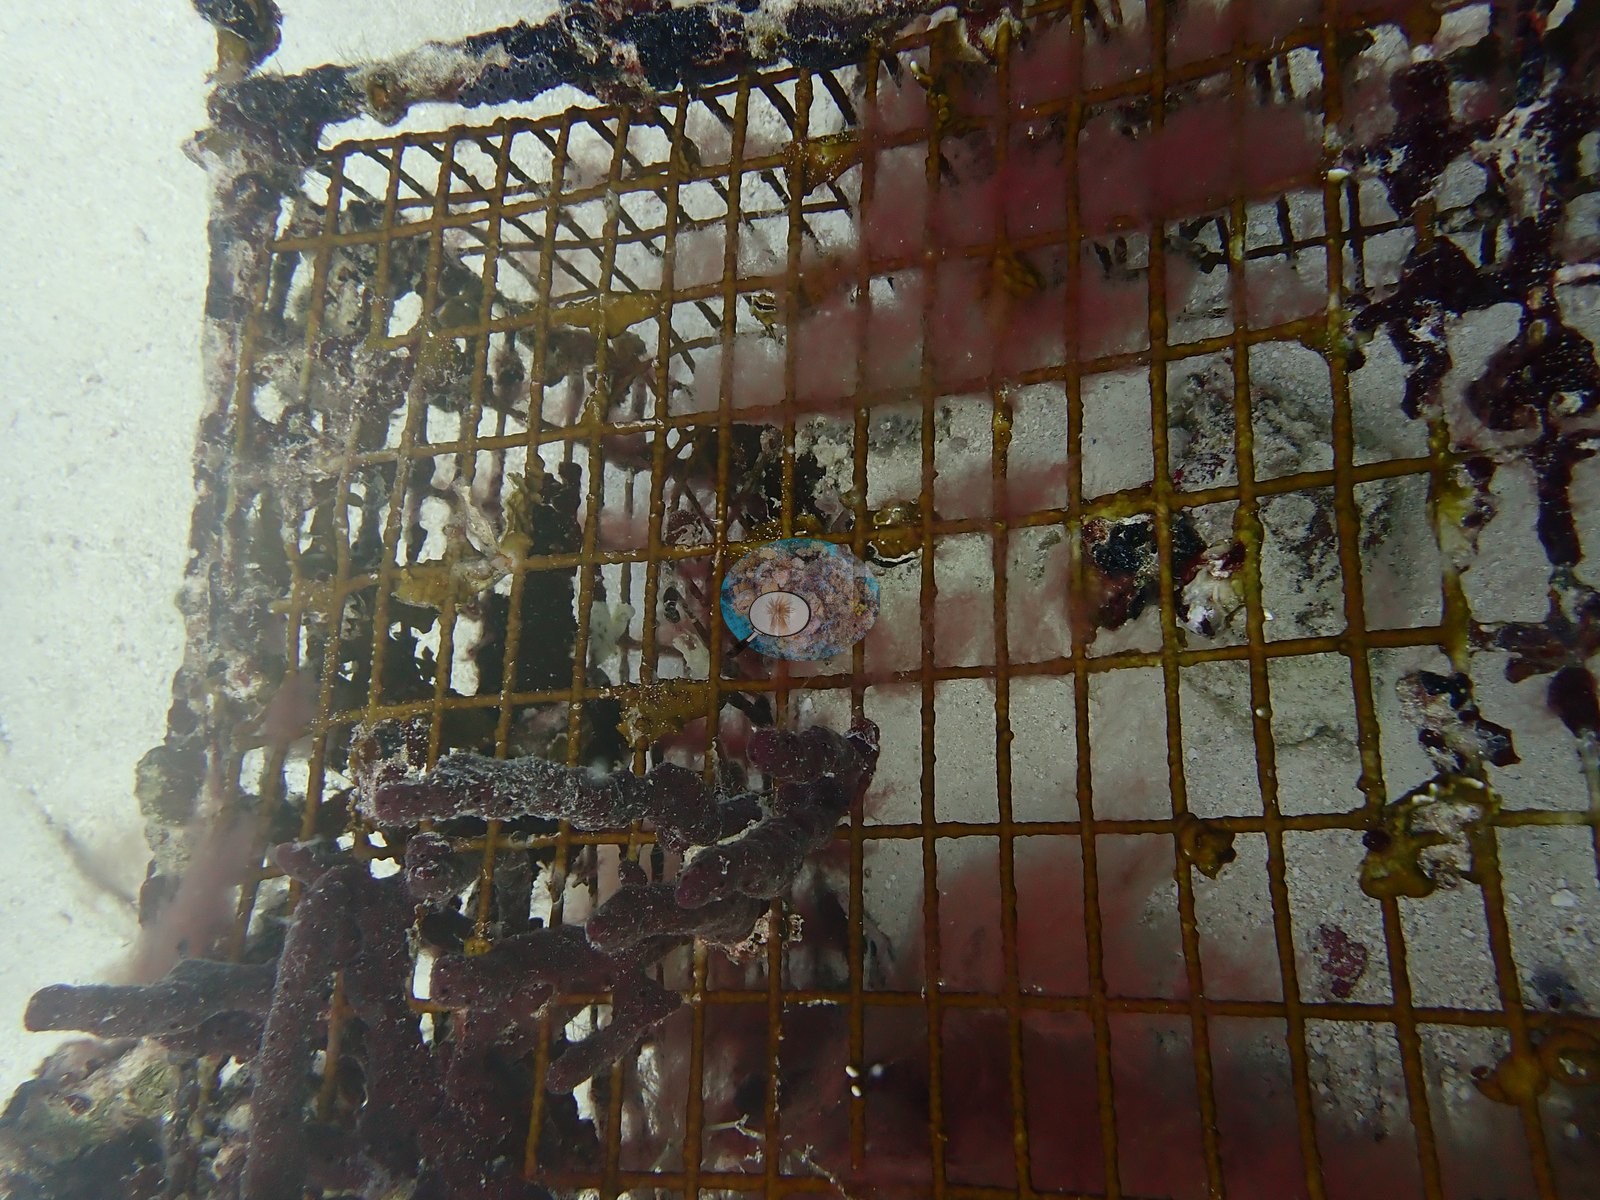
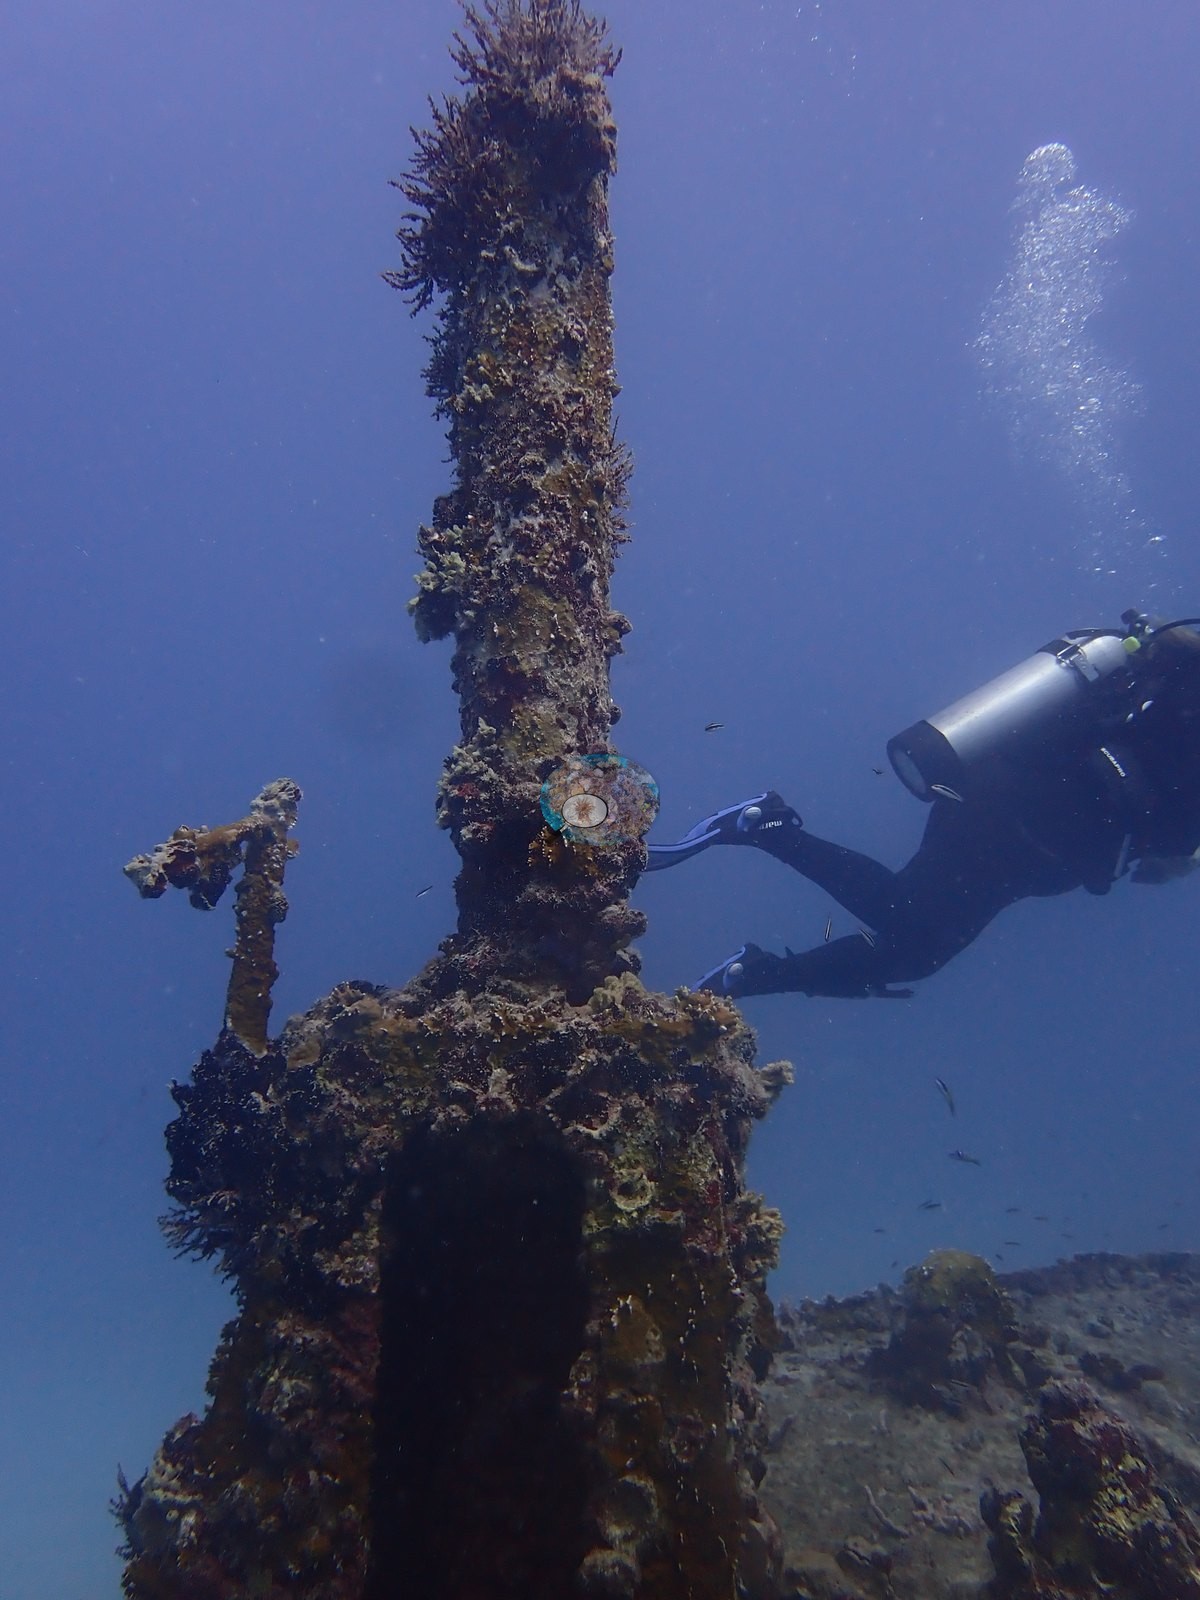
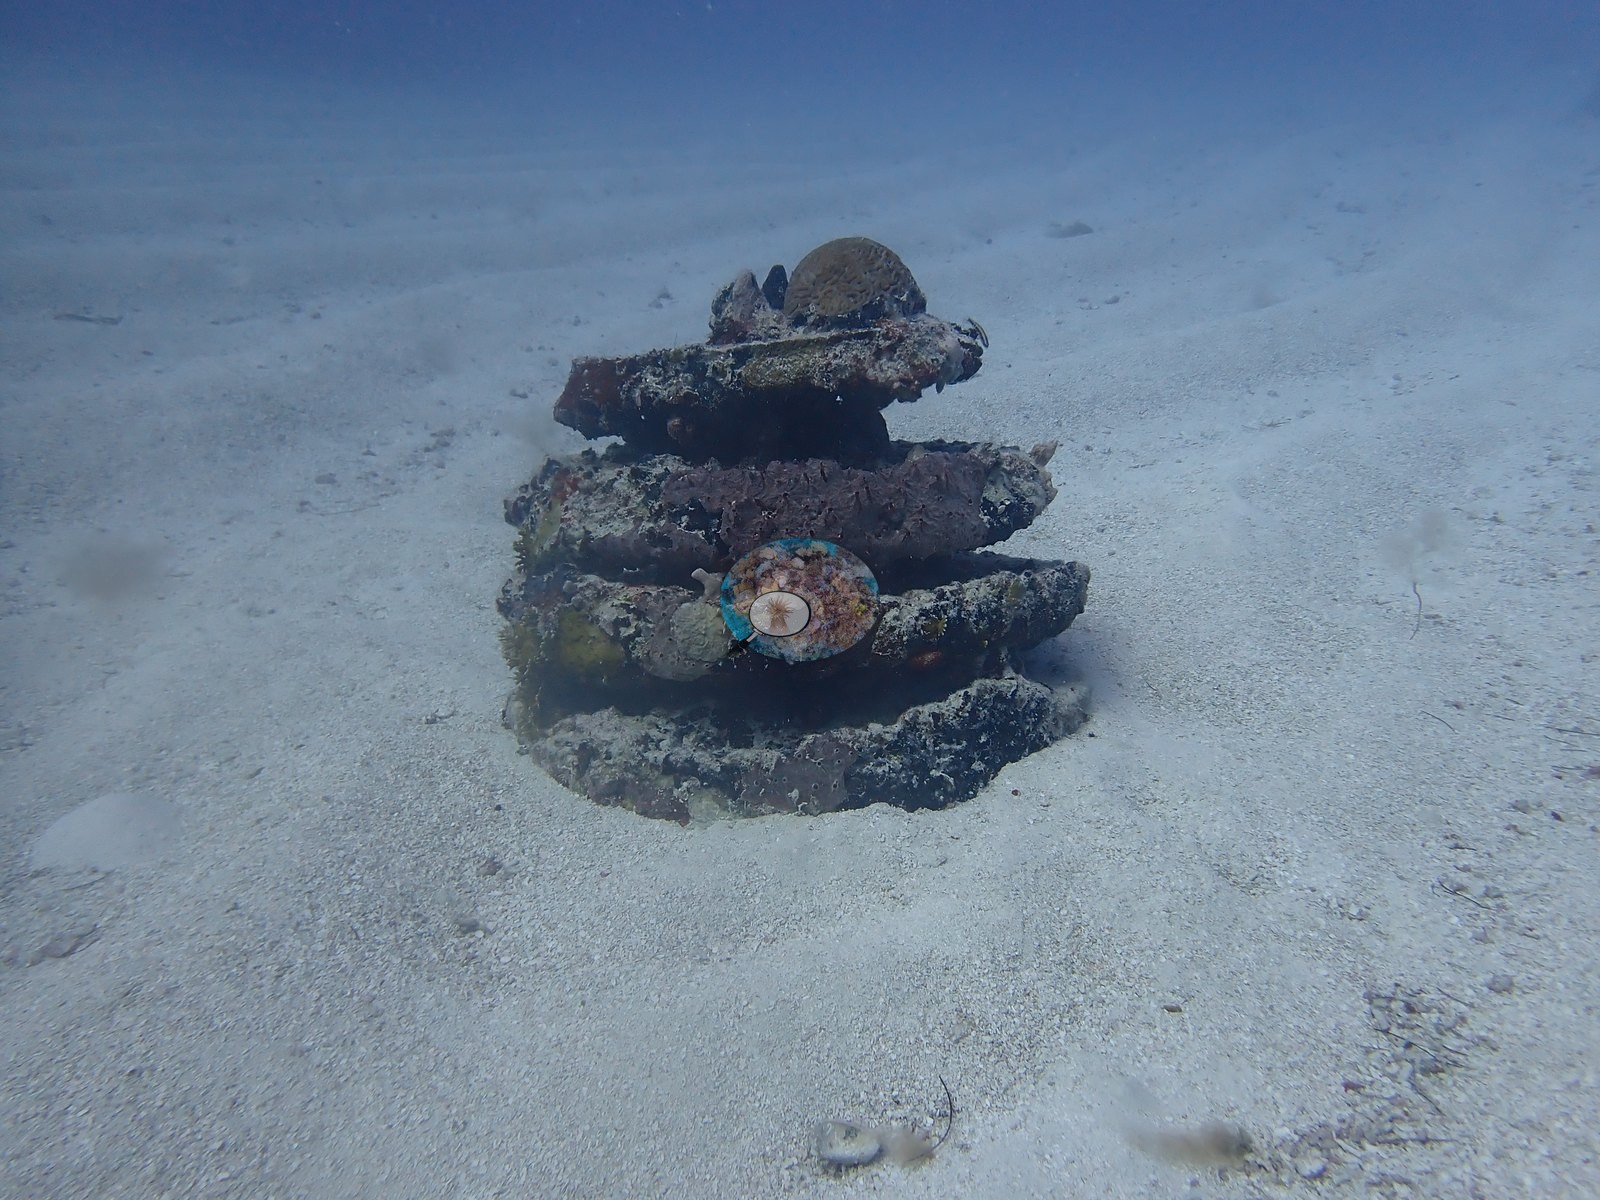
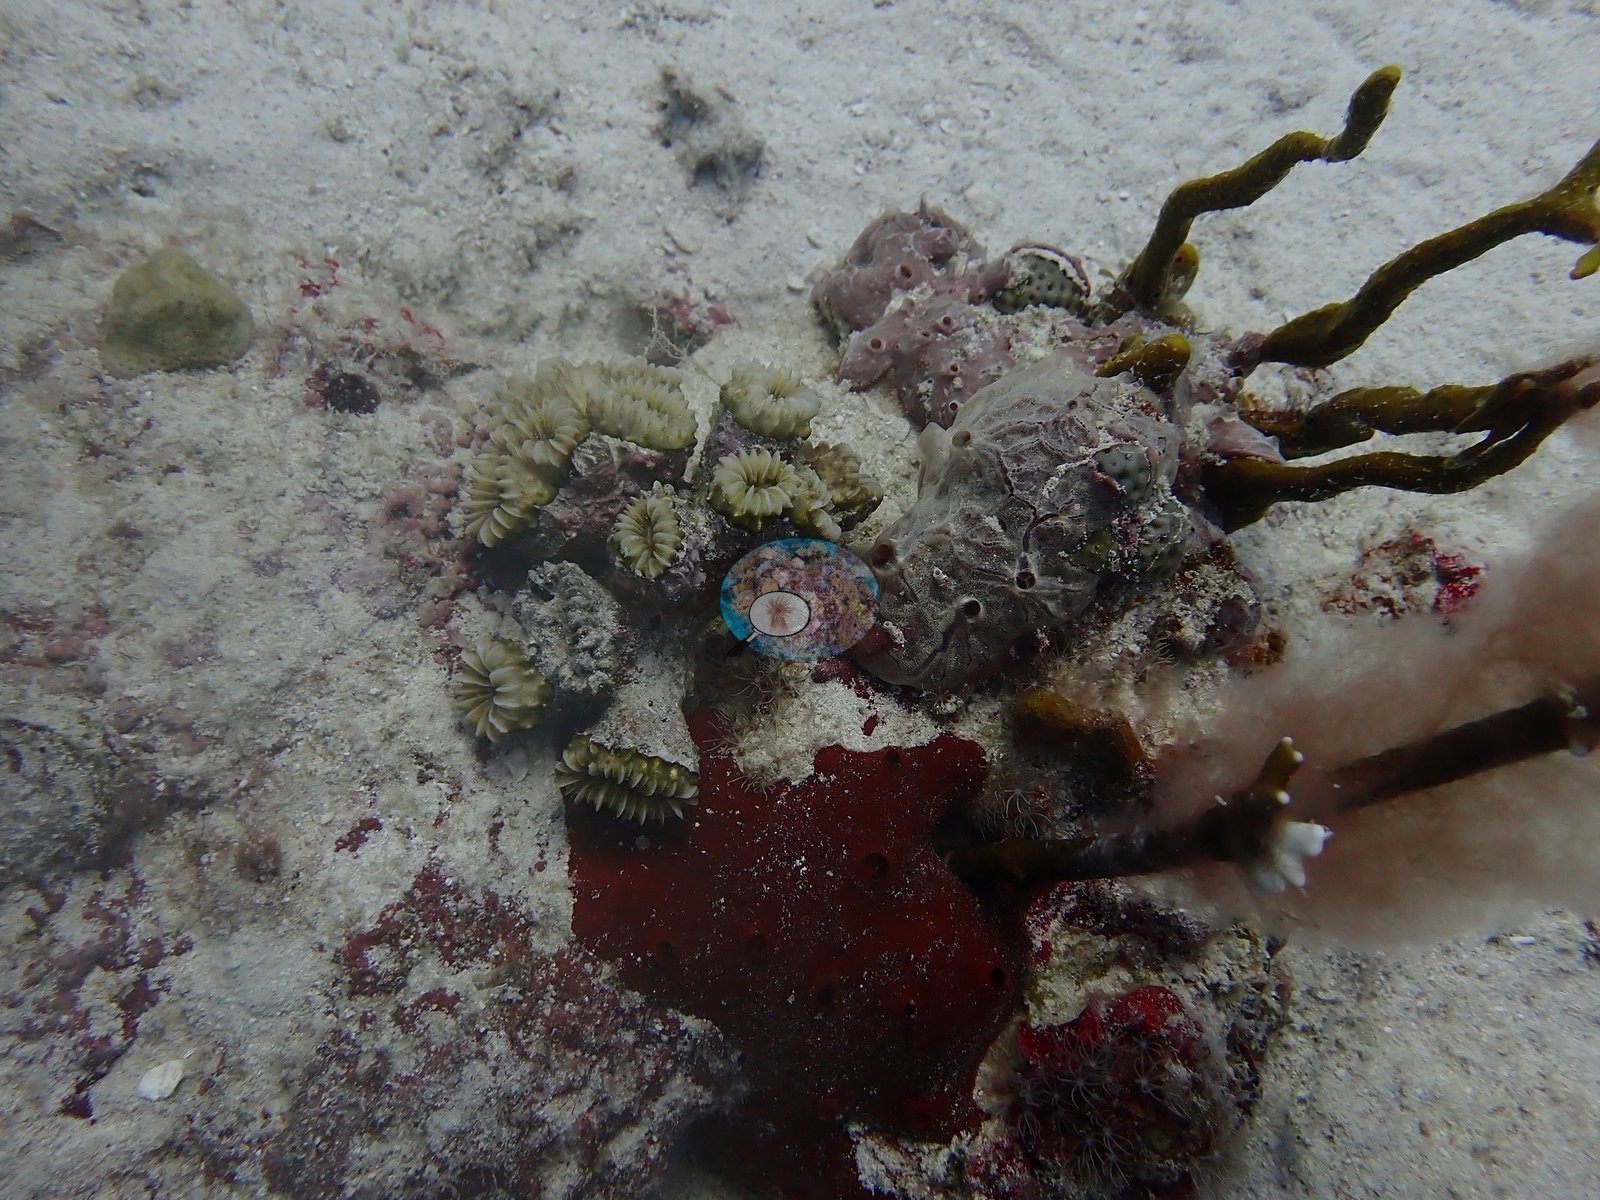
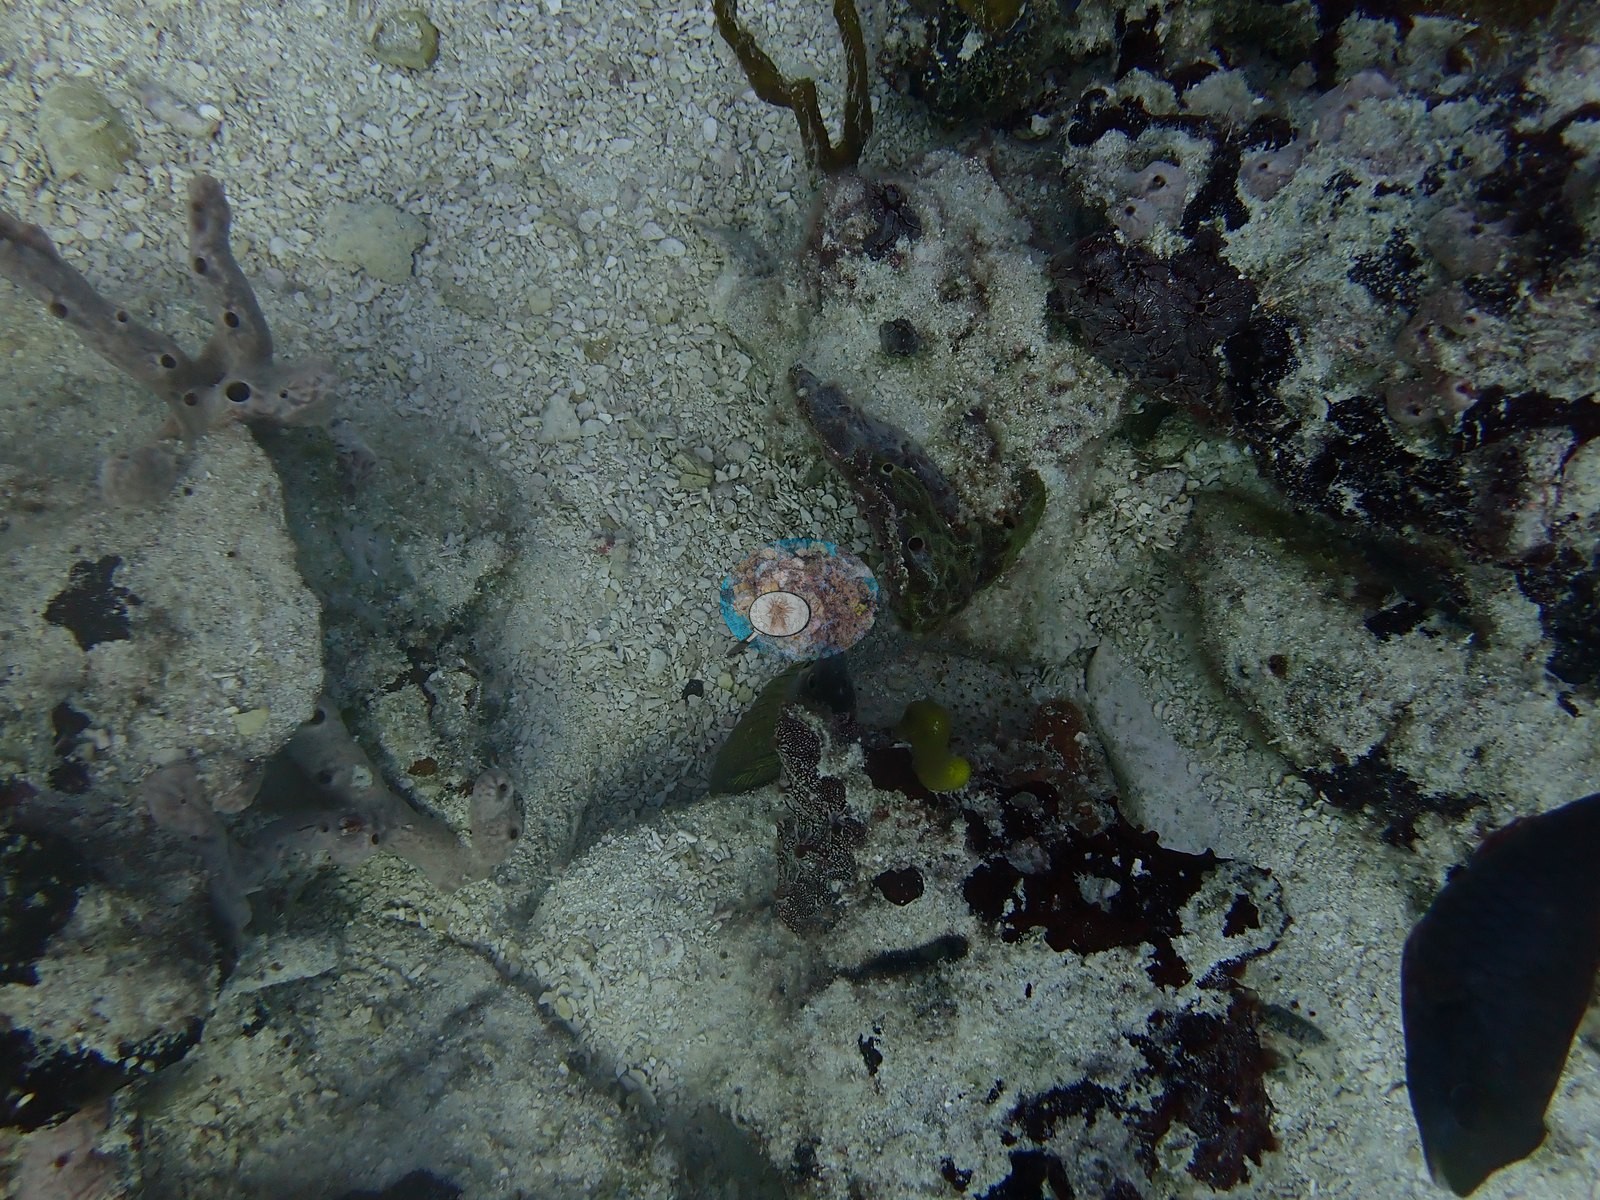
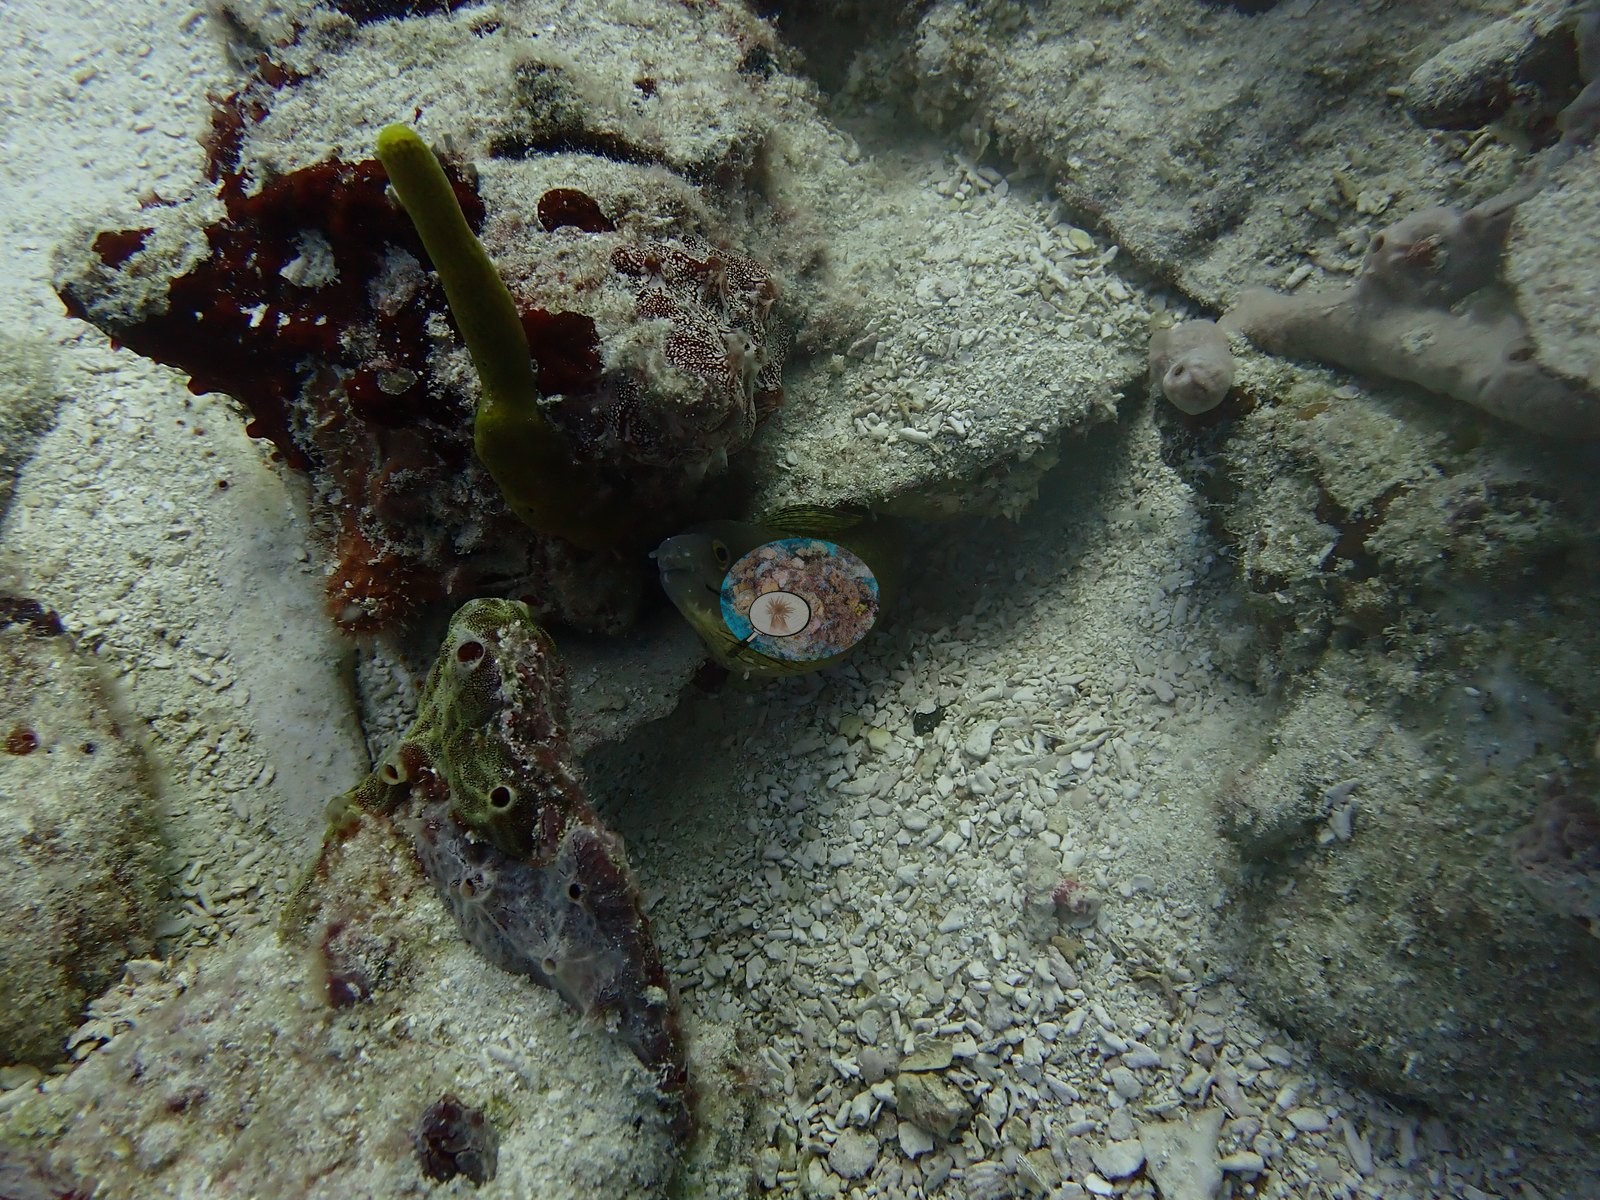
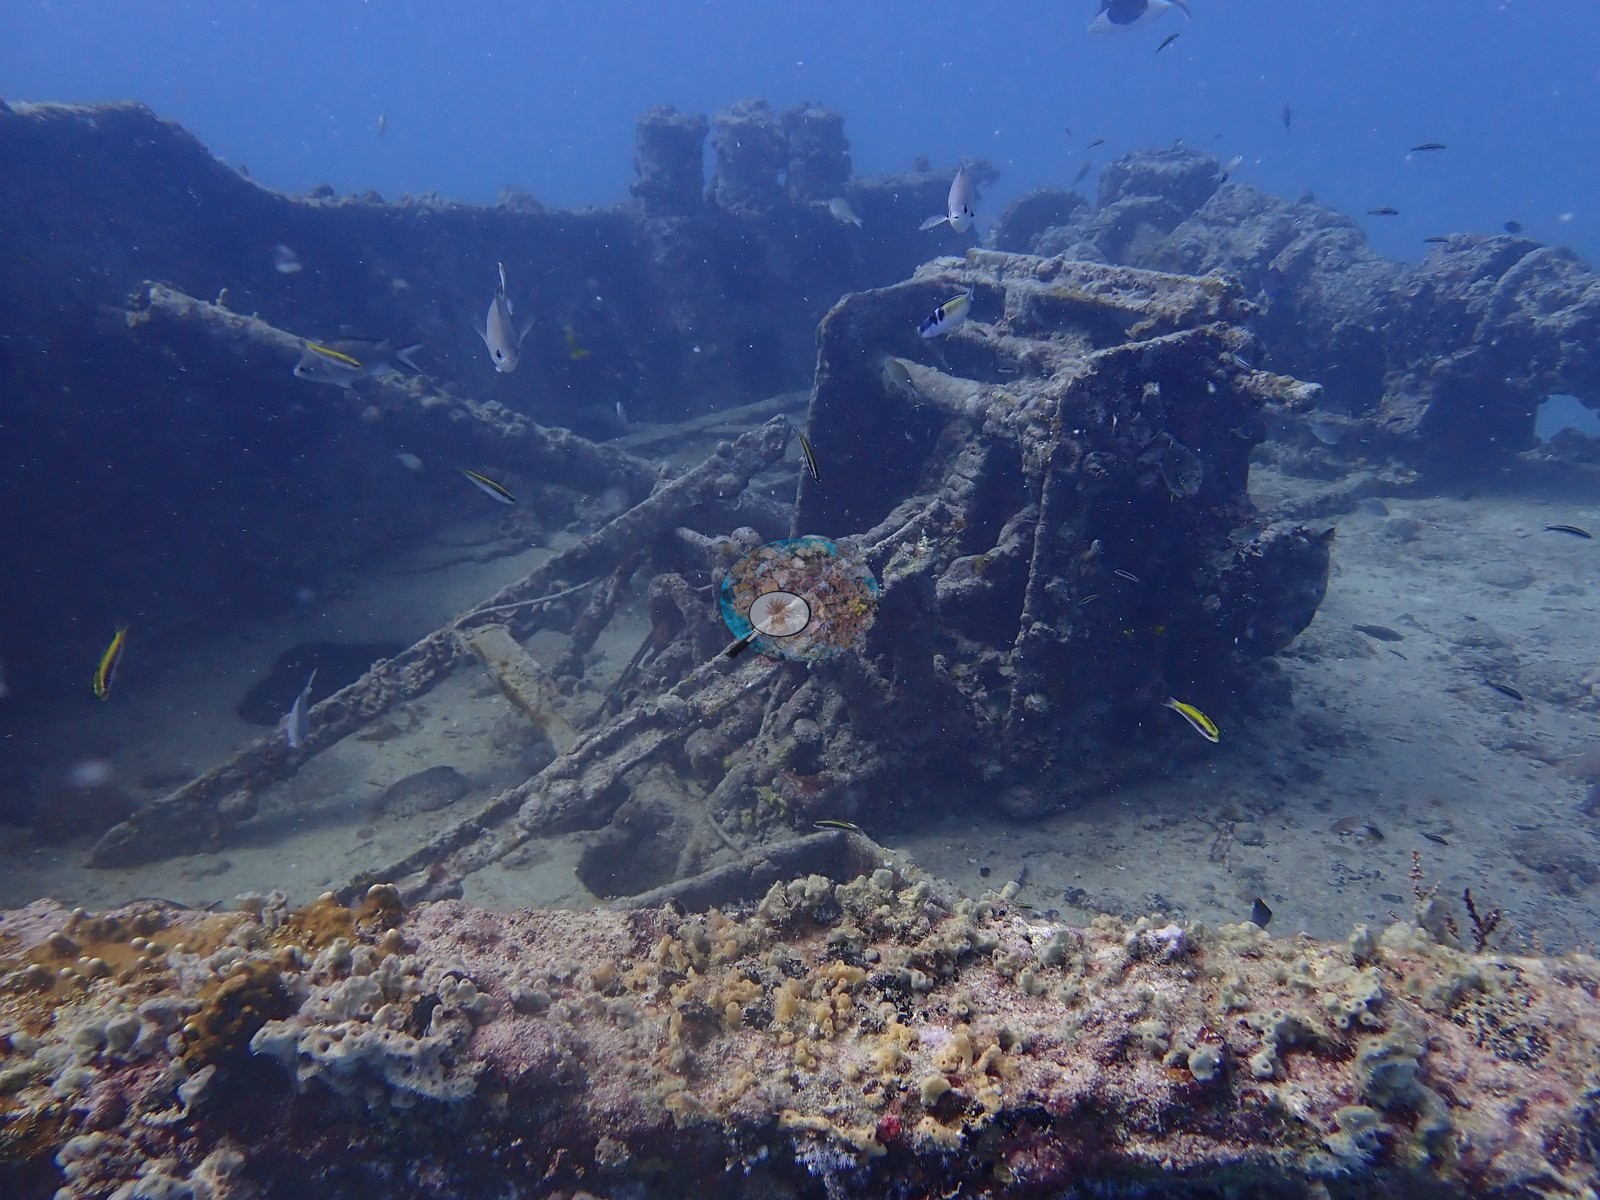
It is equal parts reef and reclaimed junkyard, a reminder of how quickly the Caribbean seafloor puts anything — concrete, wire, or coral rubble — to work (e.g., Image 11, Image 38, Image 39).
General benthic features
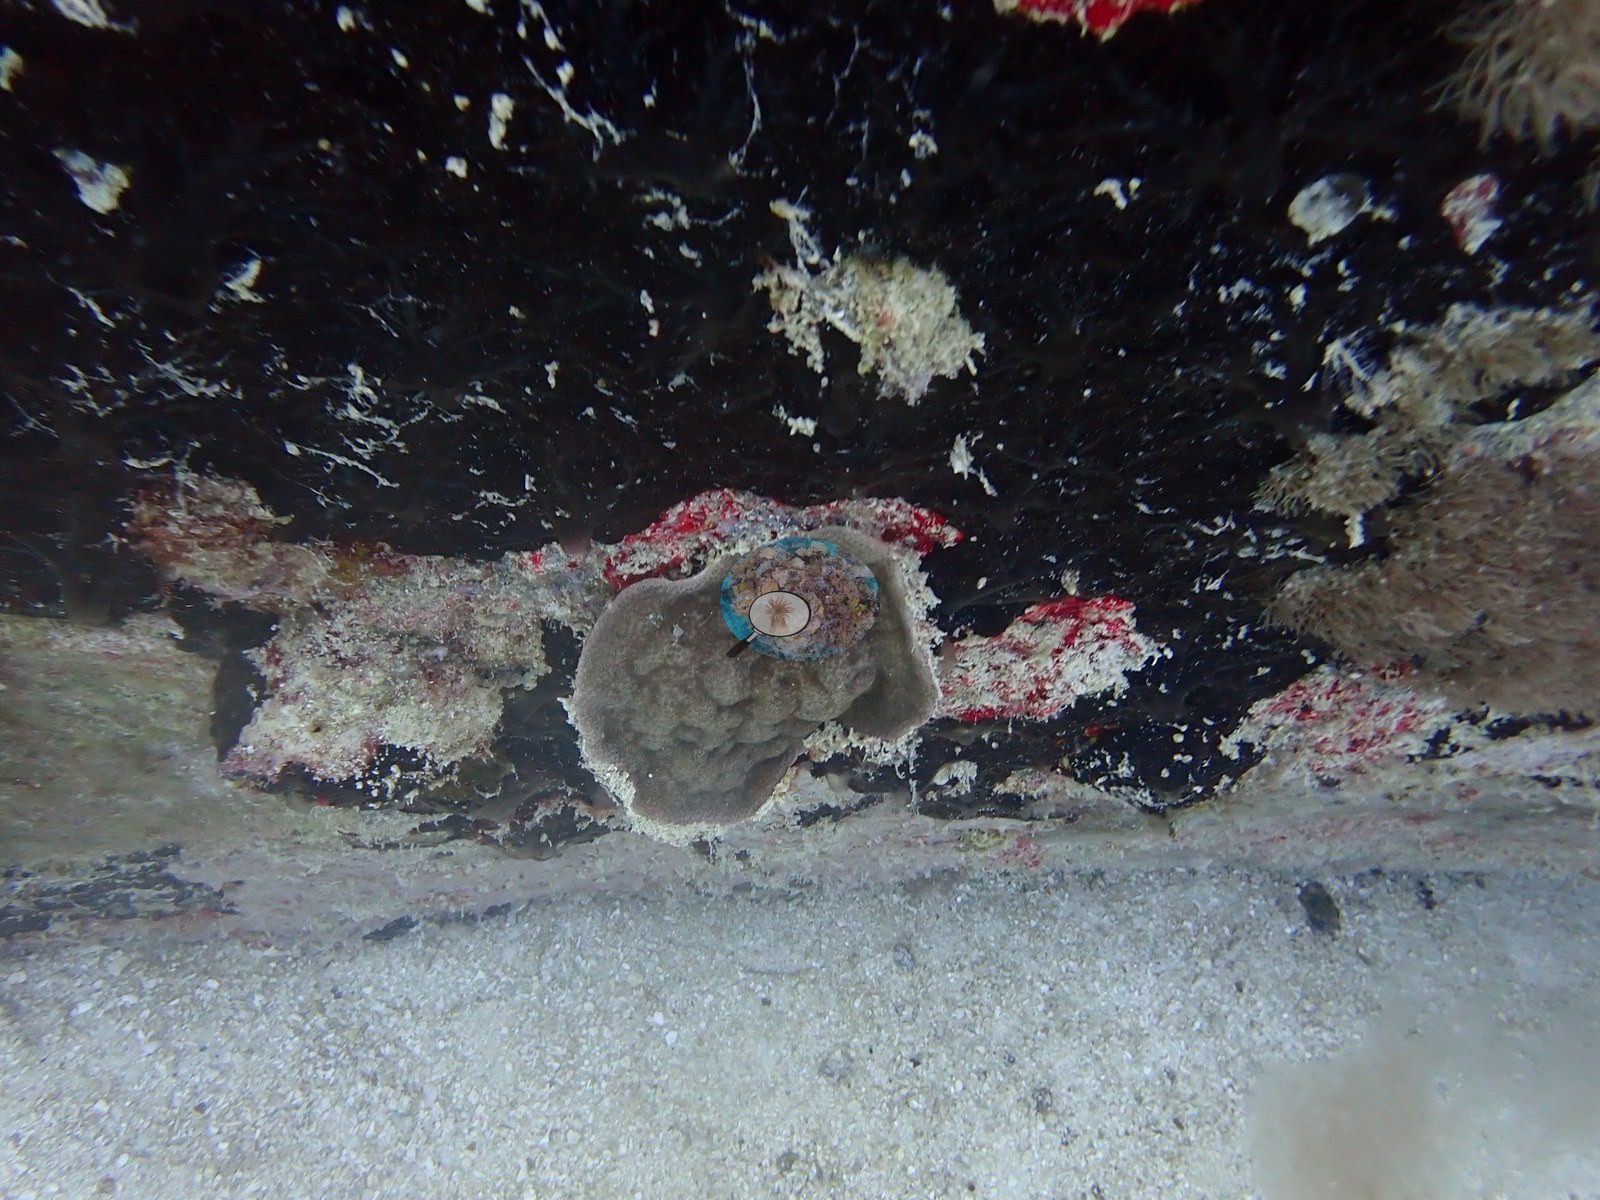
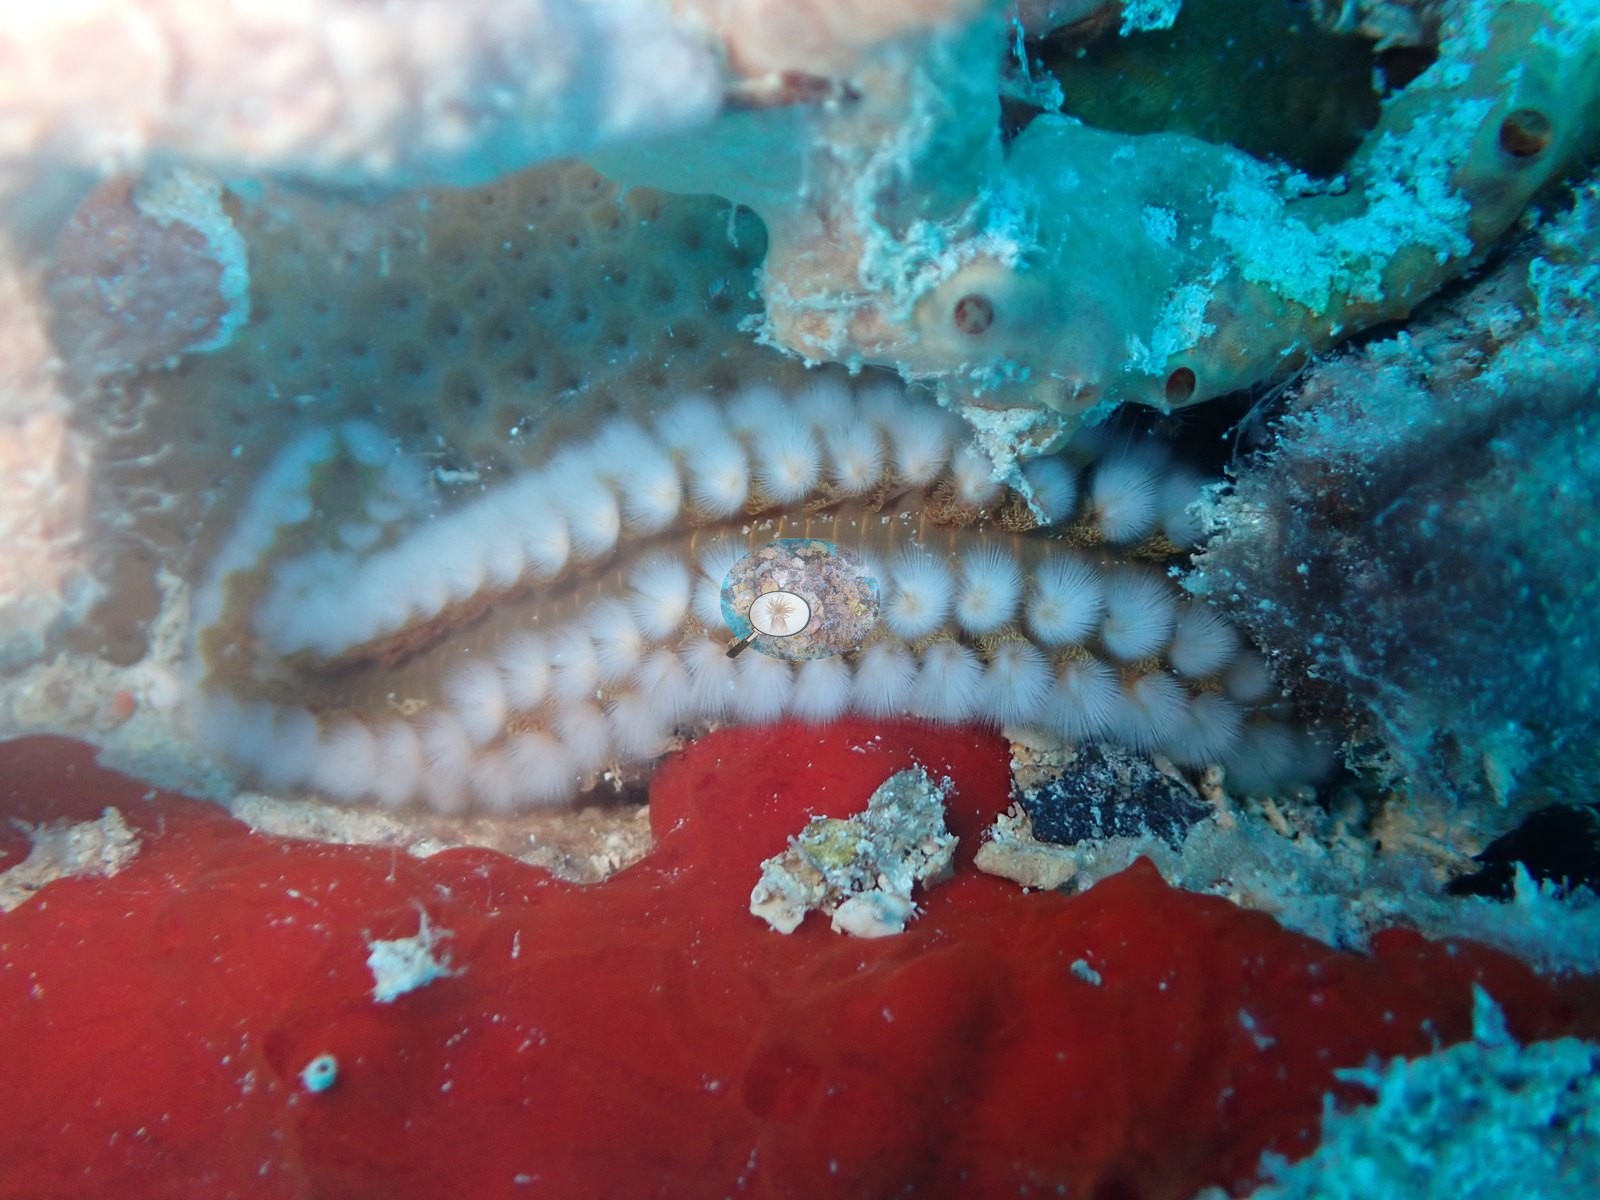
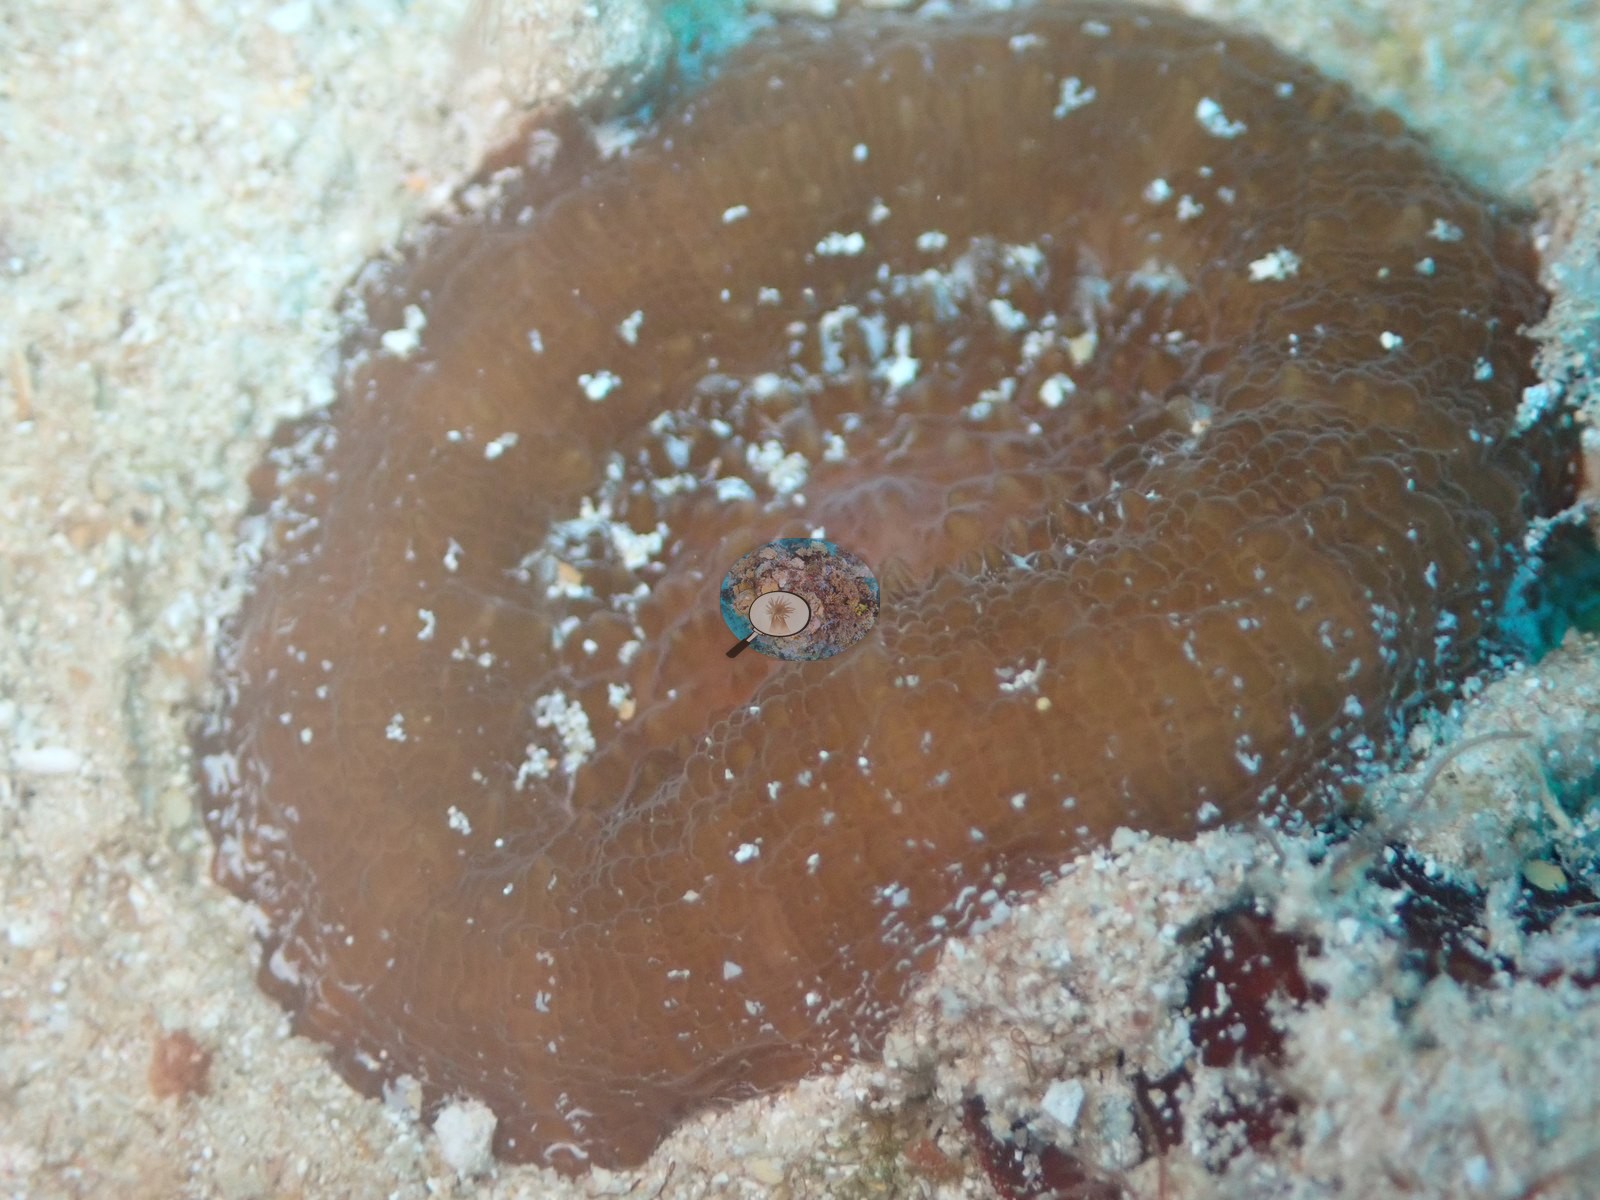
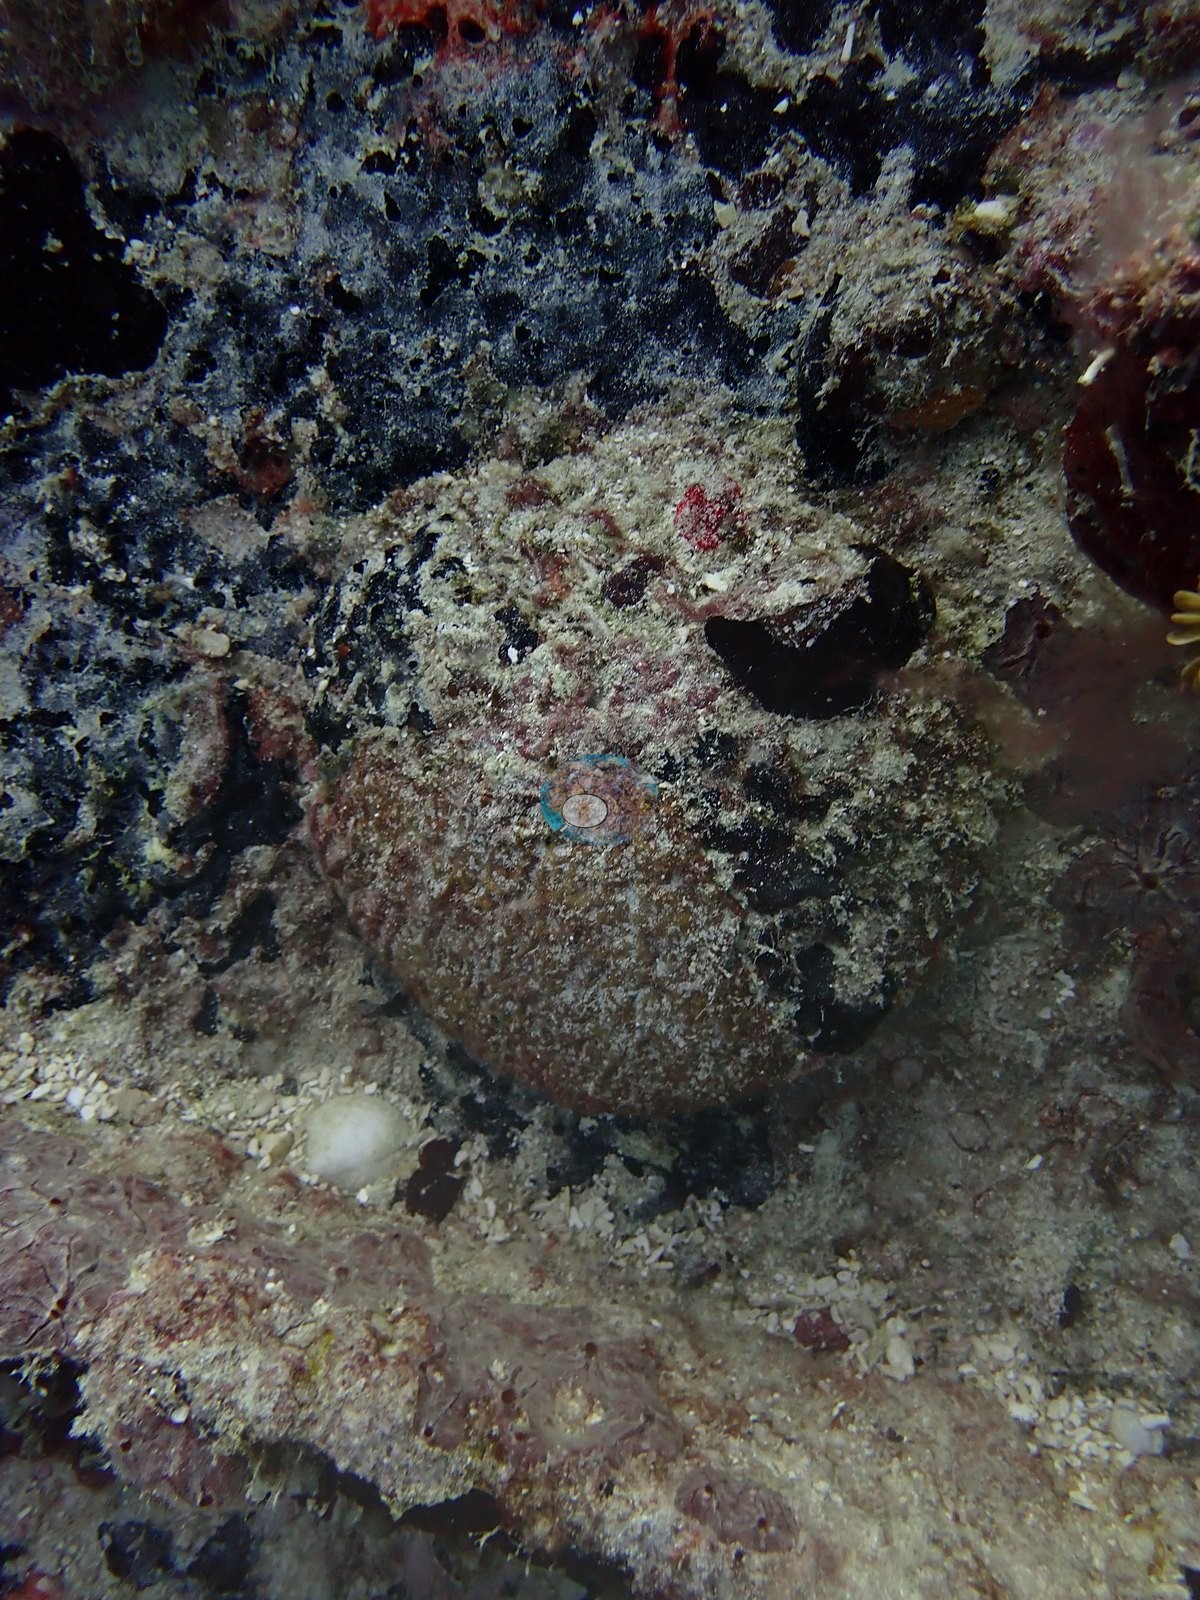
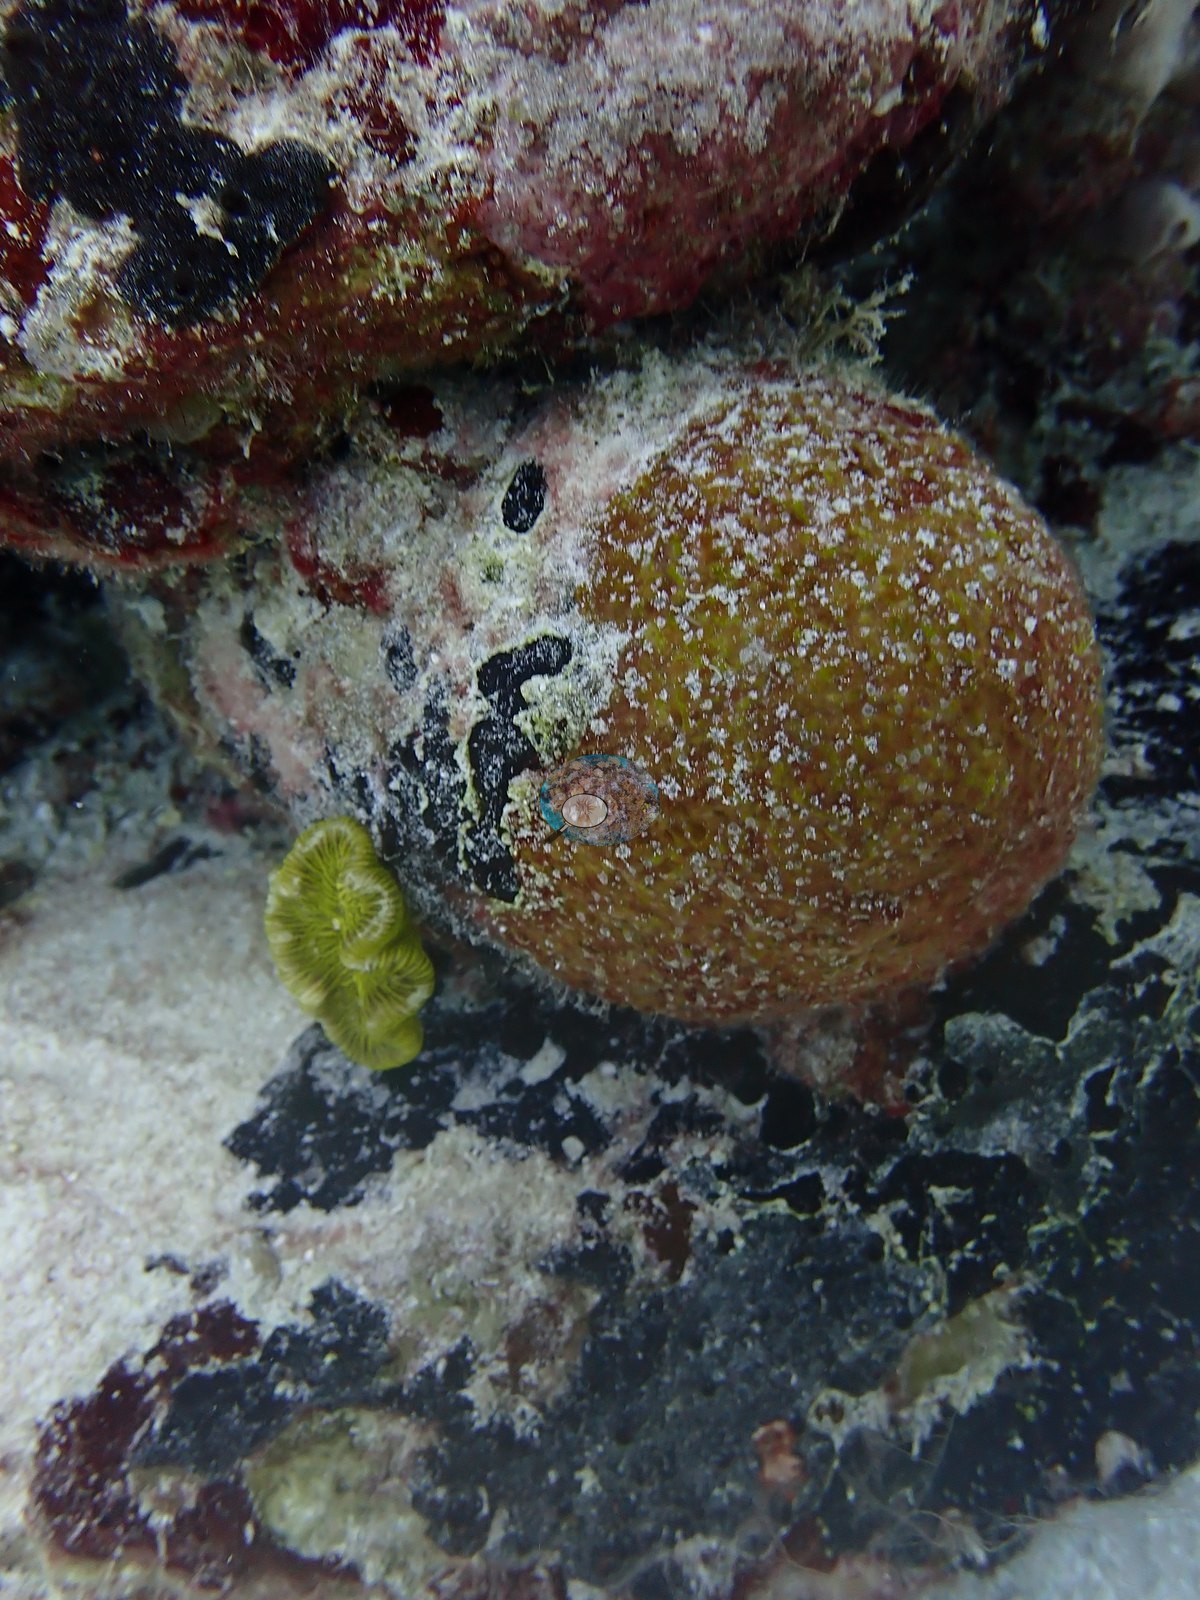
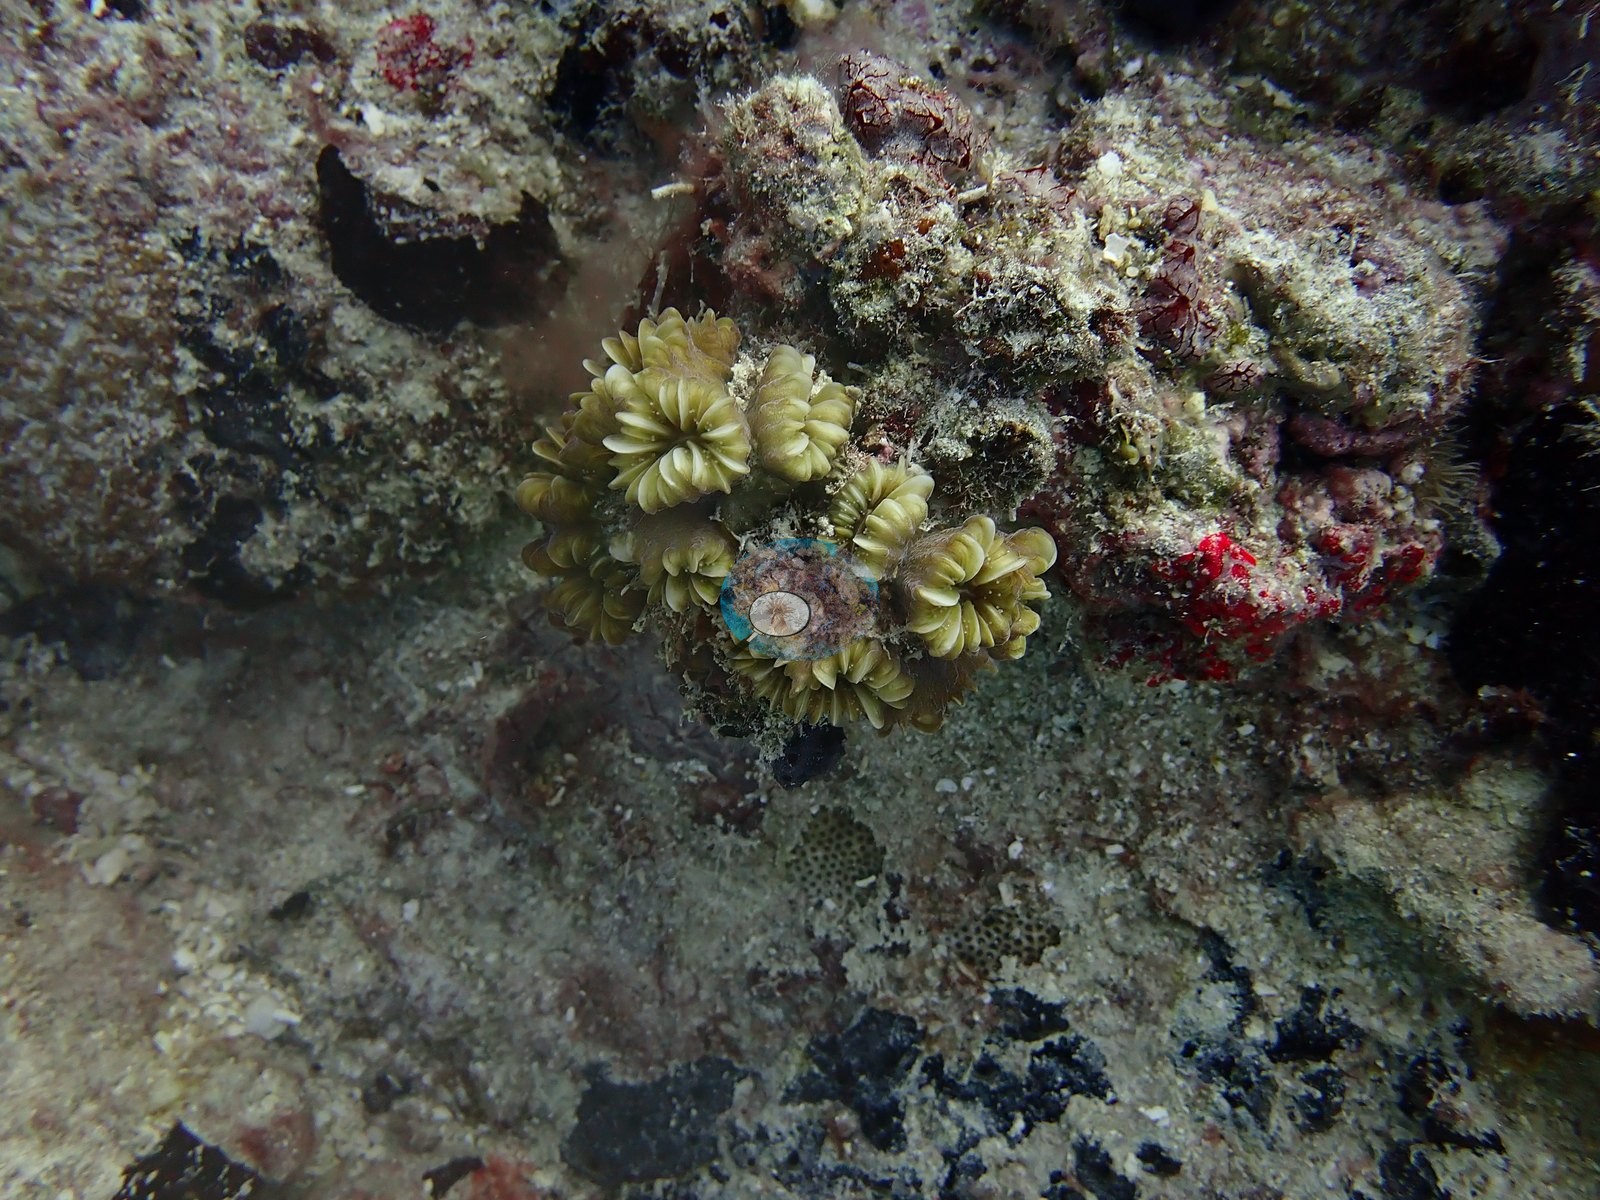
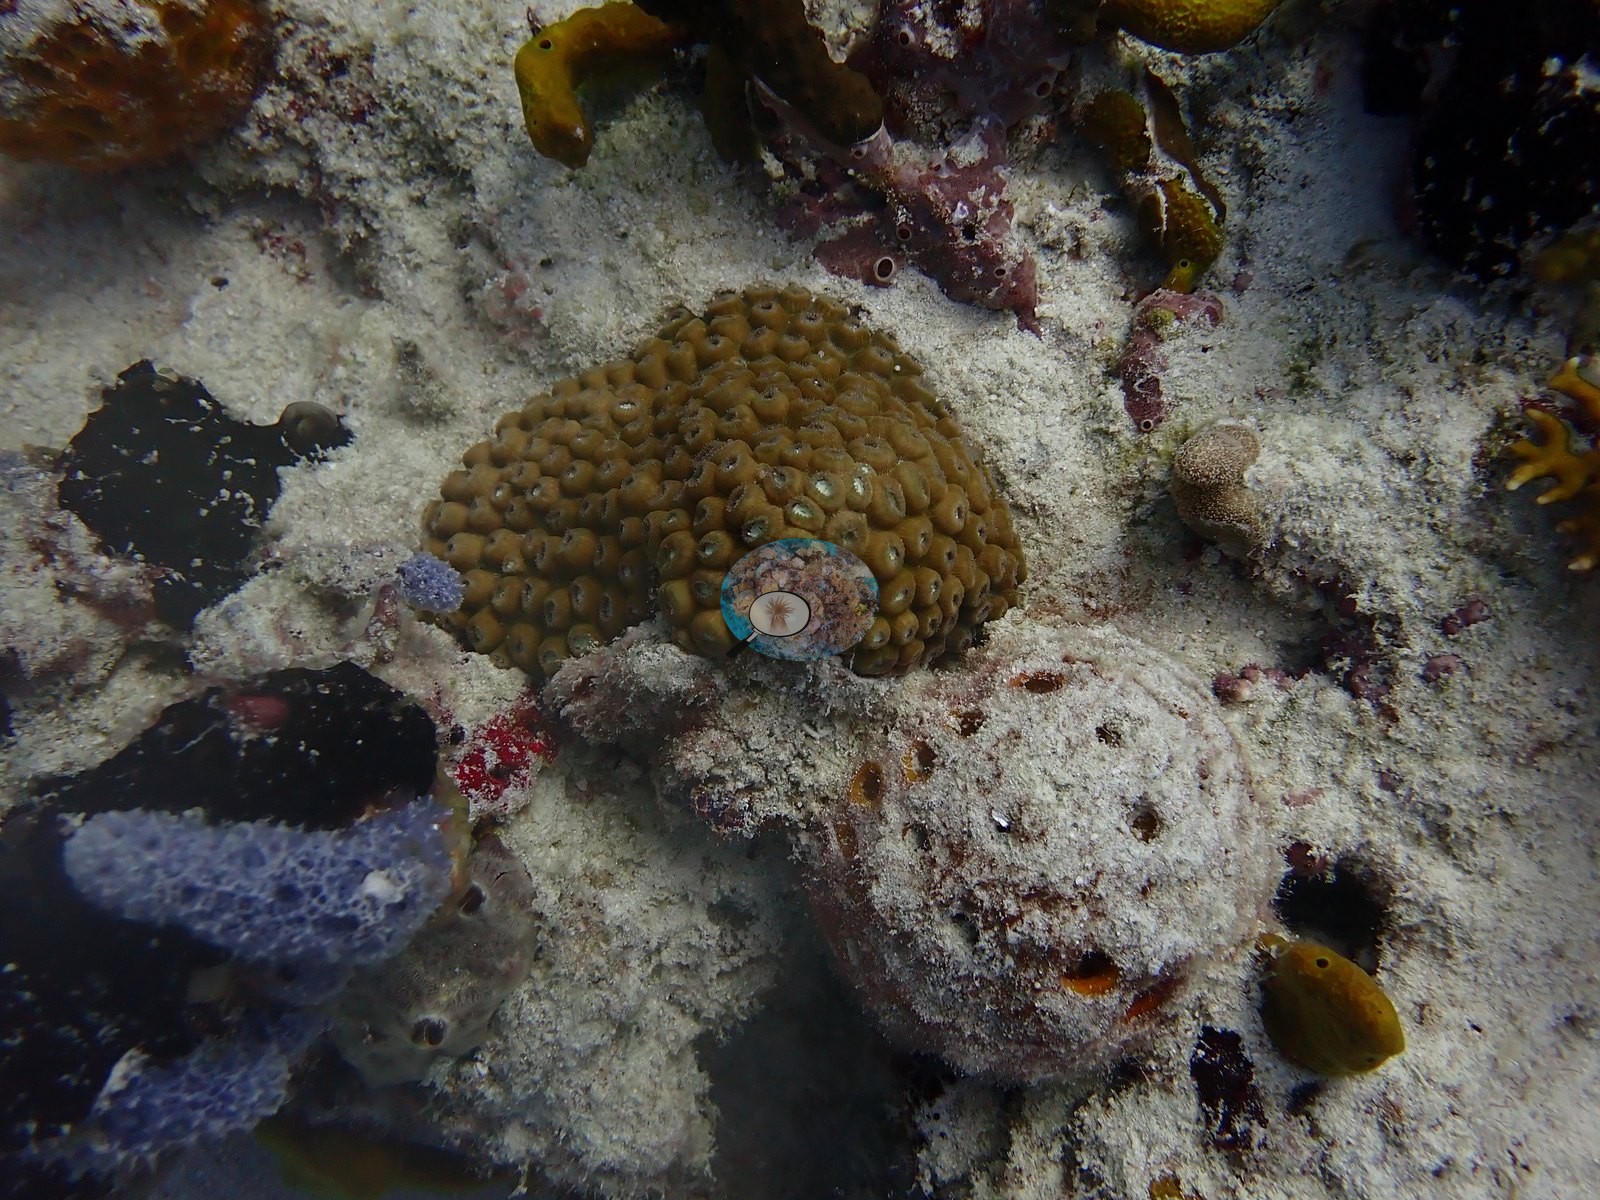
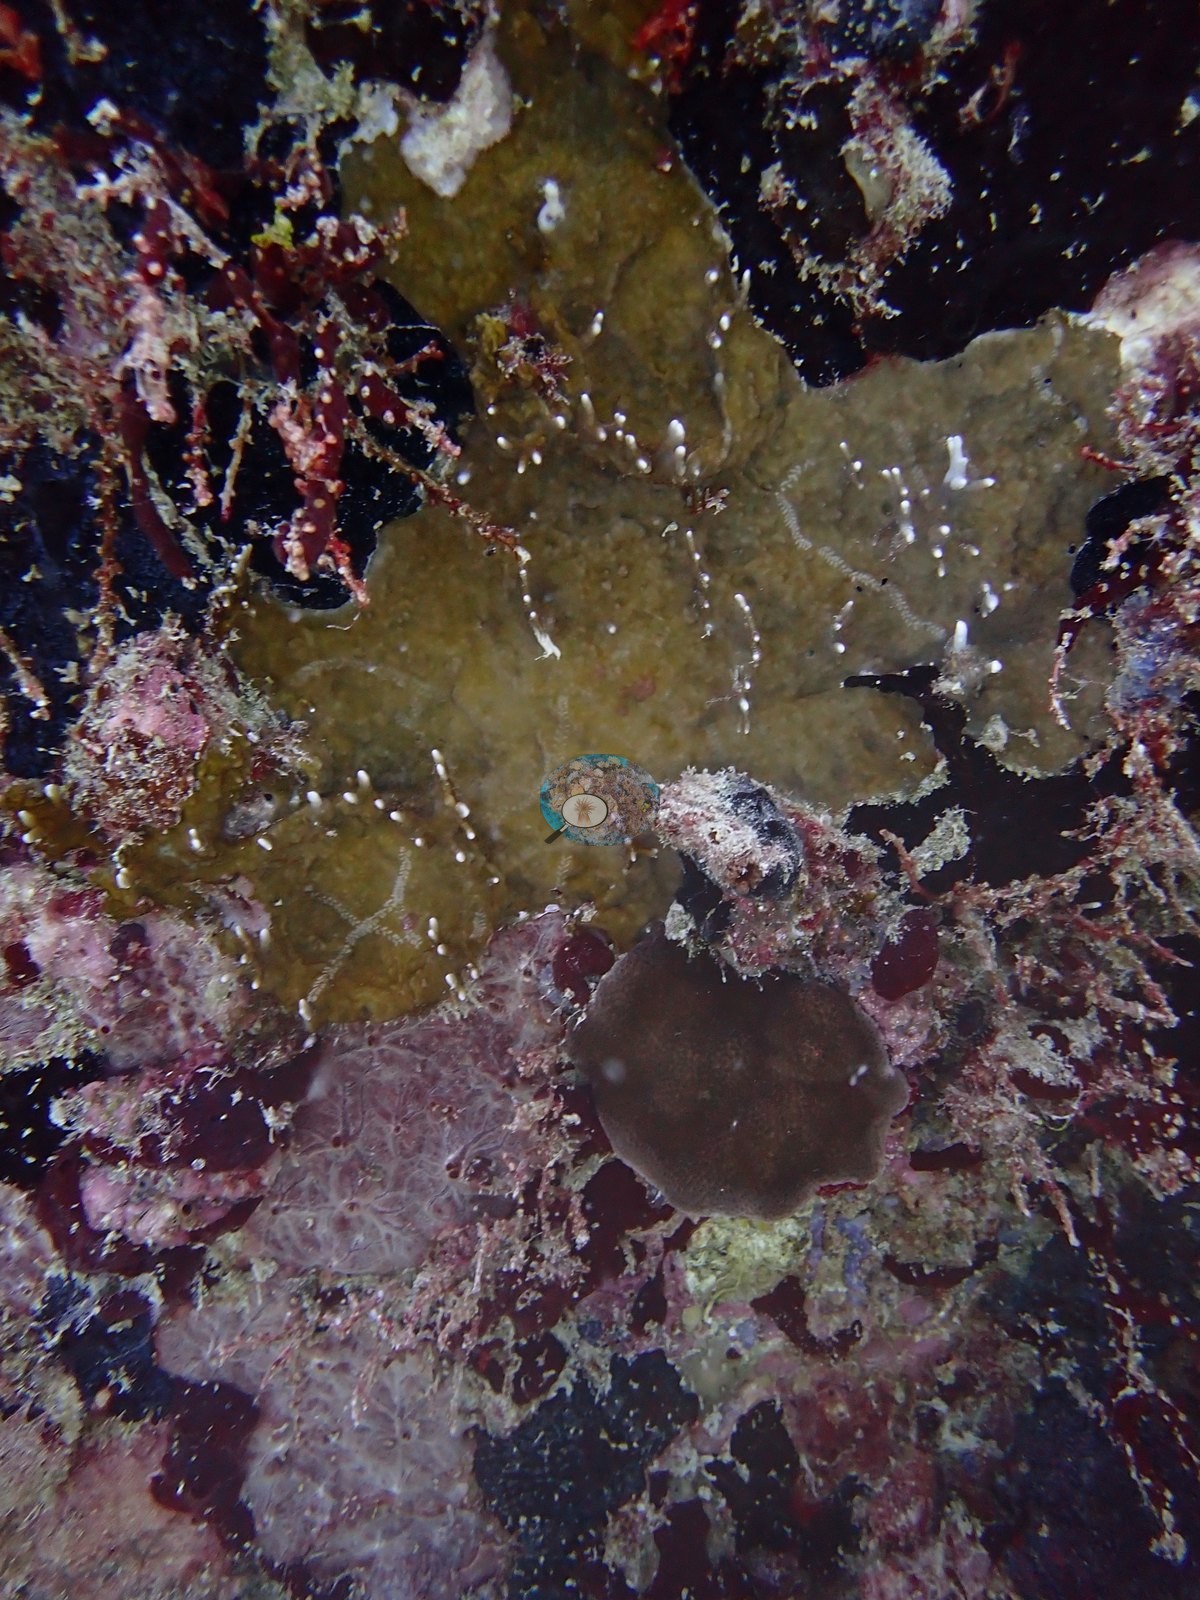
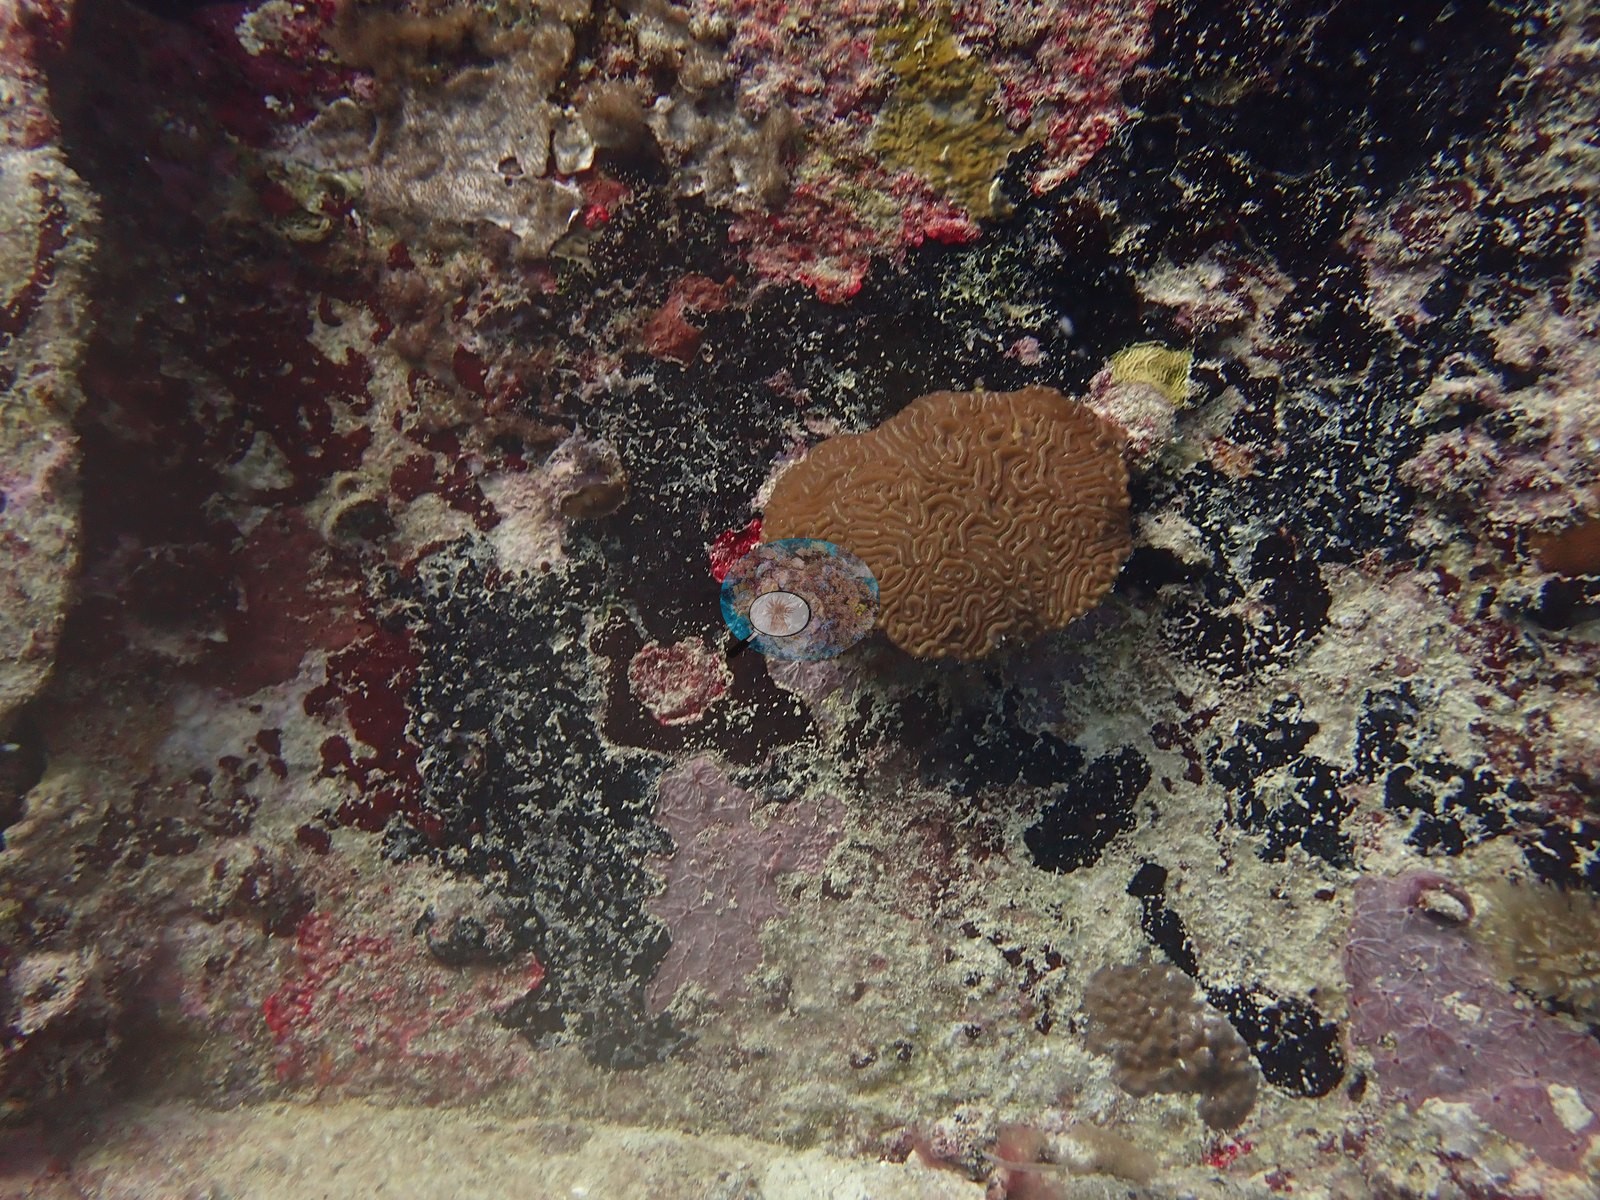
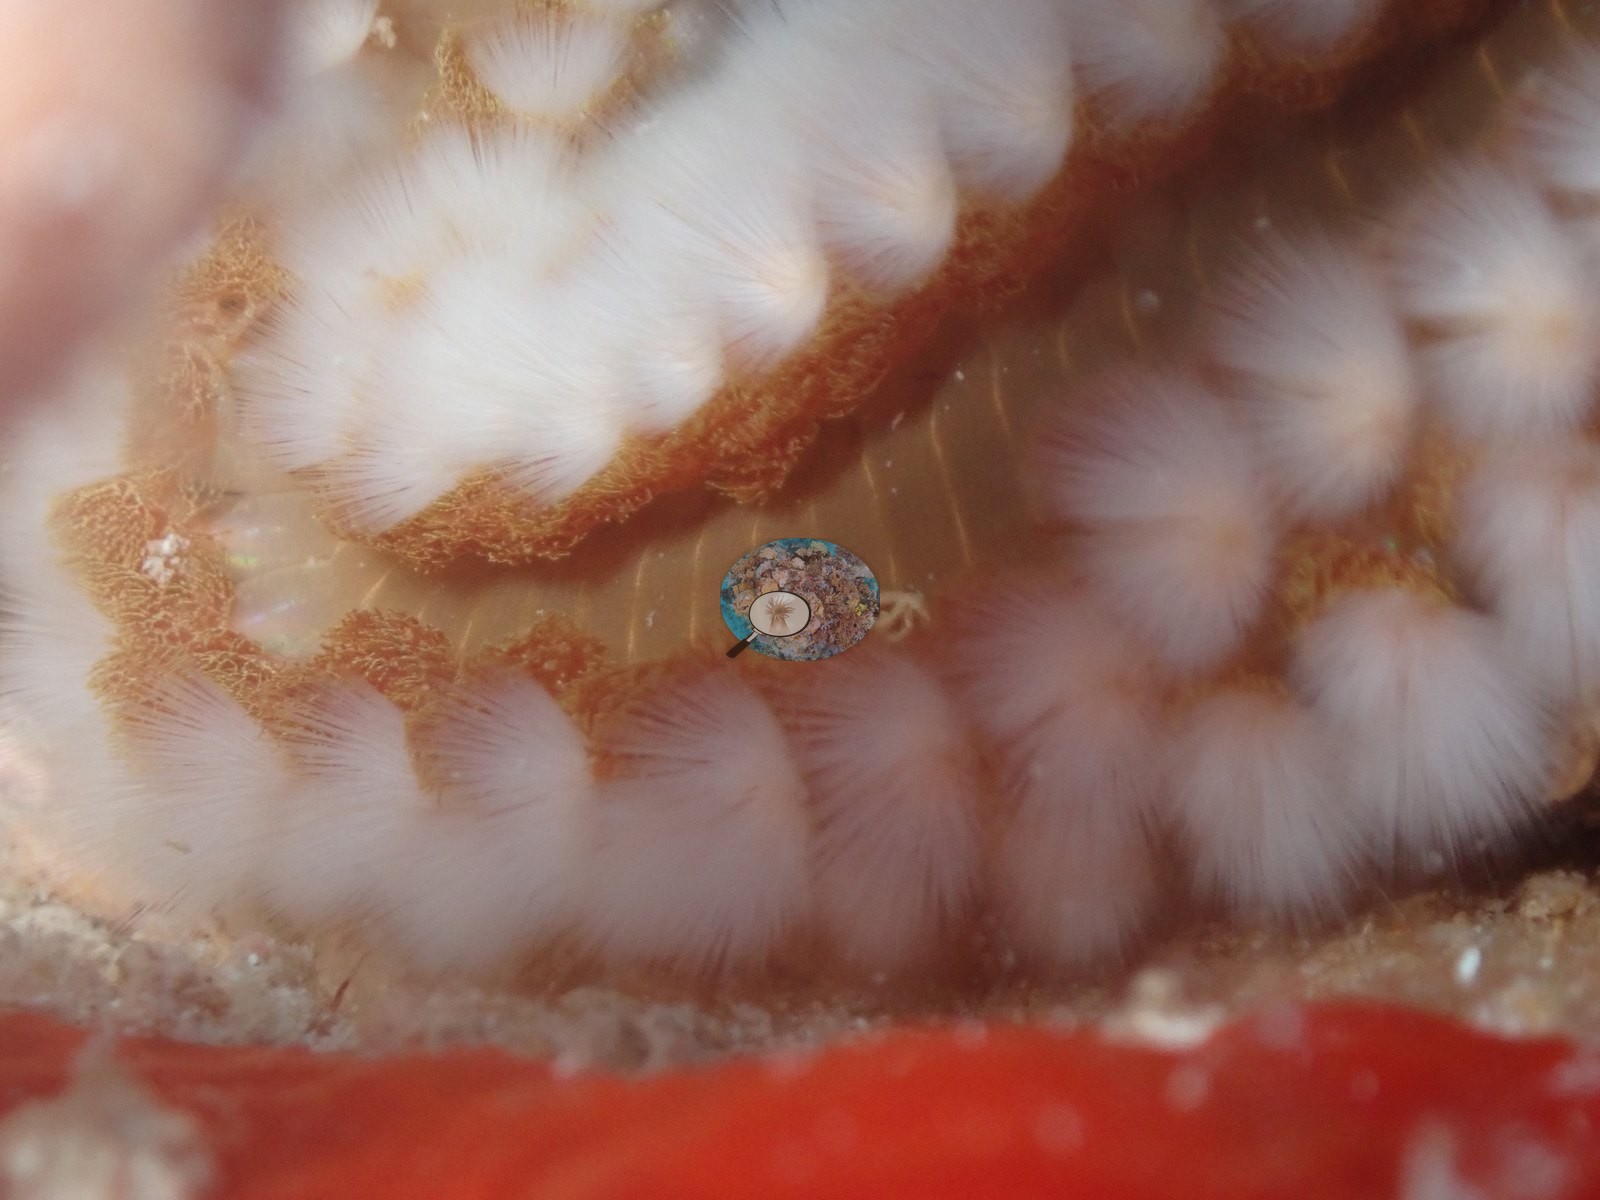
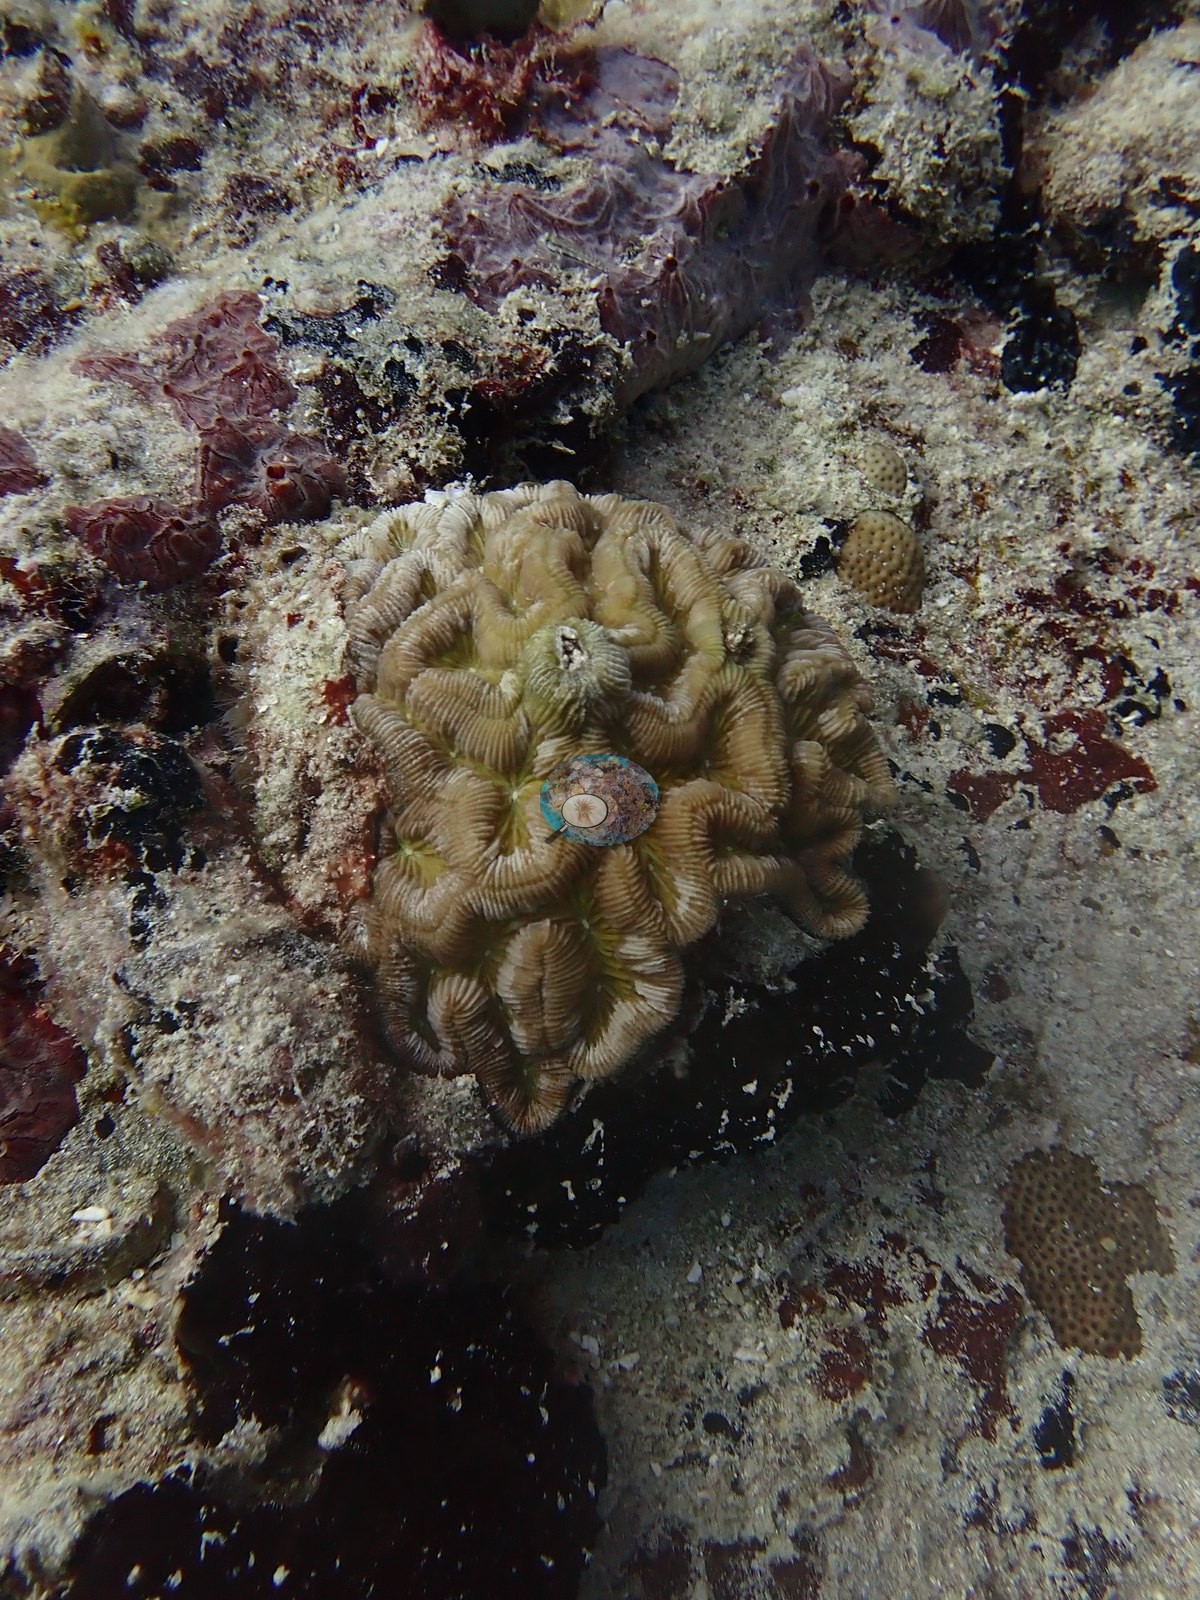
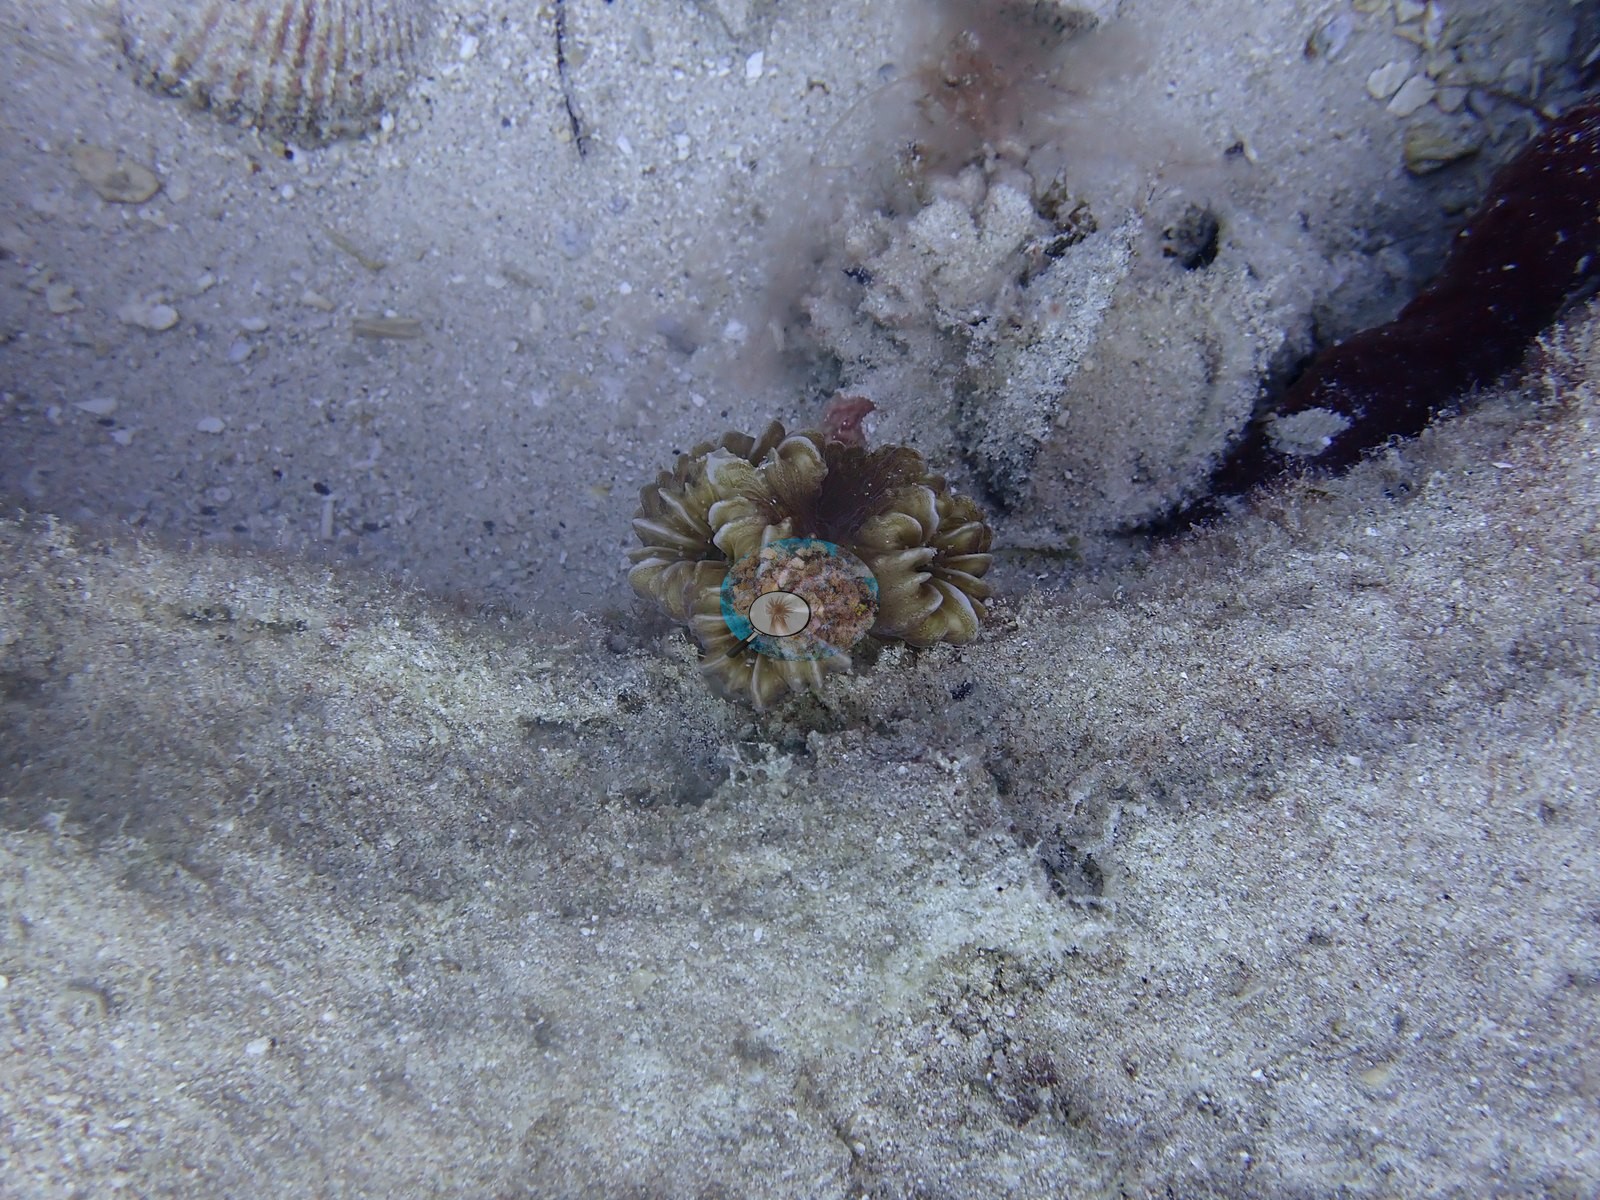
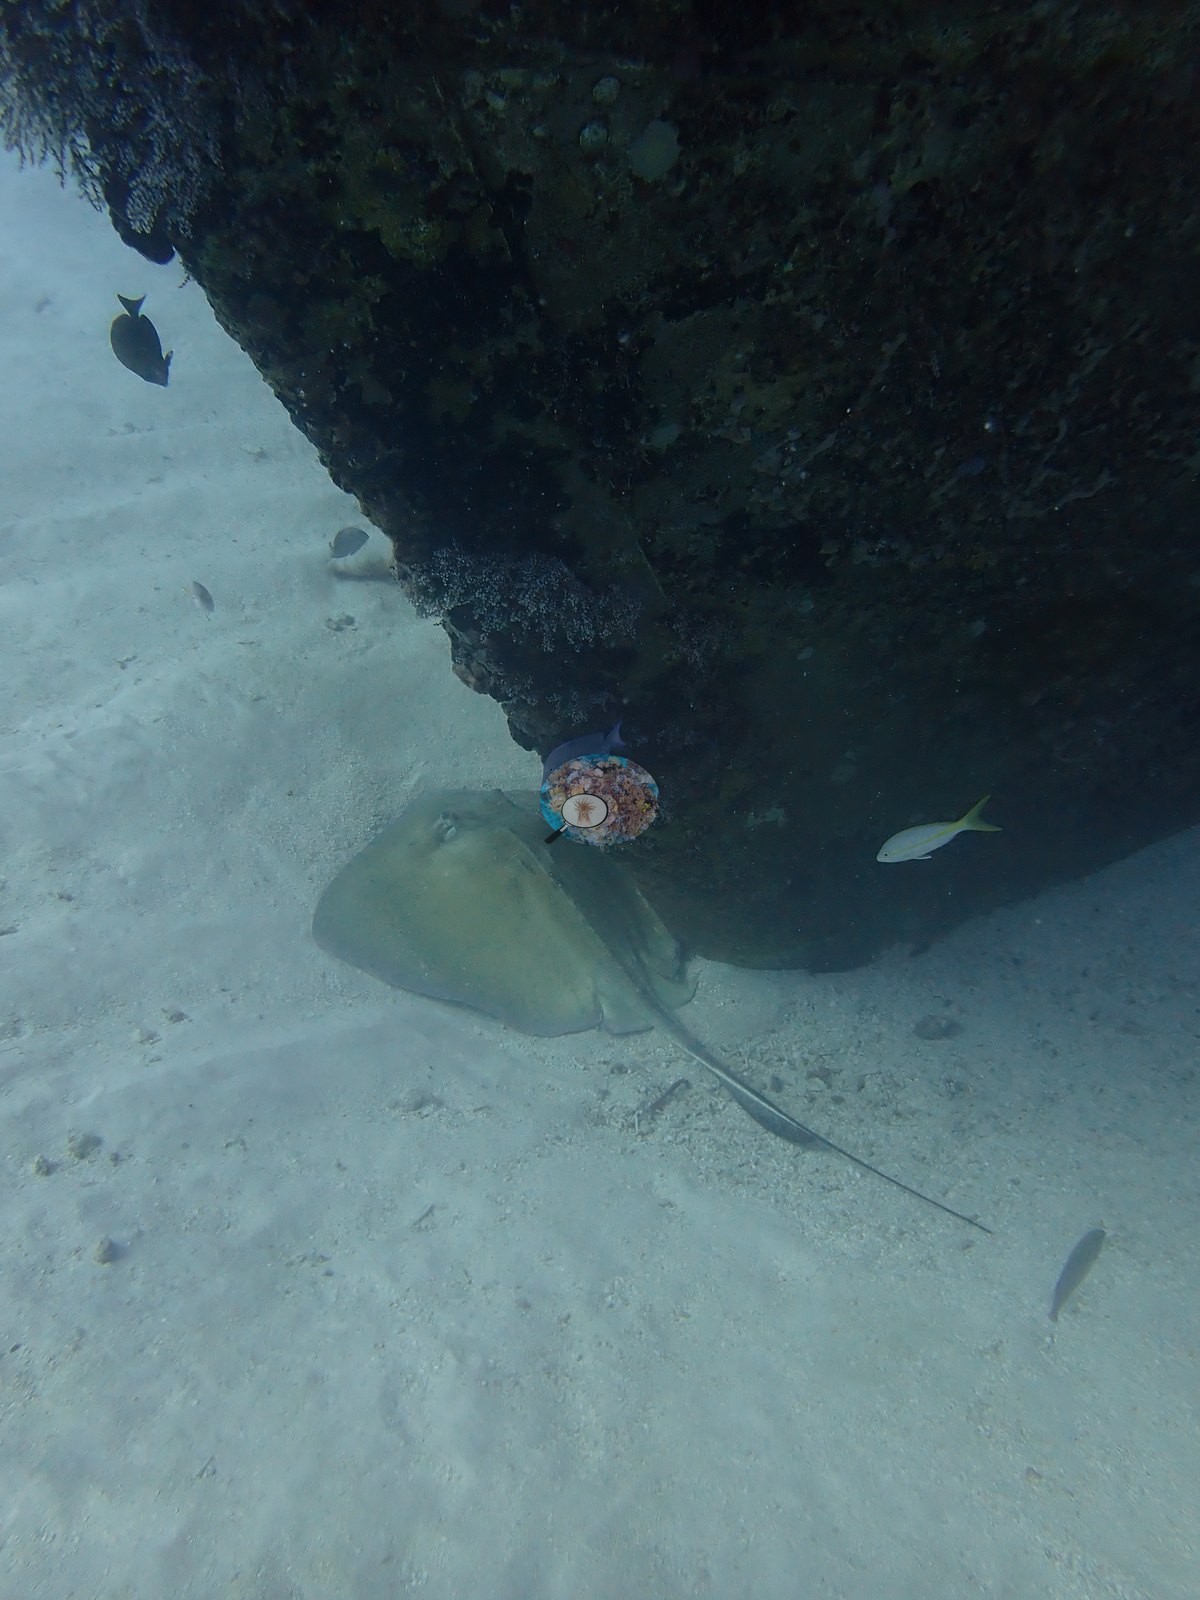
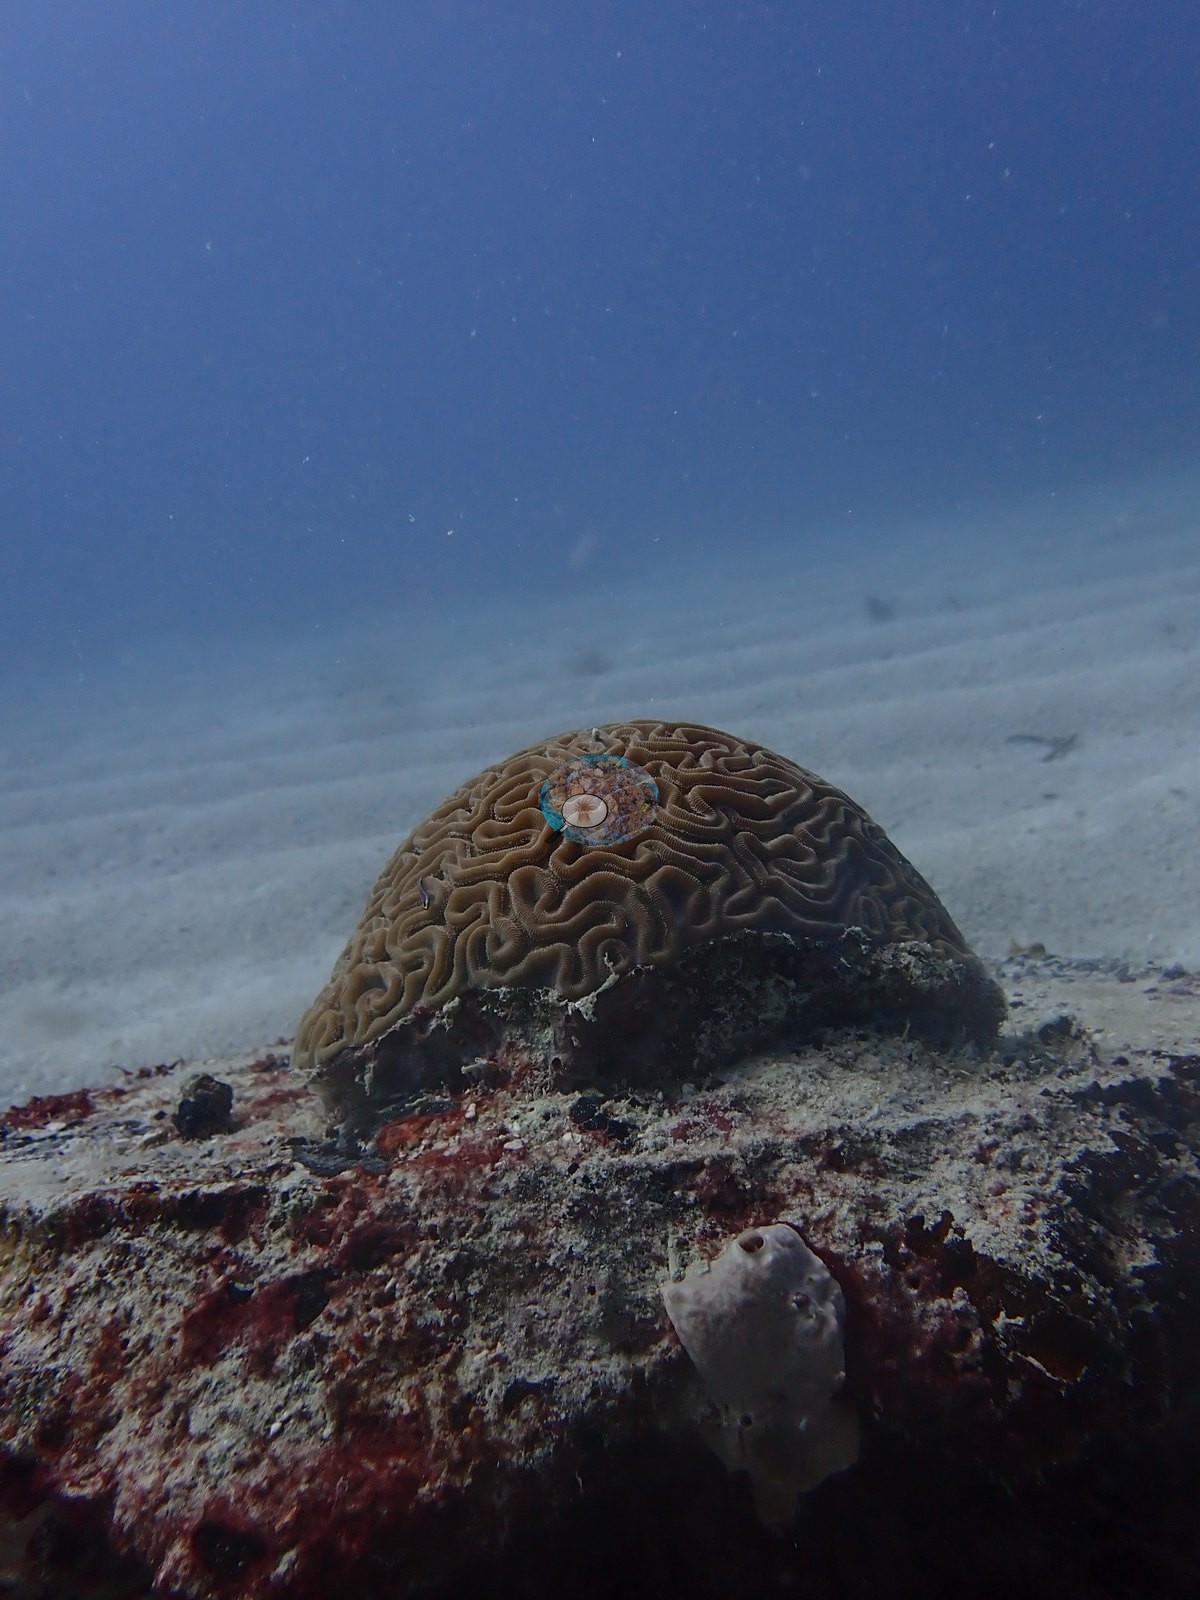
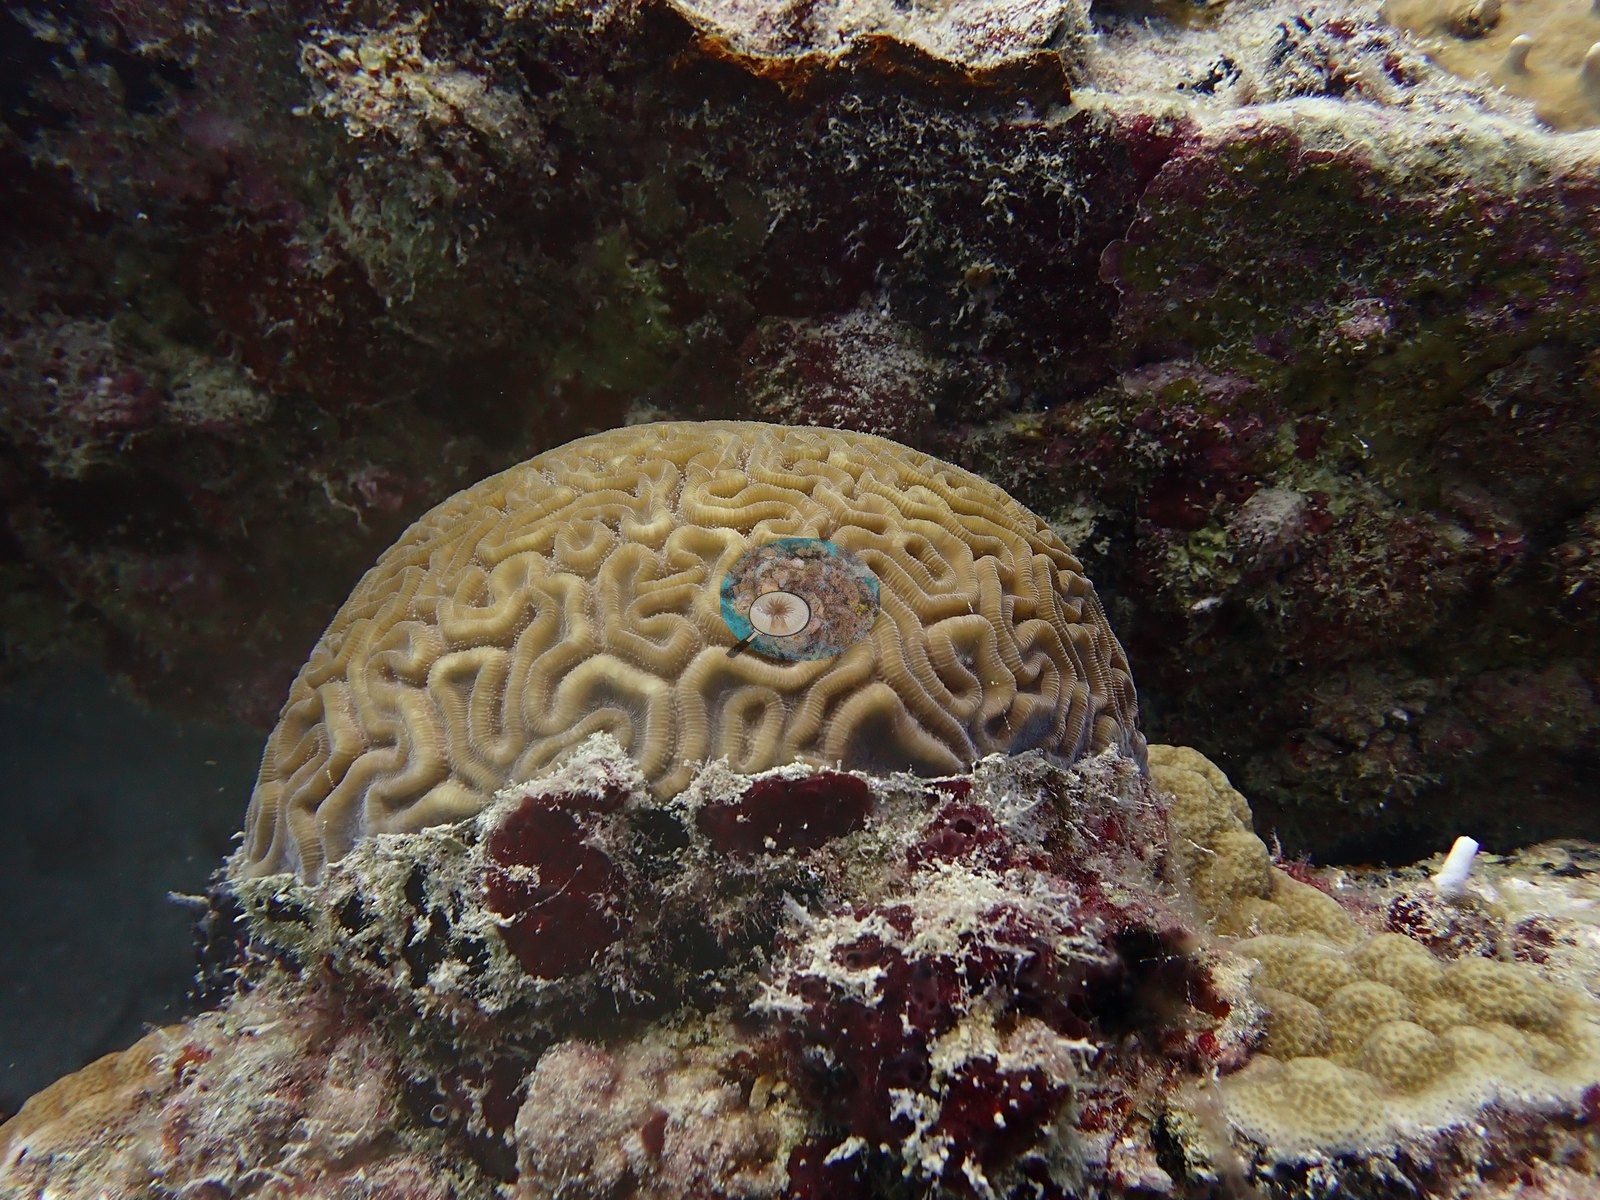
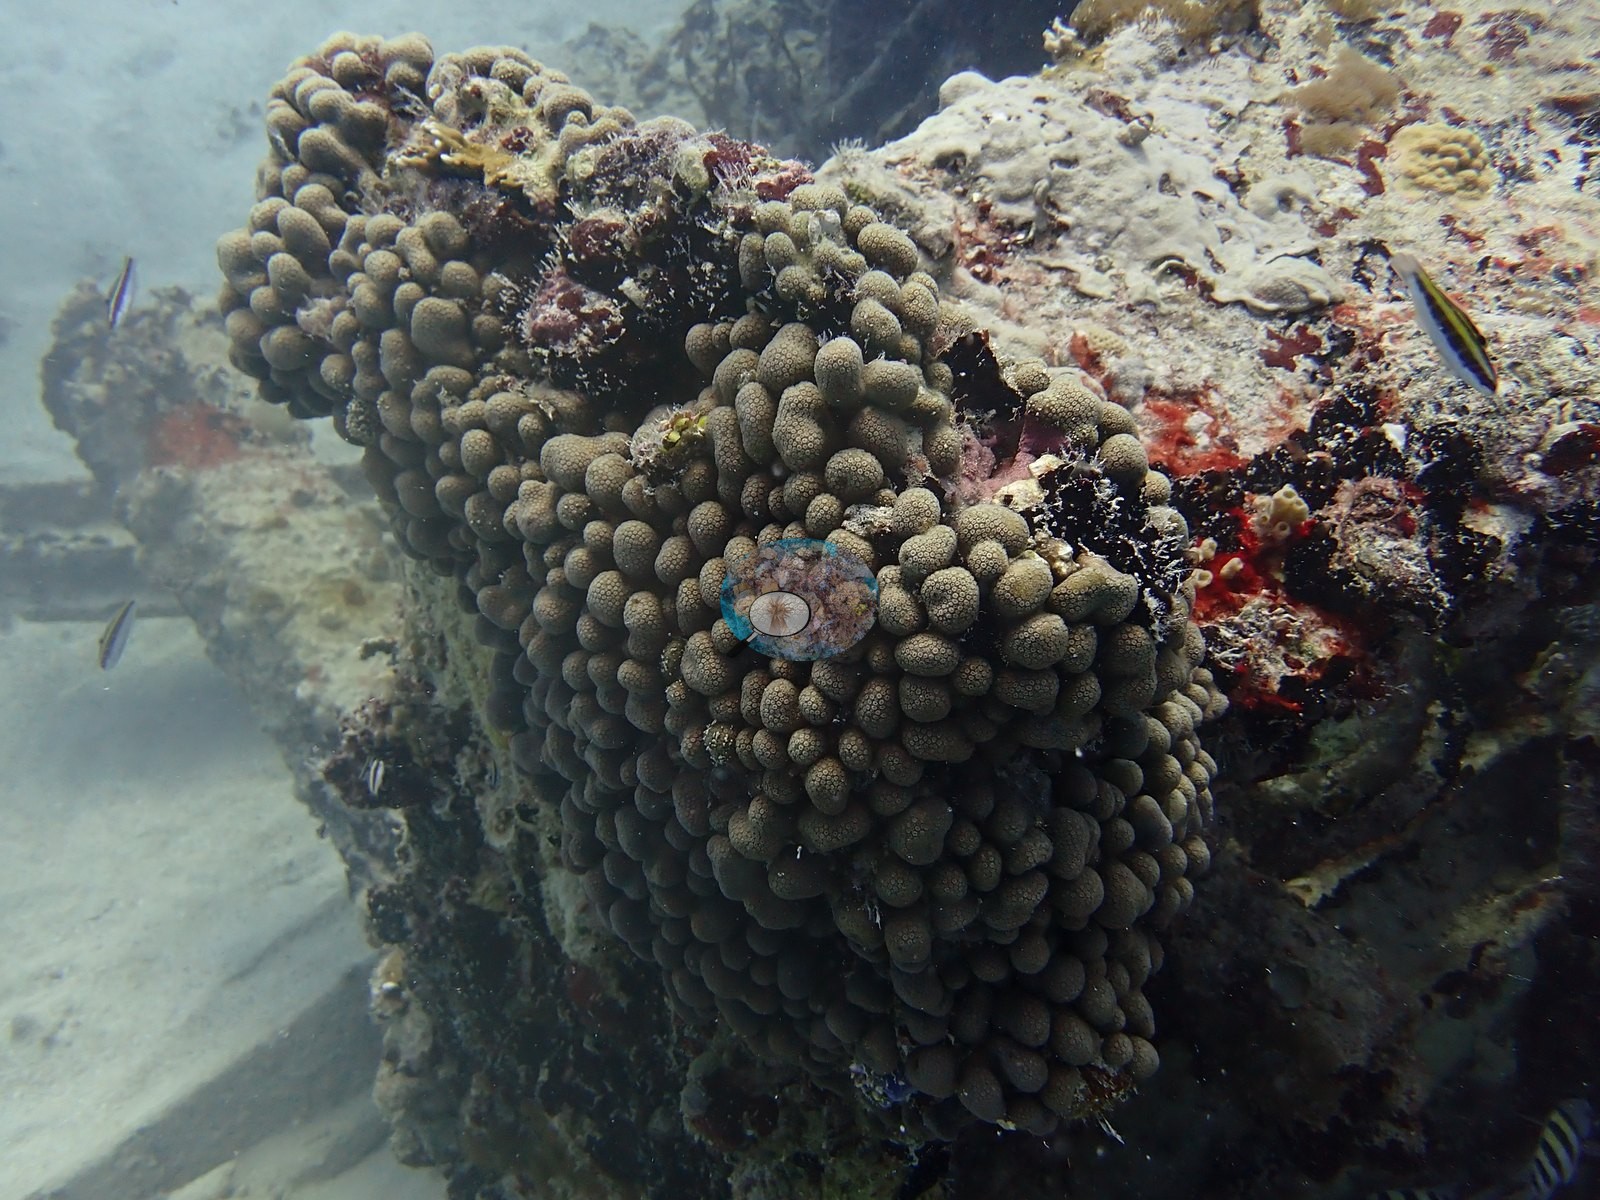
Chunky brain corals and boulder corals, likely Montastraea, Orbicella, and Pseudodiploria, crowd both the rock and the human-made structure, while a lionfish lurks at the base of one piling and a ray glides past early in the dive (e.g., Image 10, Image 28, Image 36, Image 46, Image 52).
Coral cover
Coral cover: 6.2% — a blind Claude computer-vision point count of 108 of Anderson's unedited photographs (20 points per photo; water, fish, and obstructions excluded). Other computer-vision methods are listed in the method table. Wreck and artificial-structure site: this cover value counts coral growing on man-made structure (steel, concrete, wreck debris) and the bottom around it, so it isn't comparable with natural-reef cover or with regional averages.
Fish and other fauna
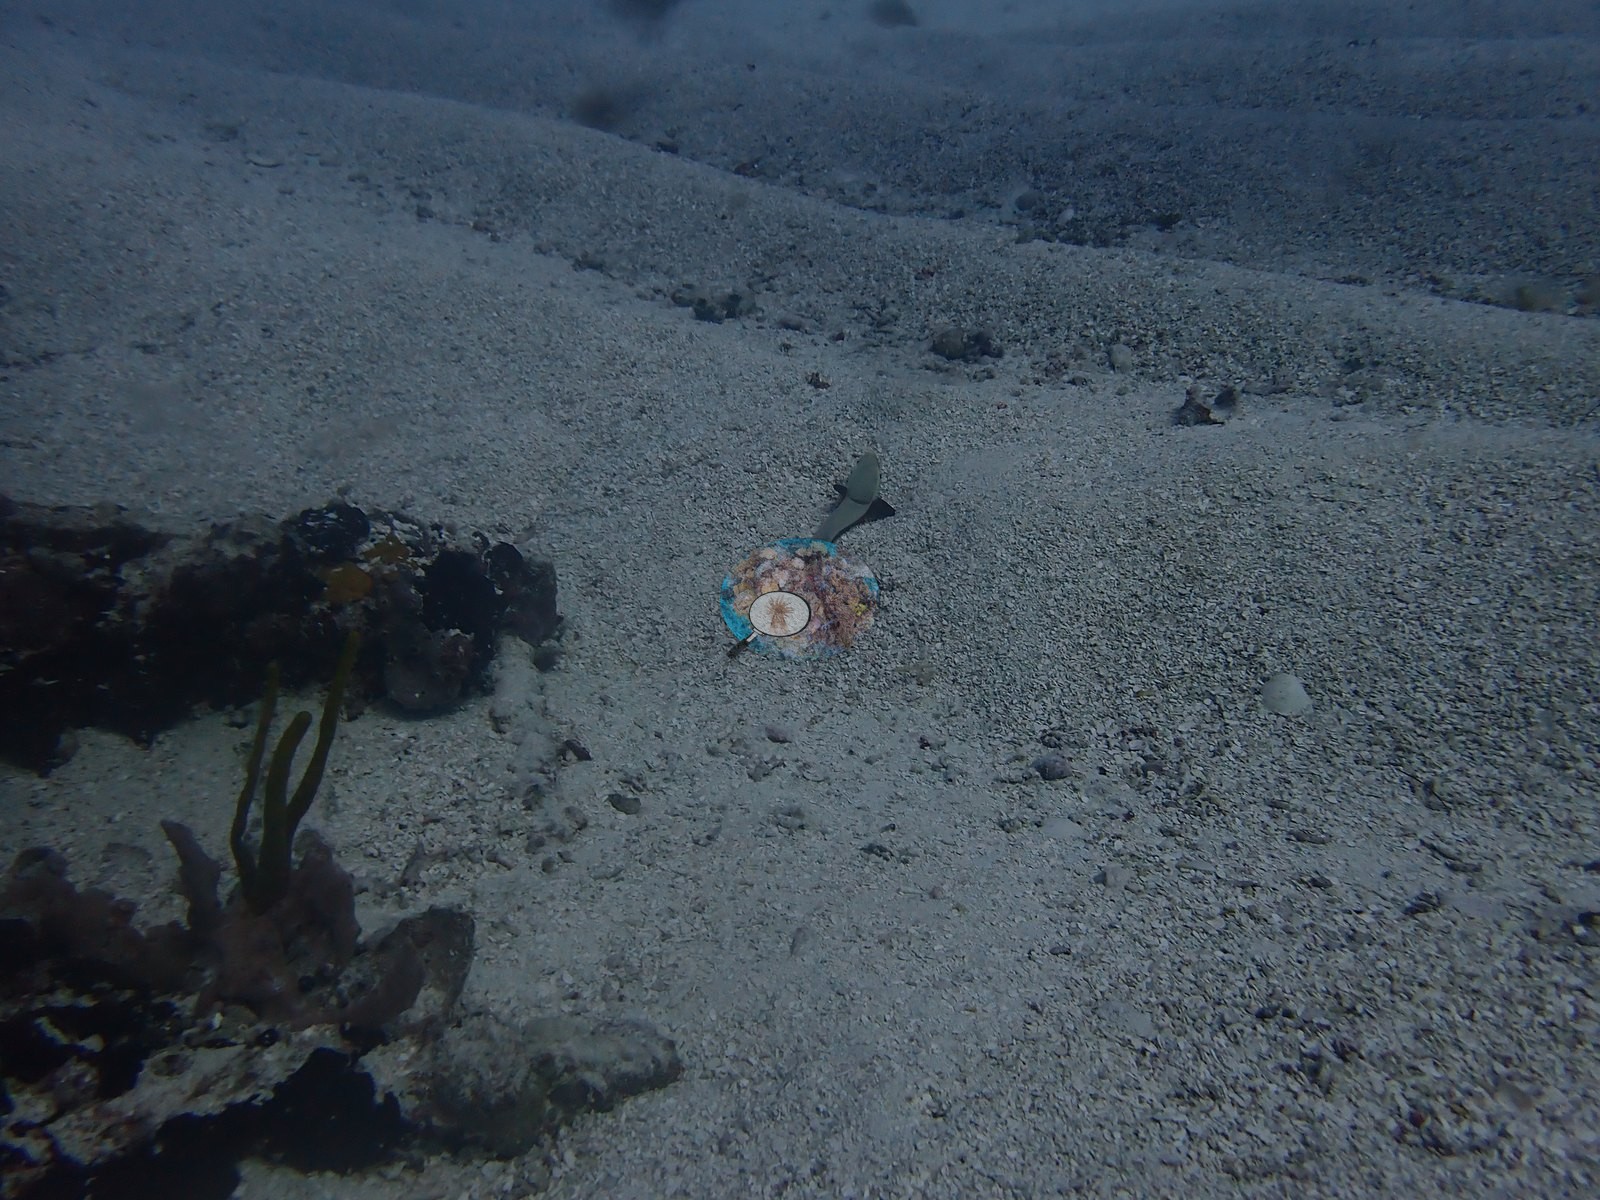
Peer into one of the rocky swim-throughs and a nurse shark may be tucked inside, with a pair of spiny lobsters sheltering beneath an overhang nearby.
Comparisons with other data
No independent survey was made at this exact site; the nearest ones are listed in the table below.
CV model comparison
More info
DINOv3 and CoralSCOP were run on the same photos and are listed for comparison. Coralscapes v2 and v1 were also run but are not shown: Anderson does not consider Coralscapes reliable for these photos. No diver transect exists for this trip, so agreement between the rows is not accuracy, and as of September 2026 no computer-vision method estimates coral cover accurately on new images; treat every row as indicative.| Method | Hard-coral cover (%) |
|---|---|
| In-house DINOv3 | 14.7 |
| CoralSCOP unedited | 16.5 |
| Claude | 6.2 |
Independent surveys nearby
Within 5 km, 2 independent survey stations recorded hard coral cover in 2013. The most recent nearby survey is from 2013, so these values predate recent heat stress. This site's own estimate (6.2%) is indistinguishable from the range of these surveys (2.7–2.8%): the 3.4-point gap is inside the ±7 percentage-point noise between methods; the methods differ, so the comparison is context, not a like-for-like test.
Collected by other programs using different methods (the XL Catlin Seaview Survey uses photo-transects with automated image annotation), so these are context for the figures above, not a like-for-like comparison. Where a station was surveyed more than once the range is shown. Station names are not dive-site names.
| Agency | Site / location | Date | Hard coral cover (%) | Distance | Link |
|---|---|---|---|---|---|
| XL Catlin Seaview Survey | transect 25024 | 2013 | 2.7% | 2.12 km | — |
| XL Catlin Seaview Survey | transect 25018 | 2013 | 2.8% | 4.78 km | — |
Data & links
All images from Coral Reef Diagnostics. Data are from Coral Reef Diagnostics and the organizations named in the data-sources table above.
© Coral Reef Diagnostics.