

King Reef (New Providence, west end)

More info
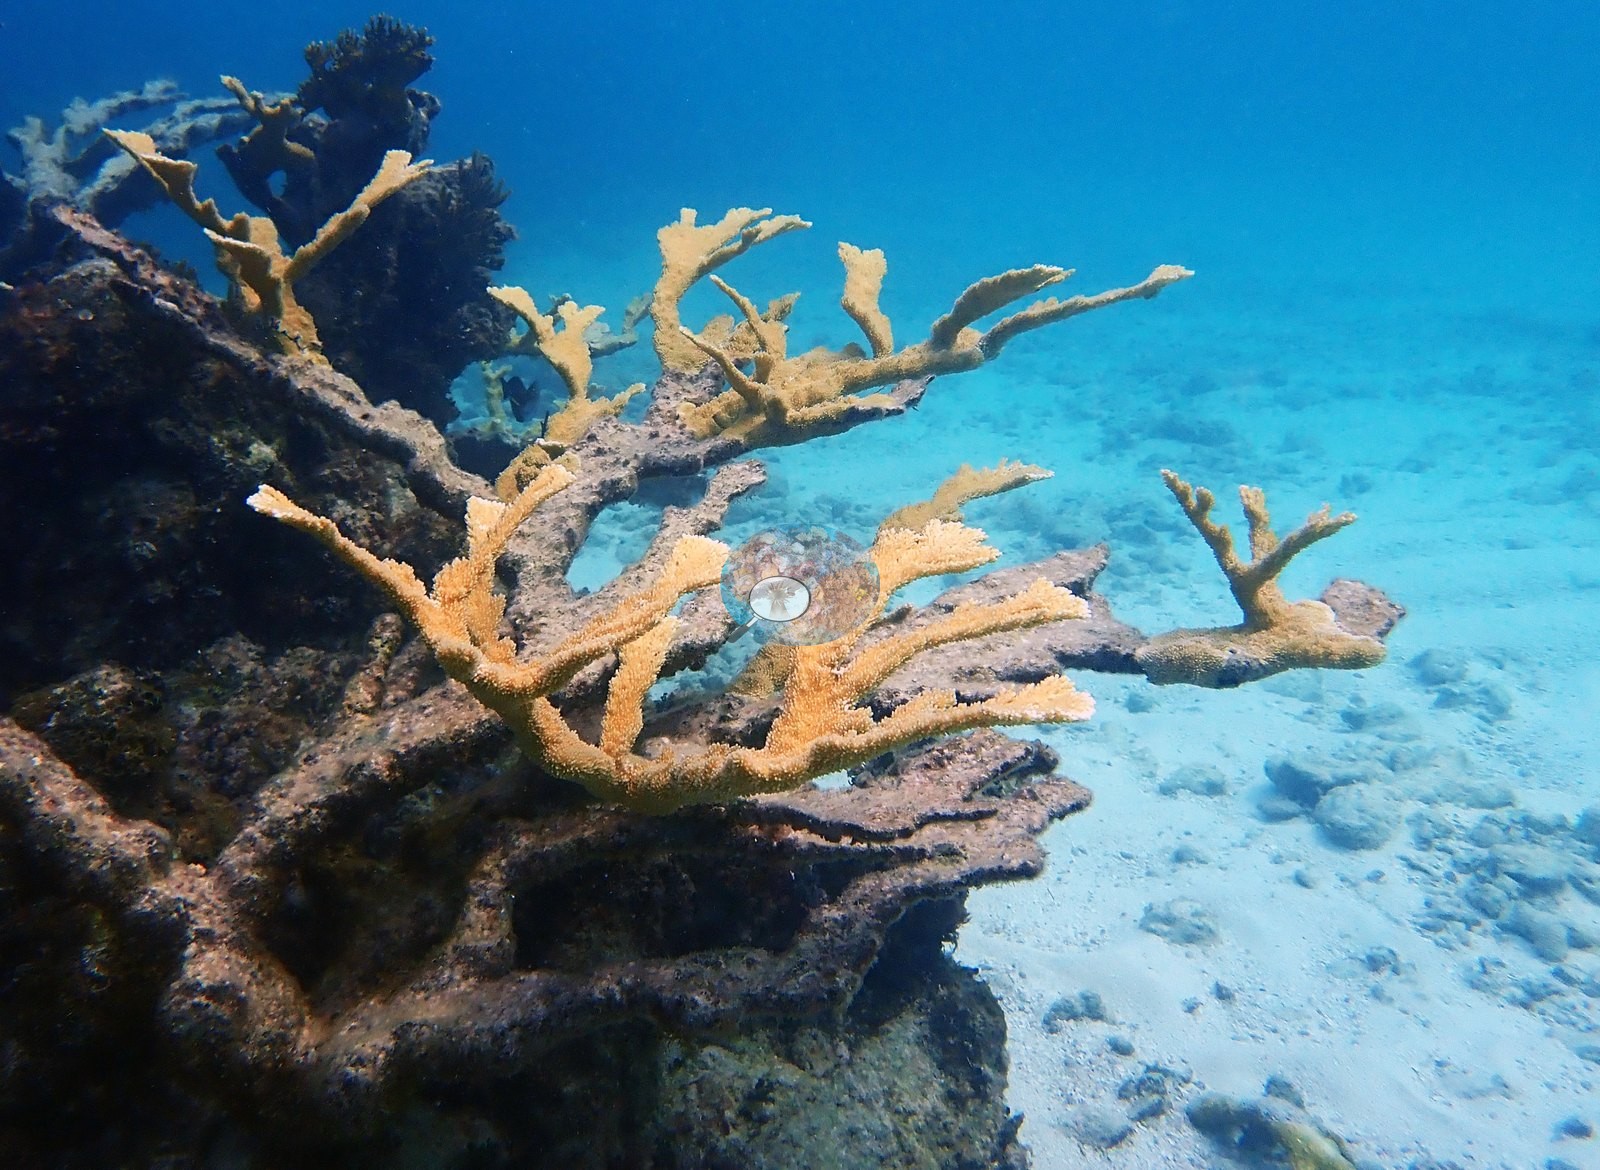
Central Bahamas (NOAA CRW virtual station)An elkhorn coral site where live Acropora palmata ranges from a very large colony and tall candelabra stands to a small recruit, side by side with standing dead elkhorn framework. Brain corals and gorgonians fill the low hardbottom between, and Anderson recorded one poritid colony as diseased; some star corals and a finger-branching colony are bleached in the photographs.
Seventeen independent survey stations shown with the program’s logo — click one to see how far it is from this site.
One other CRD dive site with its own page within 5 km shown in orange — click a marker to open its page.
This page shows 63 of the 73 photographs from this site, including every one the text cites.
Site description
Setting
King Reef lies off the west end of New Providence, about 2.4 km from Goulding Cay, which Anderson dived just before it on 13 October 2022; the map position is the GPS fix in the DiverLog record for this dive.
General benthic features
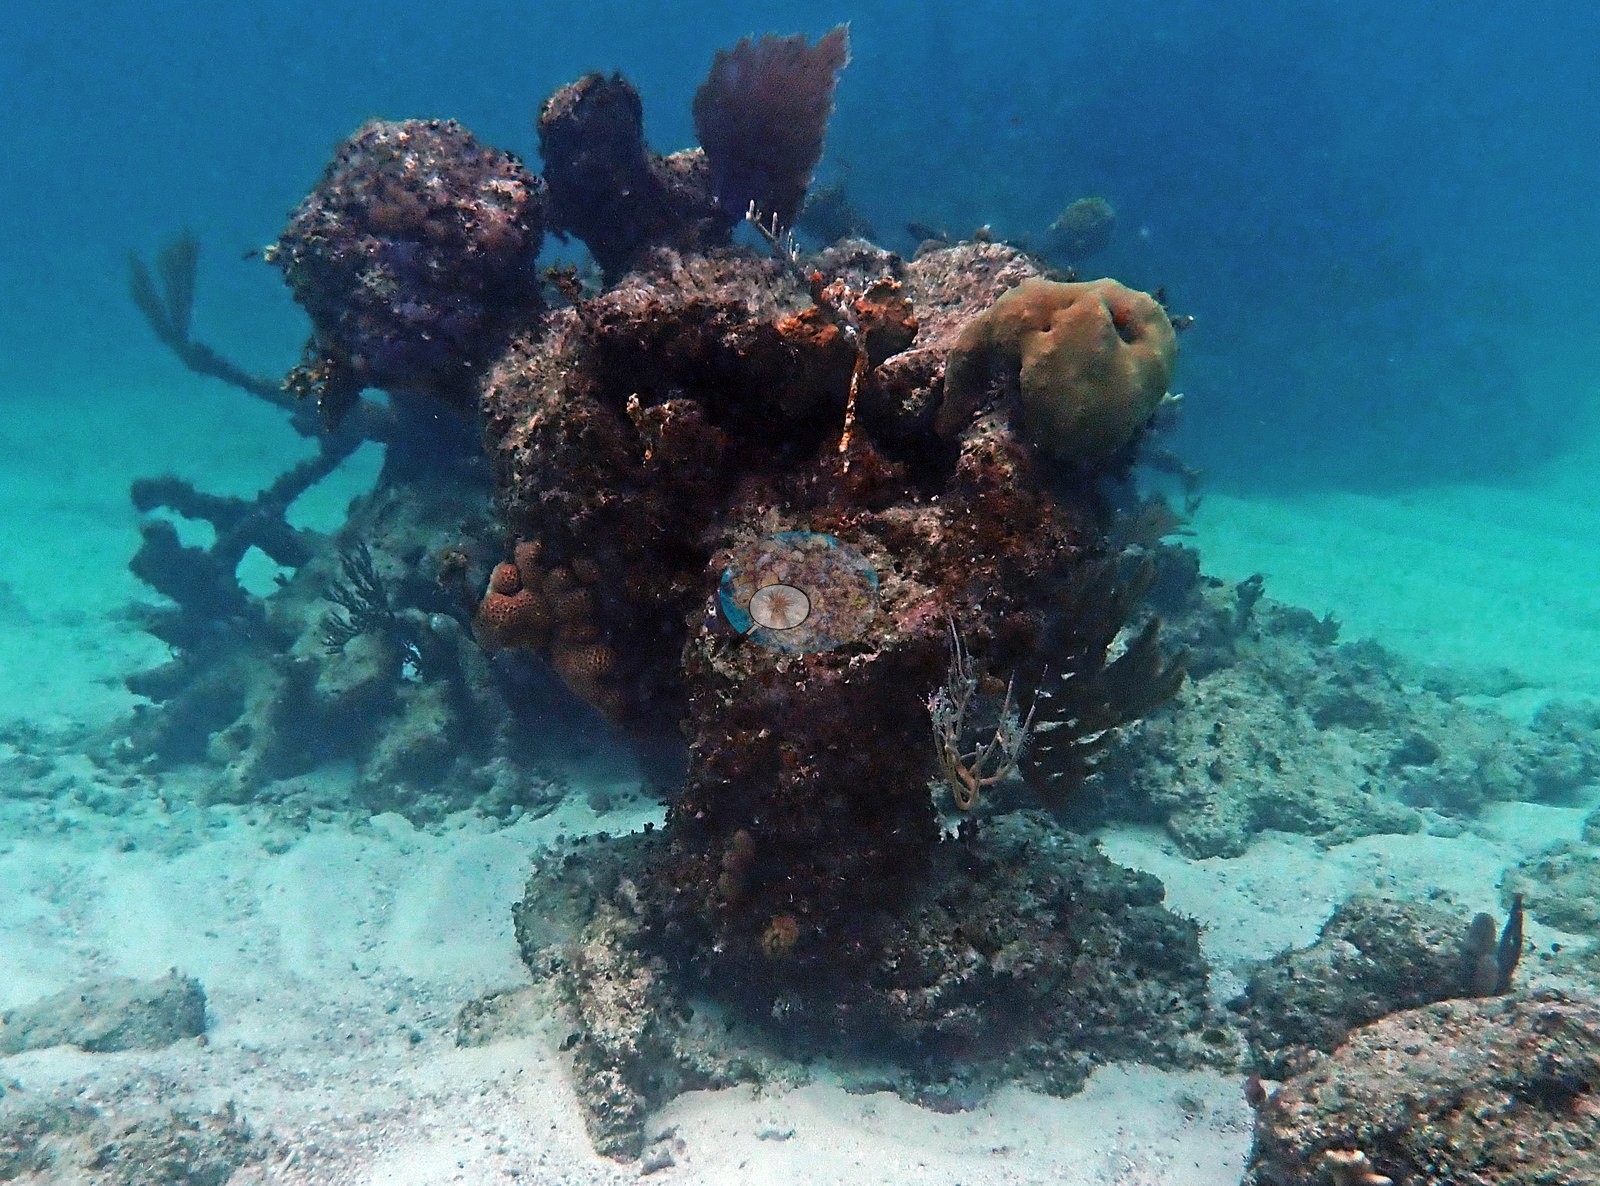
This is an elkhorn site, and the whole set turns on Acropora palmata (e.g., Image 48, Image 60, Image 71).
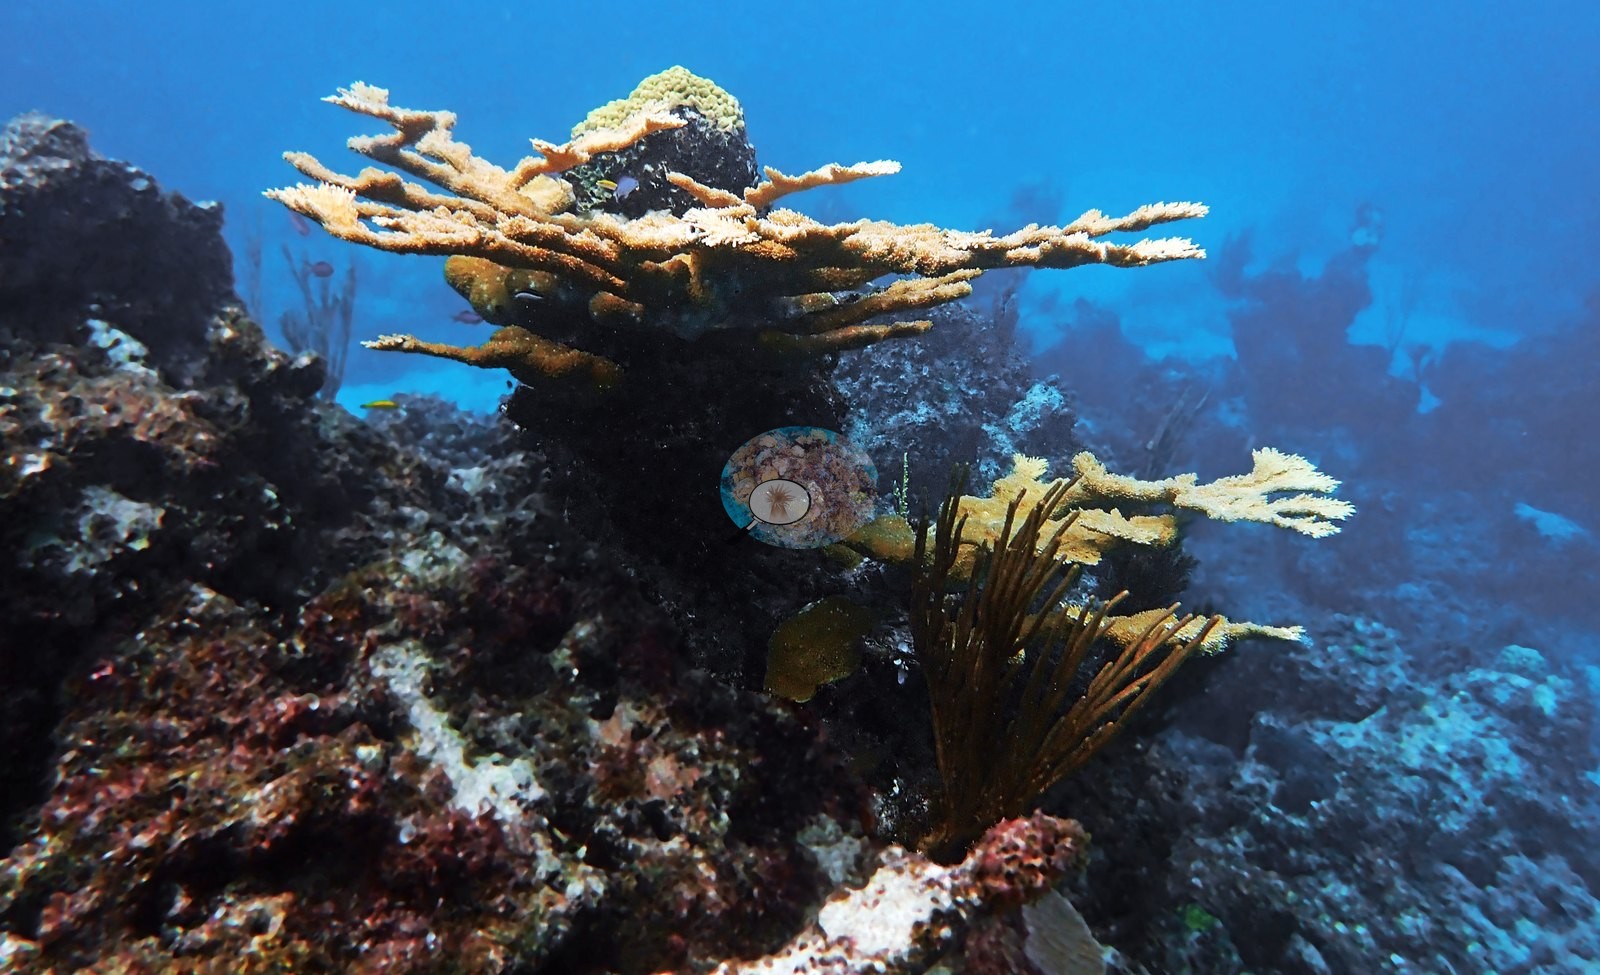
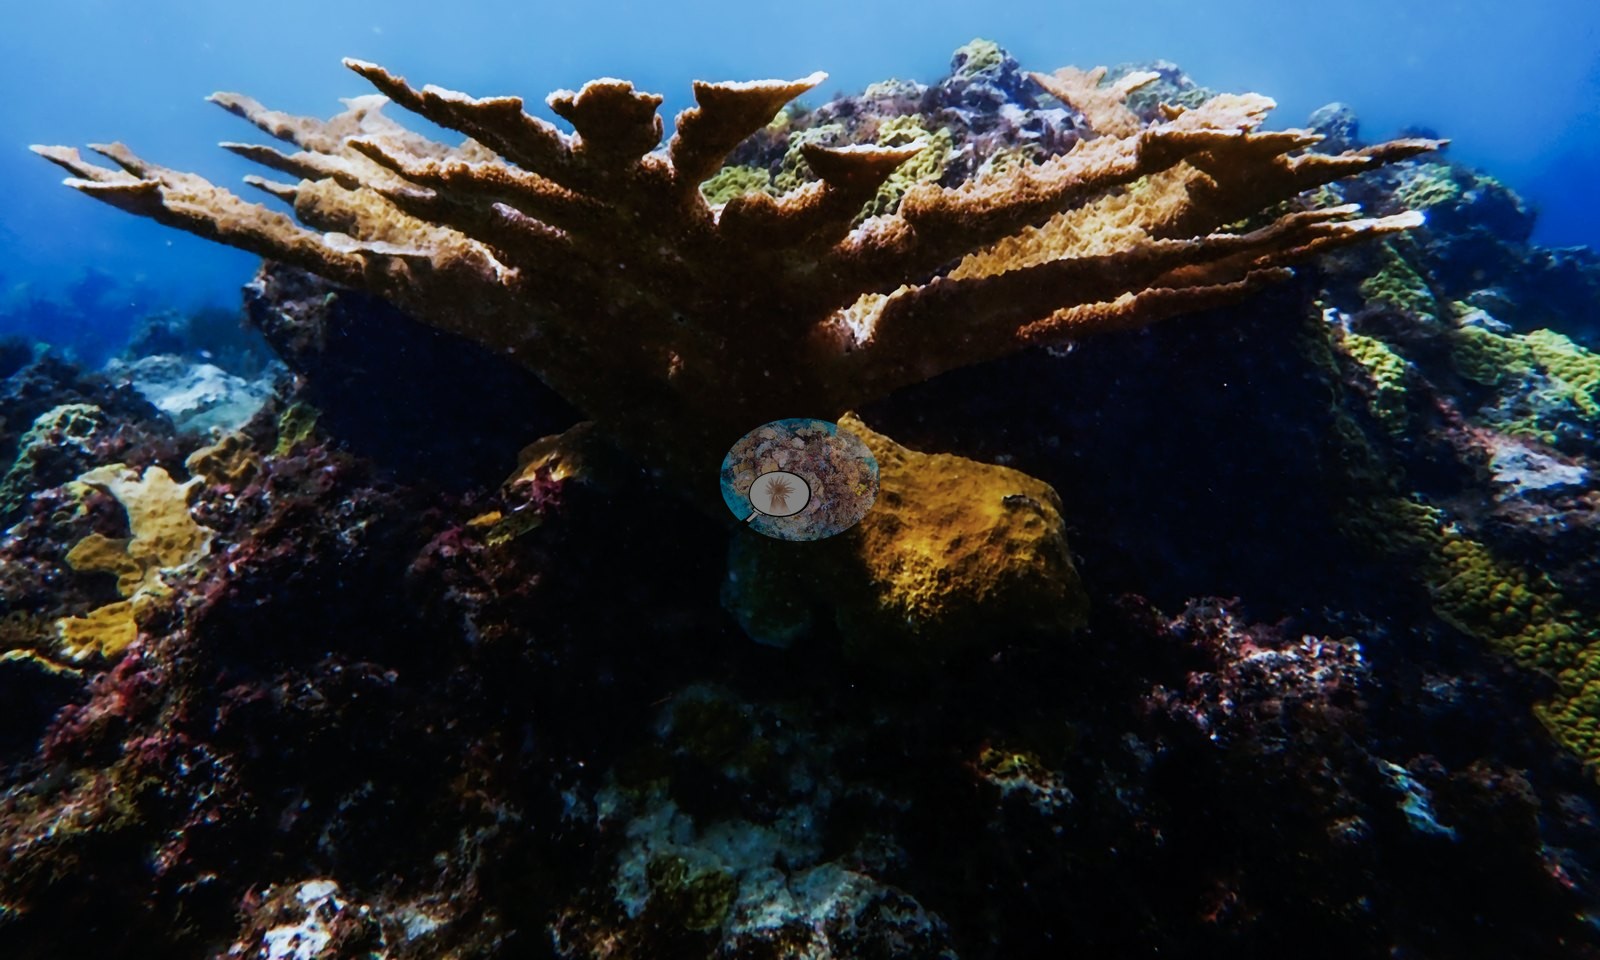
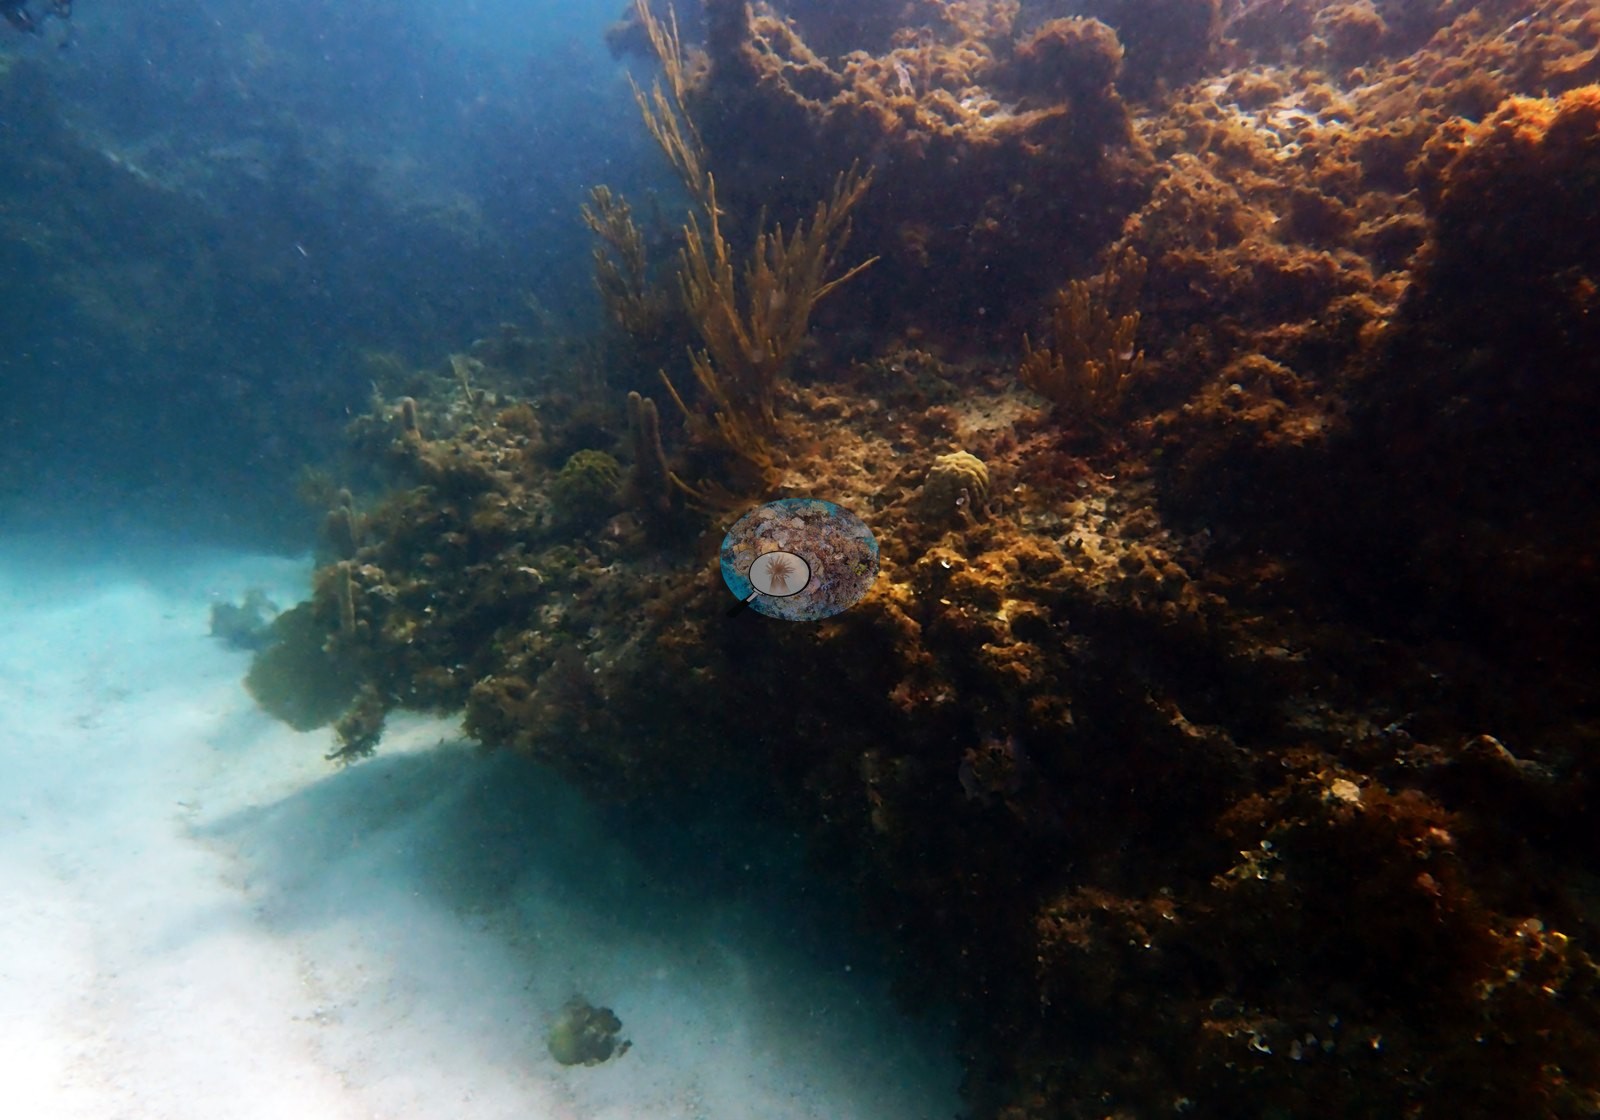
Live colonies are not incidental — they appear in something like a fifth of the frames. Broad golden-tan blades fan out over low hardbottom and white sand in Image 47, Image 48, Image 49, and Image 53; a spreading multi-branched colony stands clear of the bottom in Image 58, Image 61, Image 64, and Image 67; Image 60 and Image 71 show tall candelabra colonies with clean growing margins silhouetted against bright blue water; Image 65 catches a wide, densely branched colony from below.
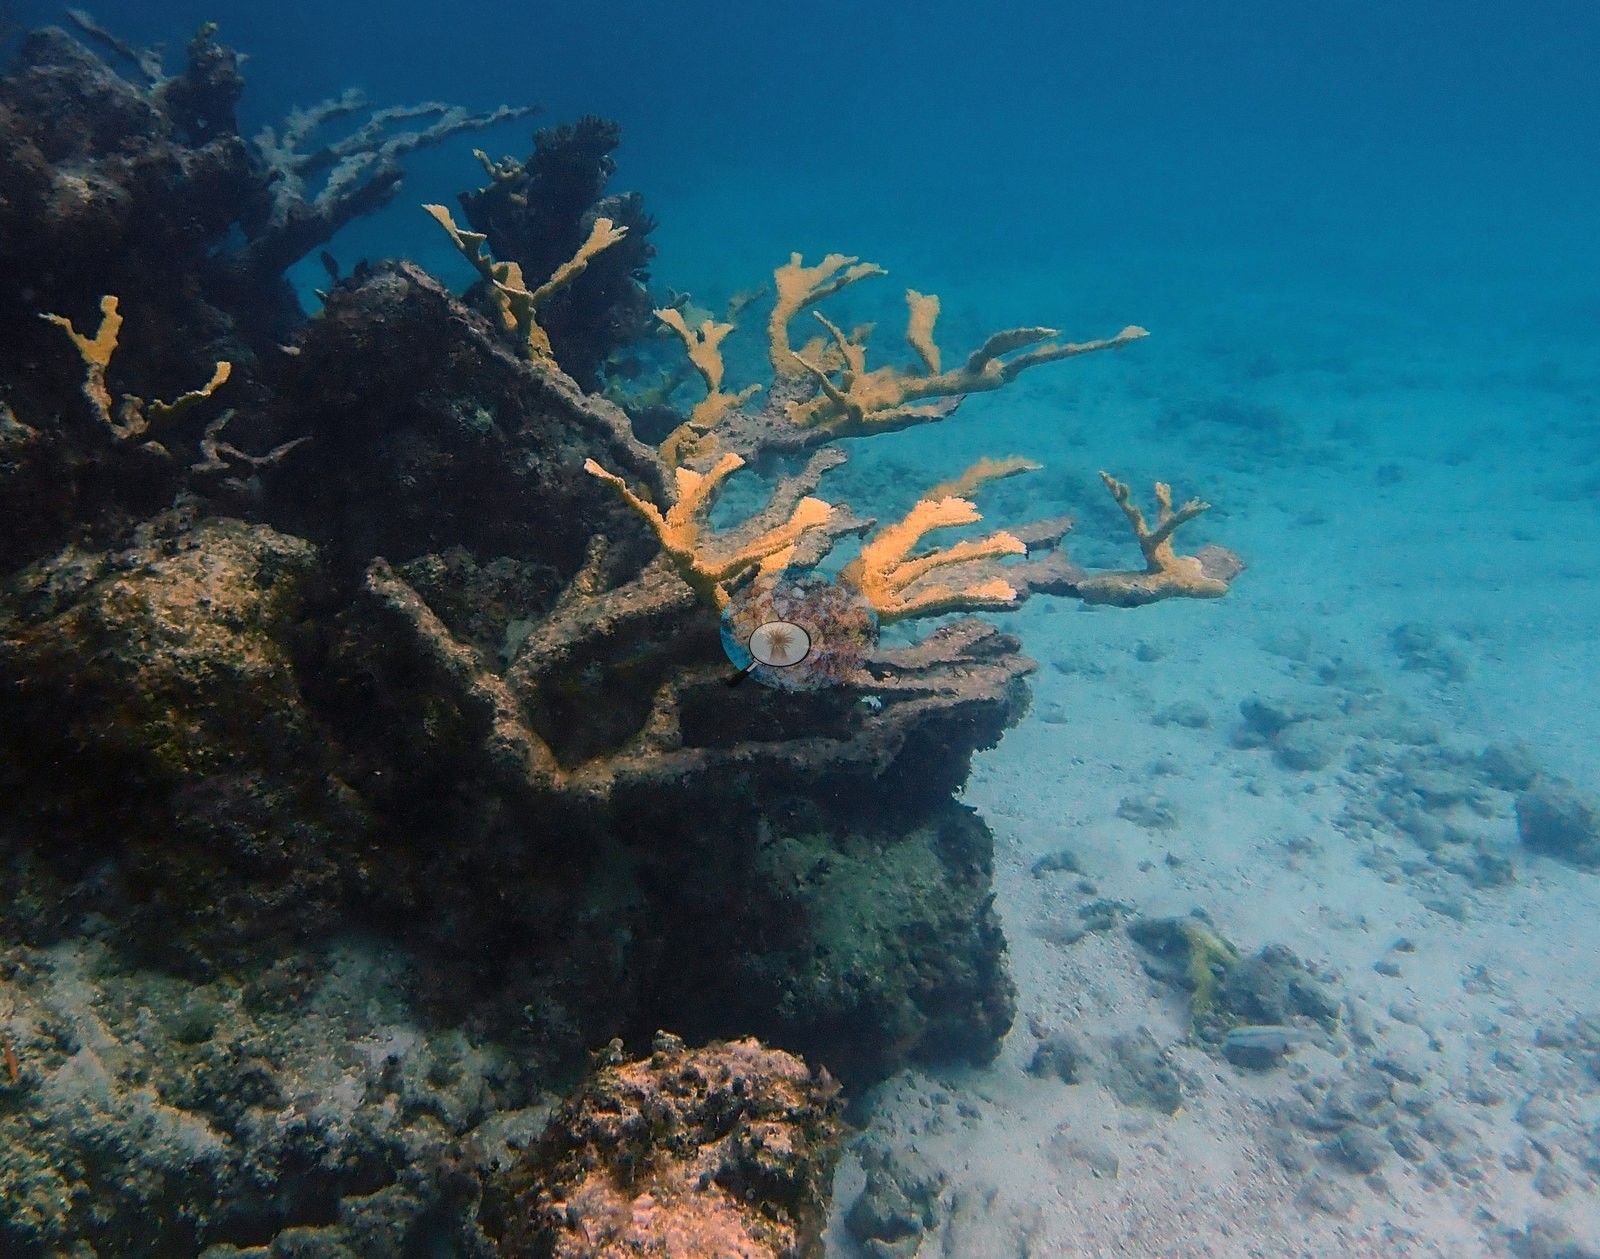
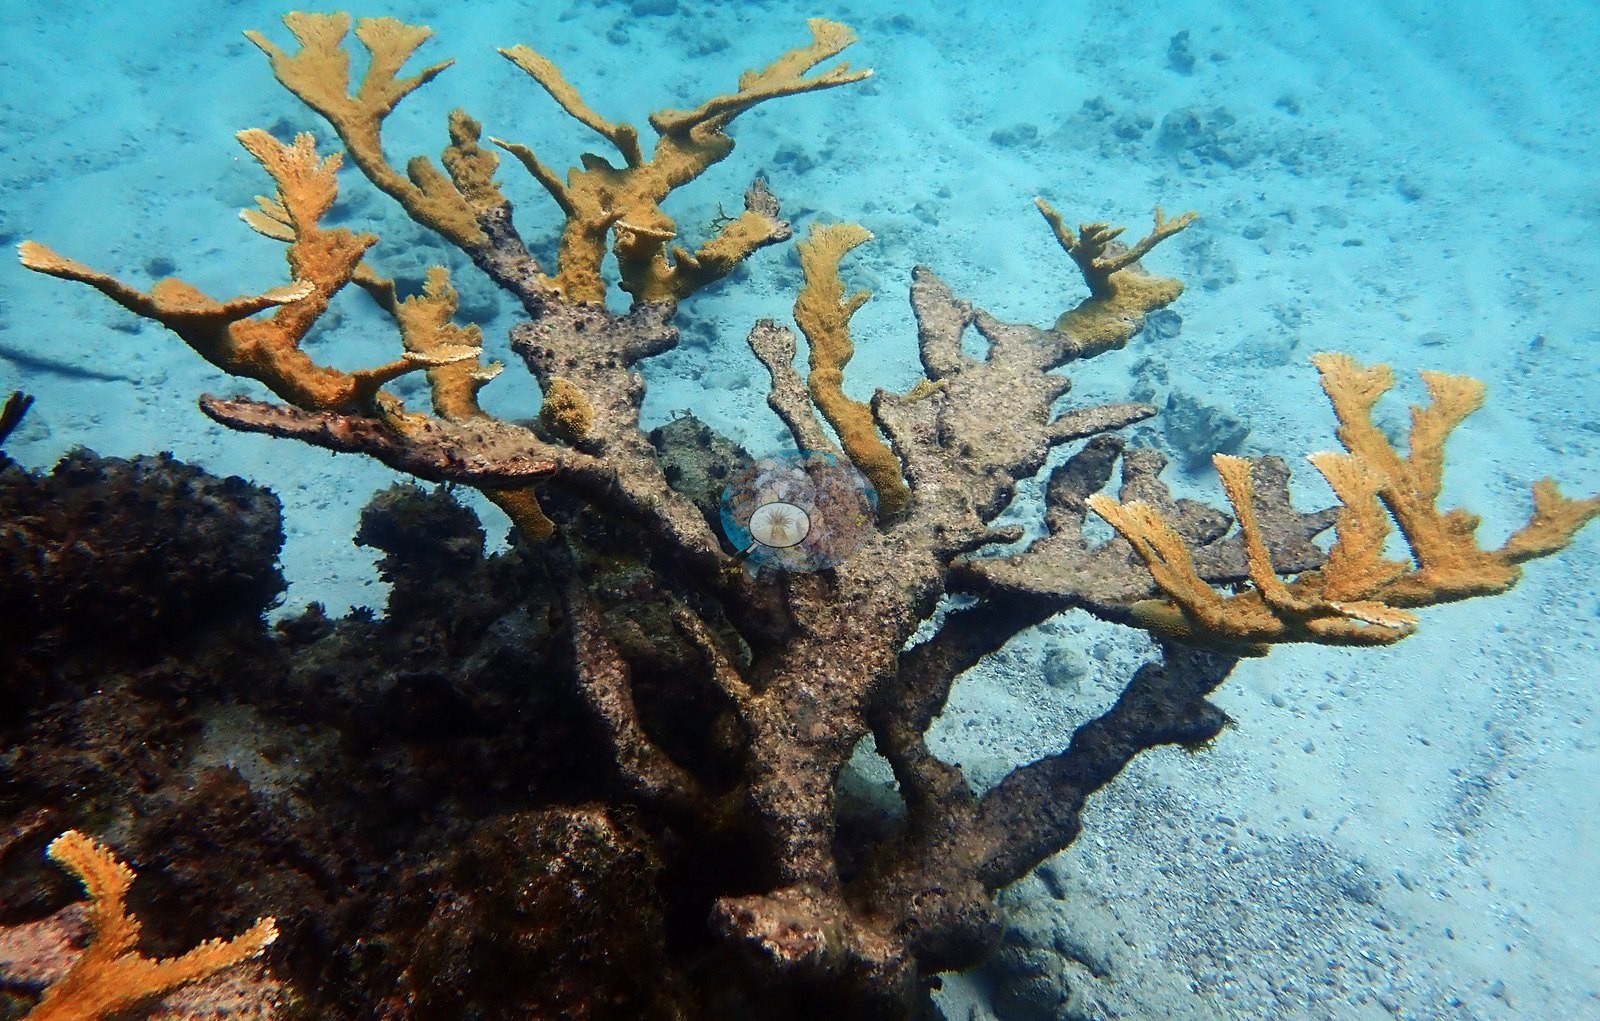
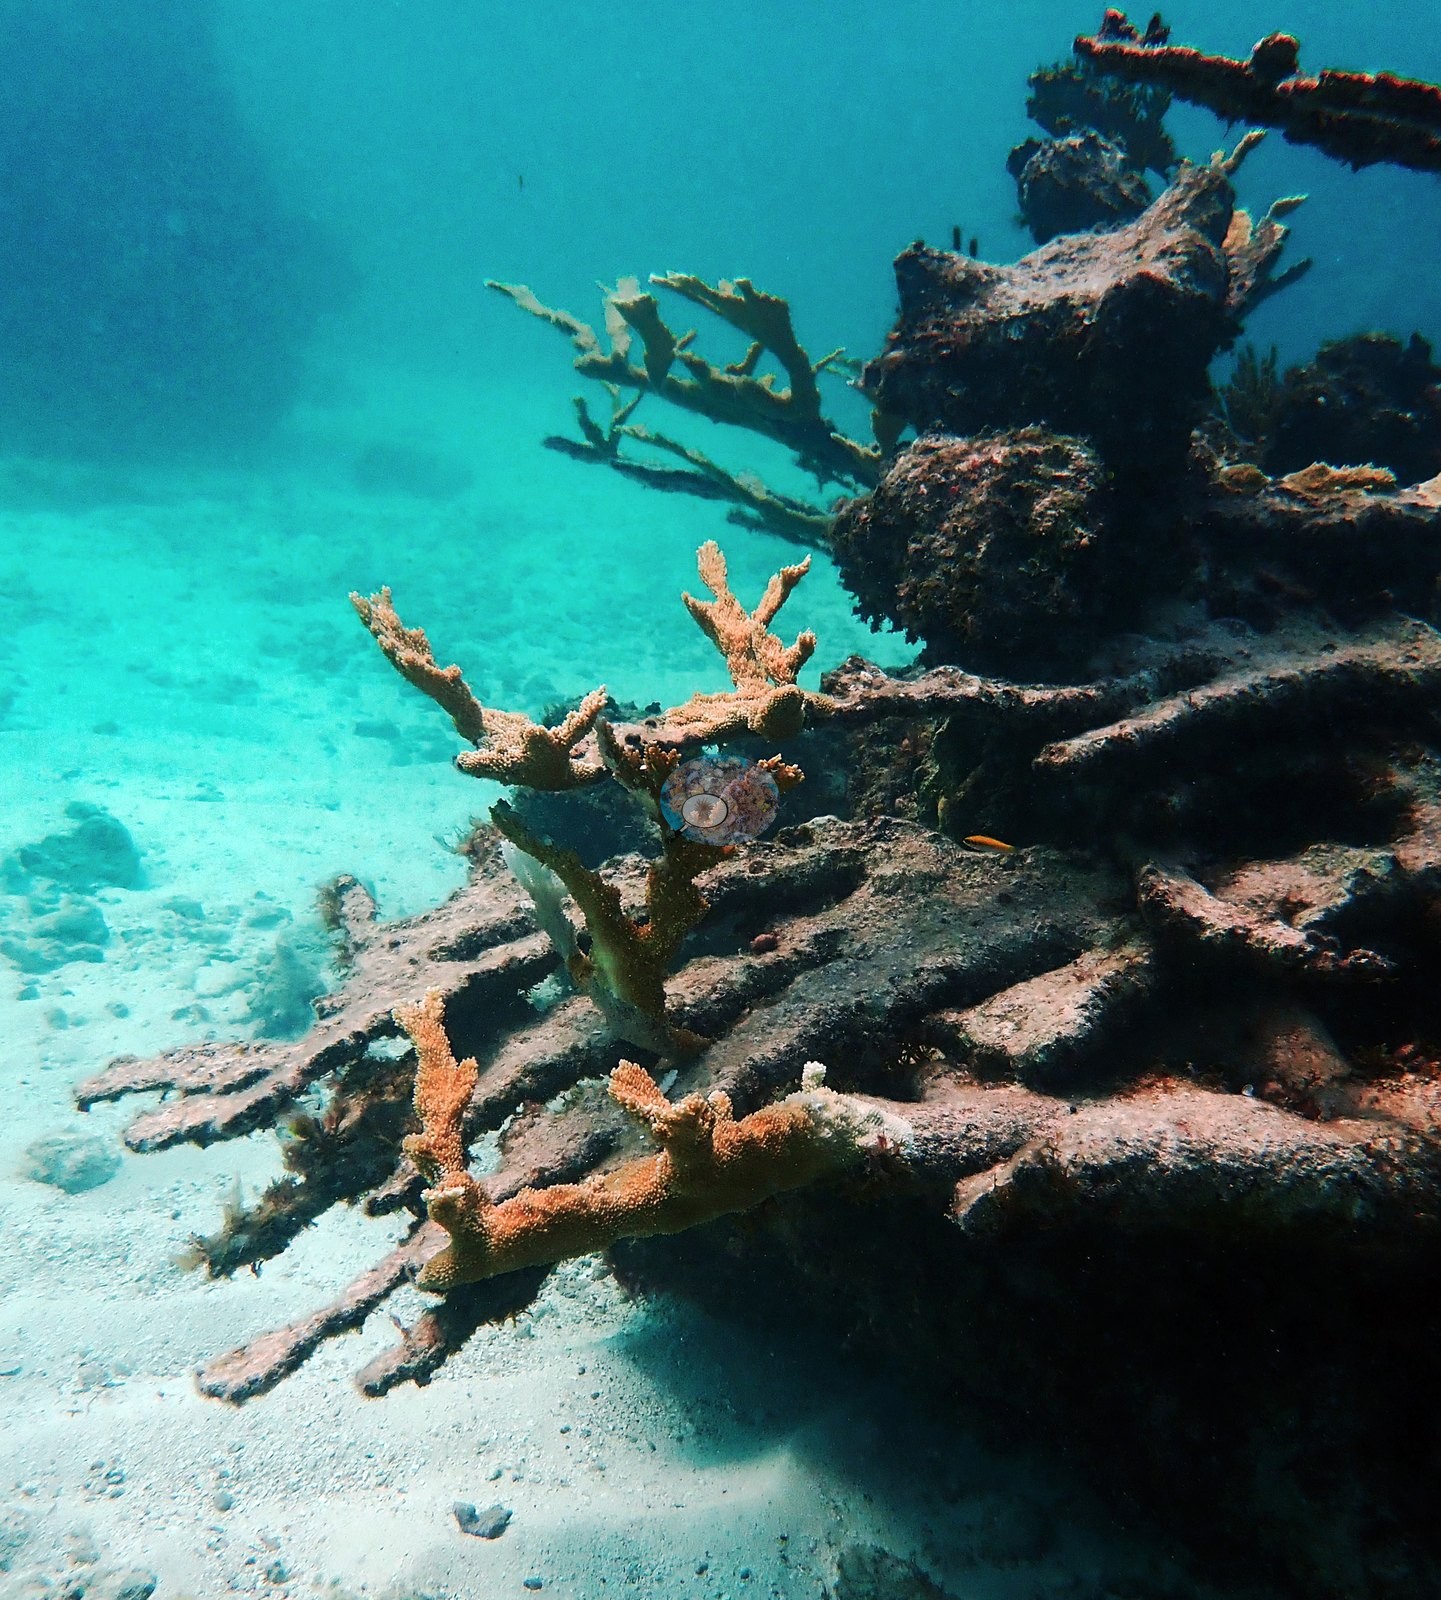
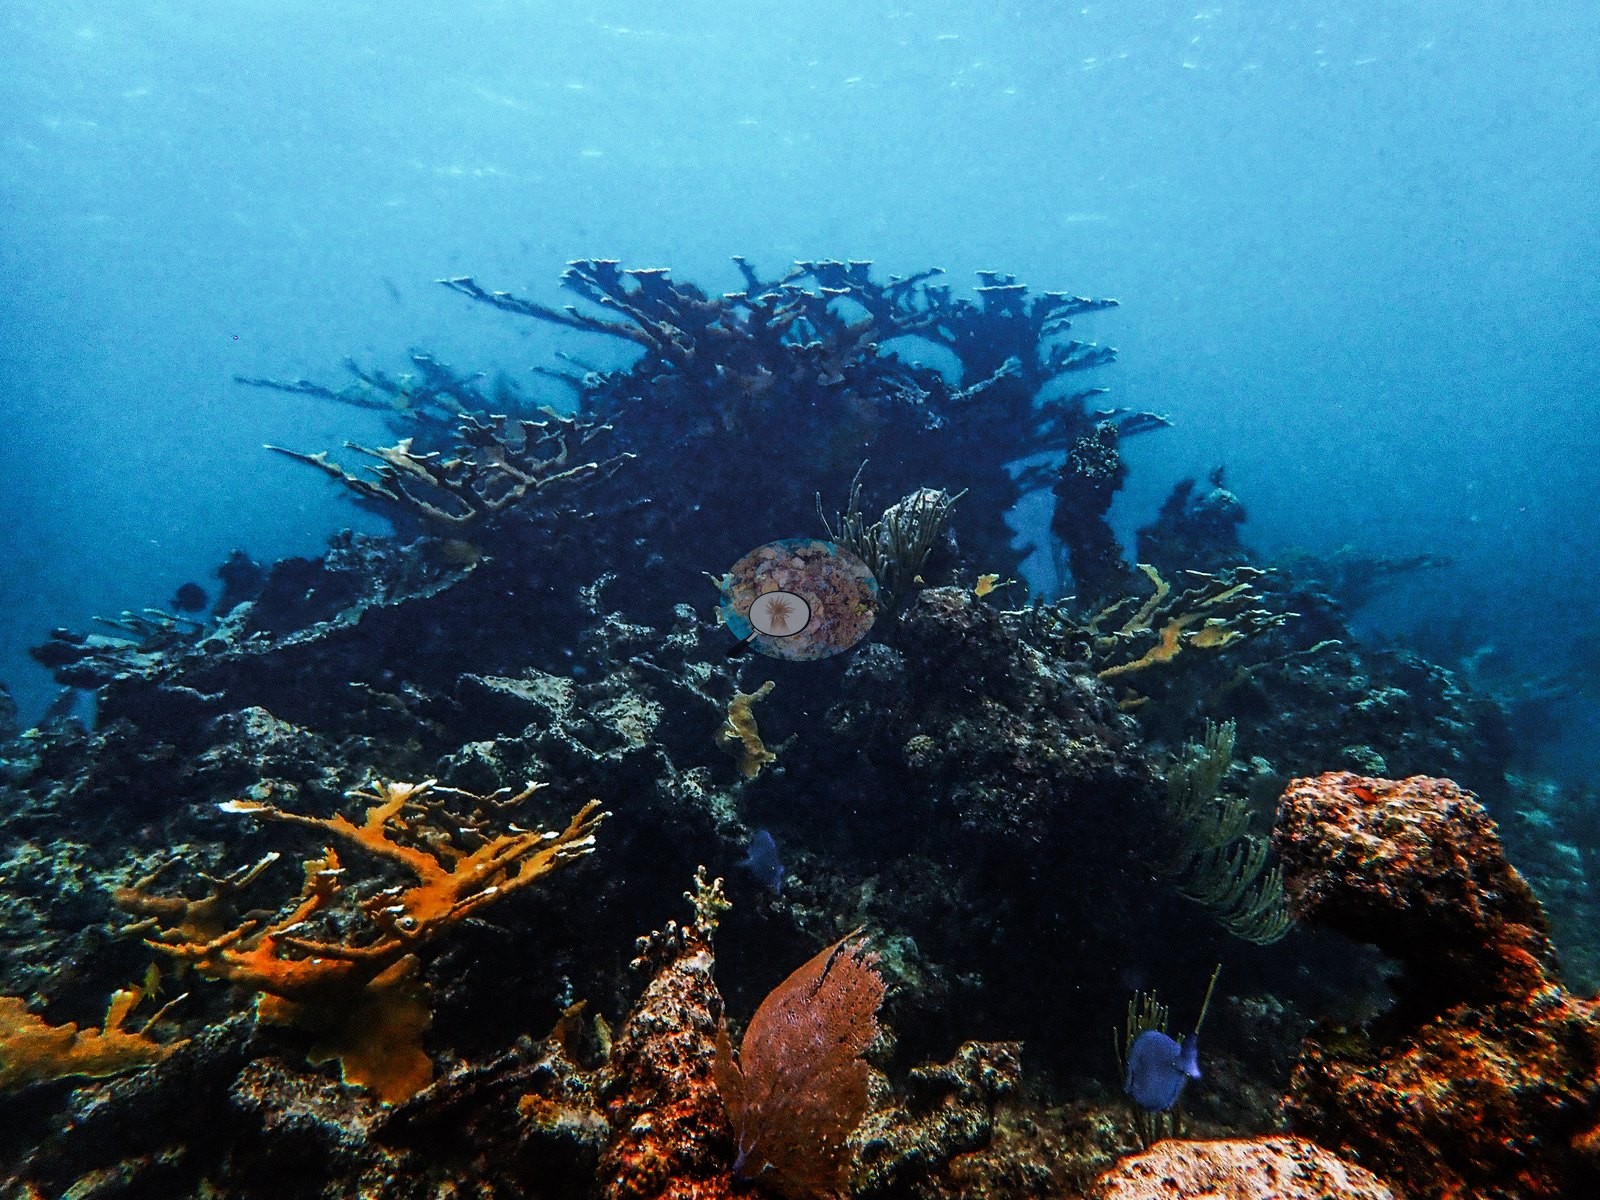
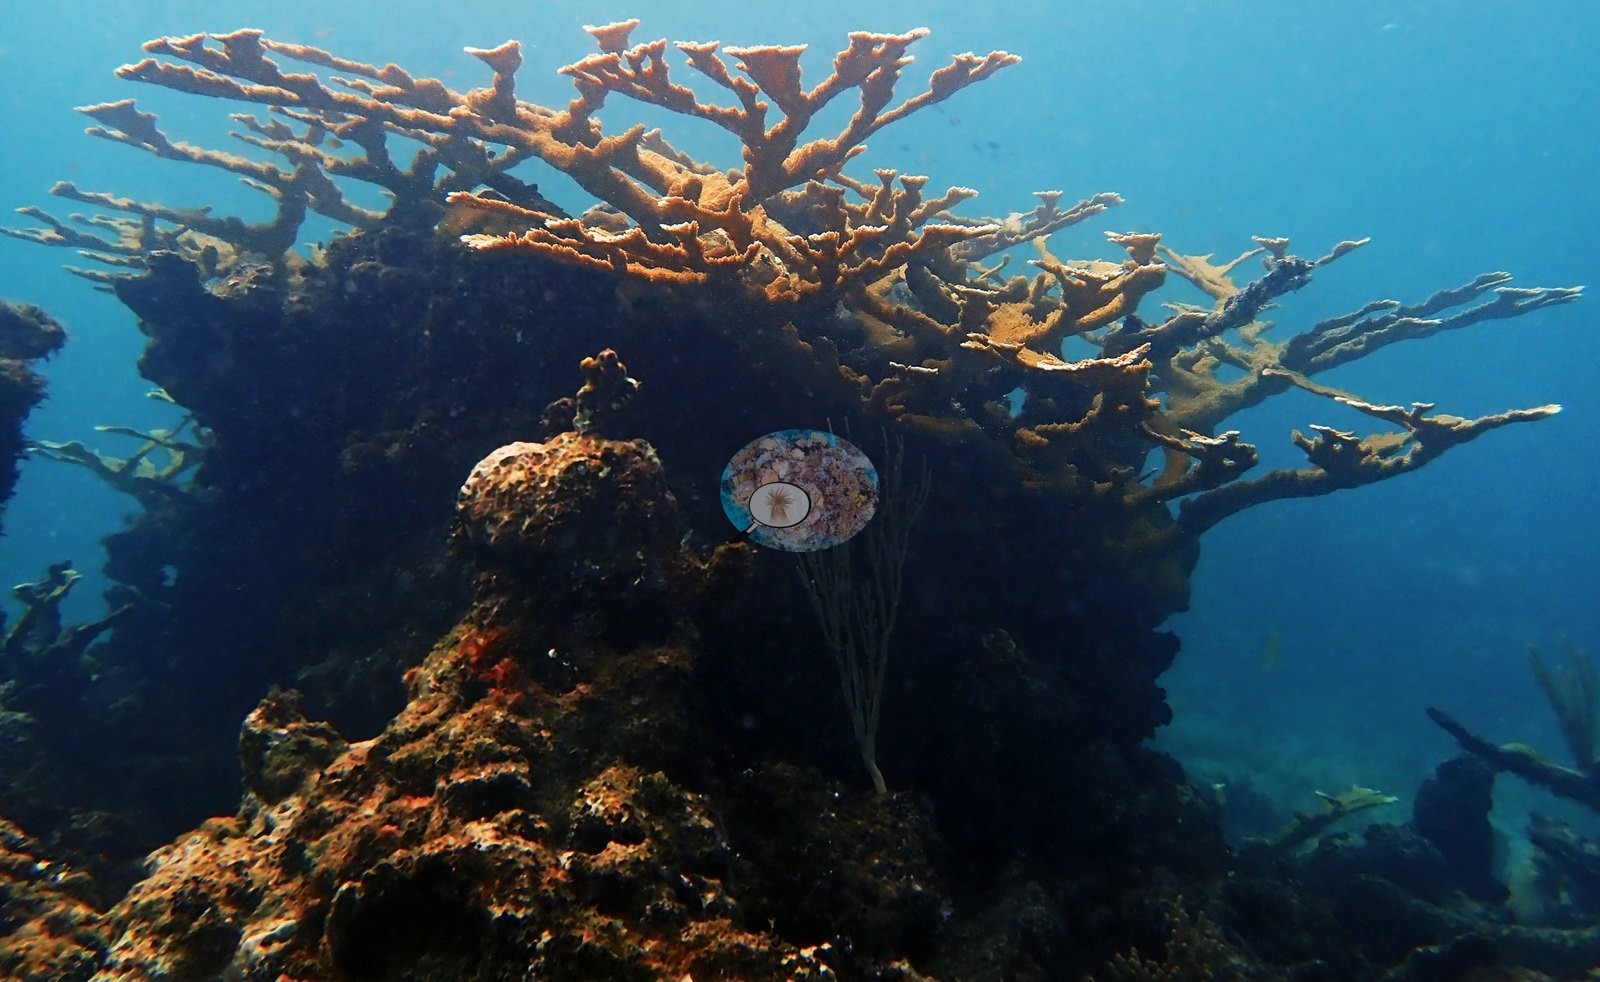
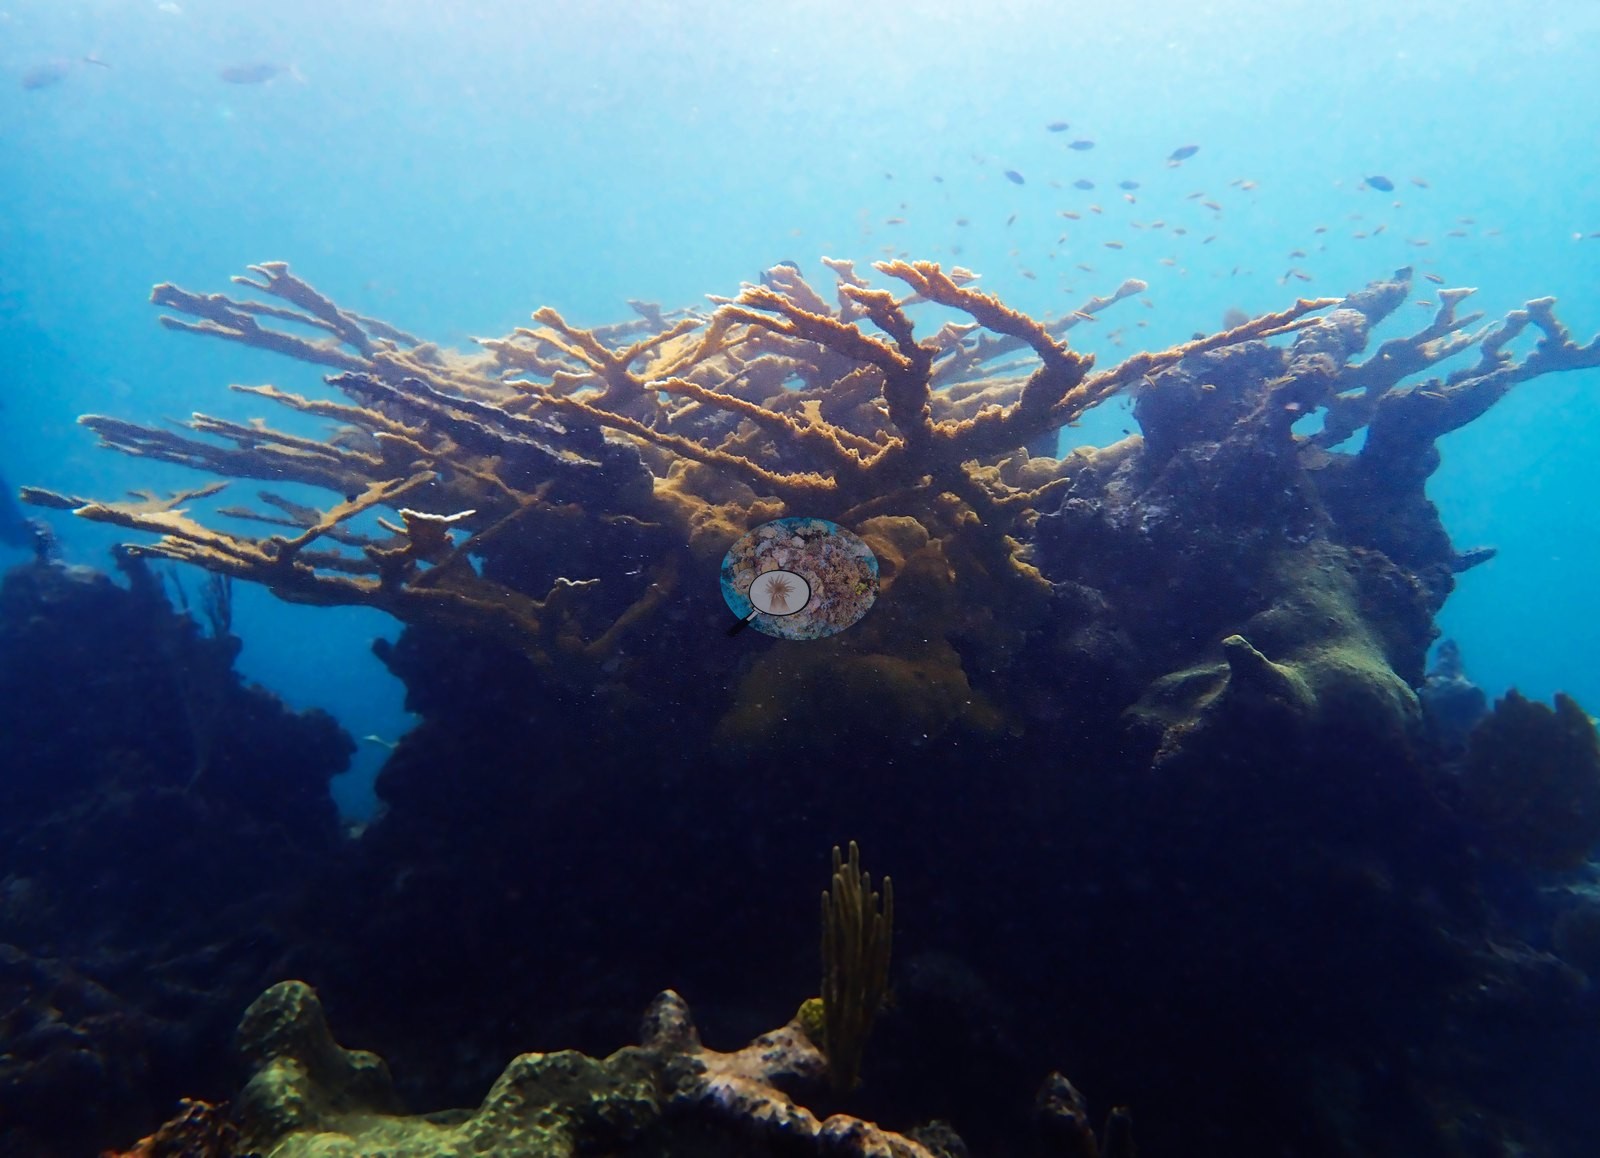
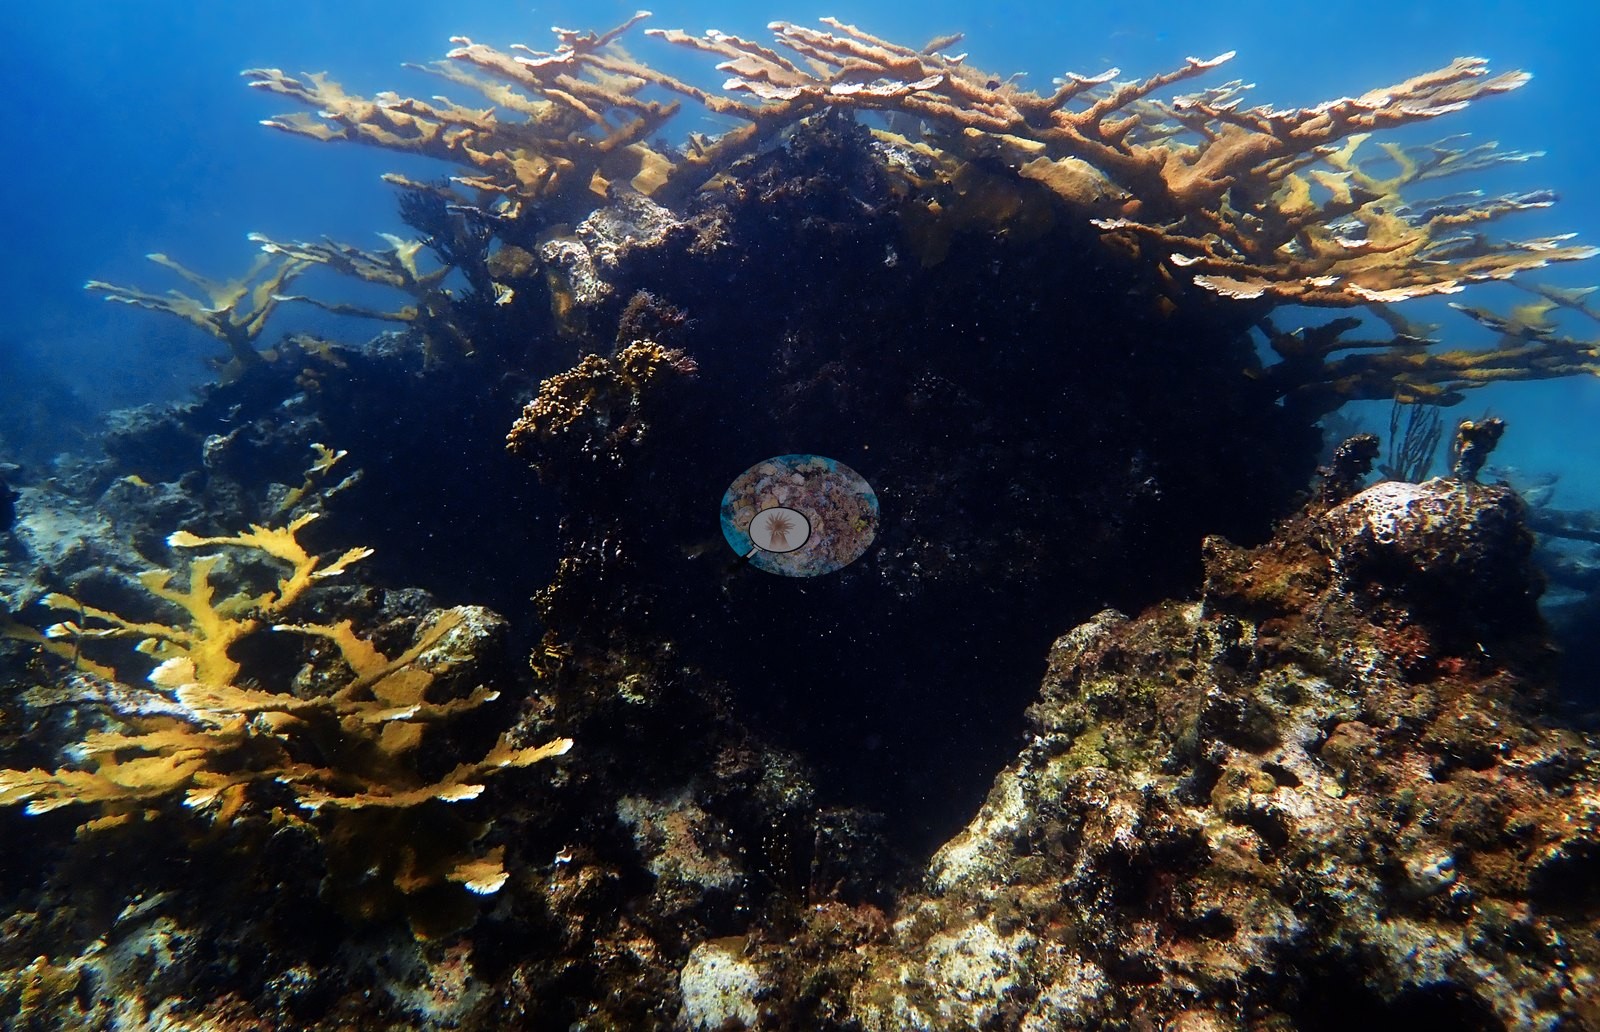
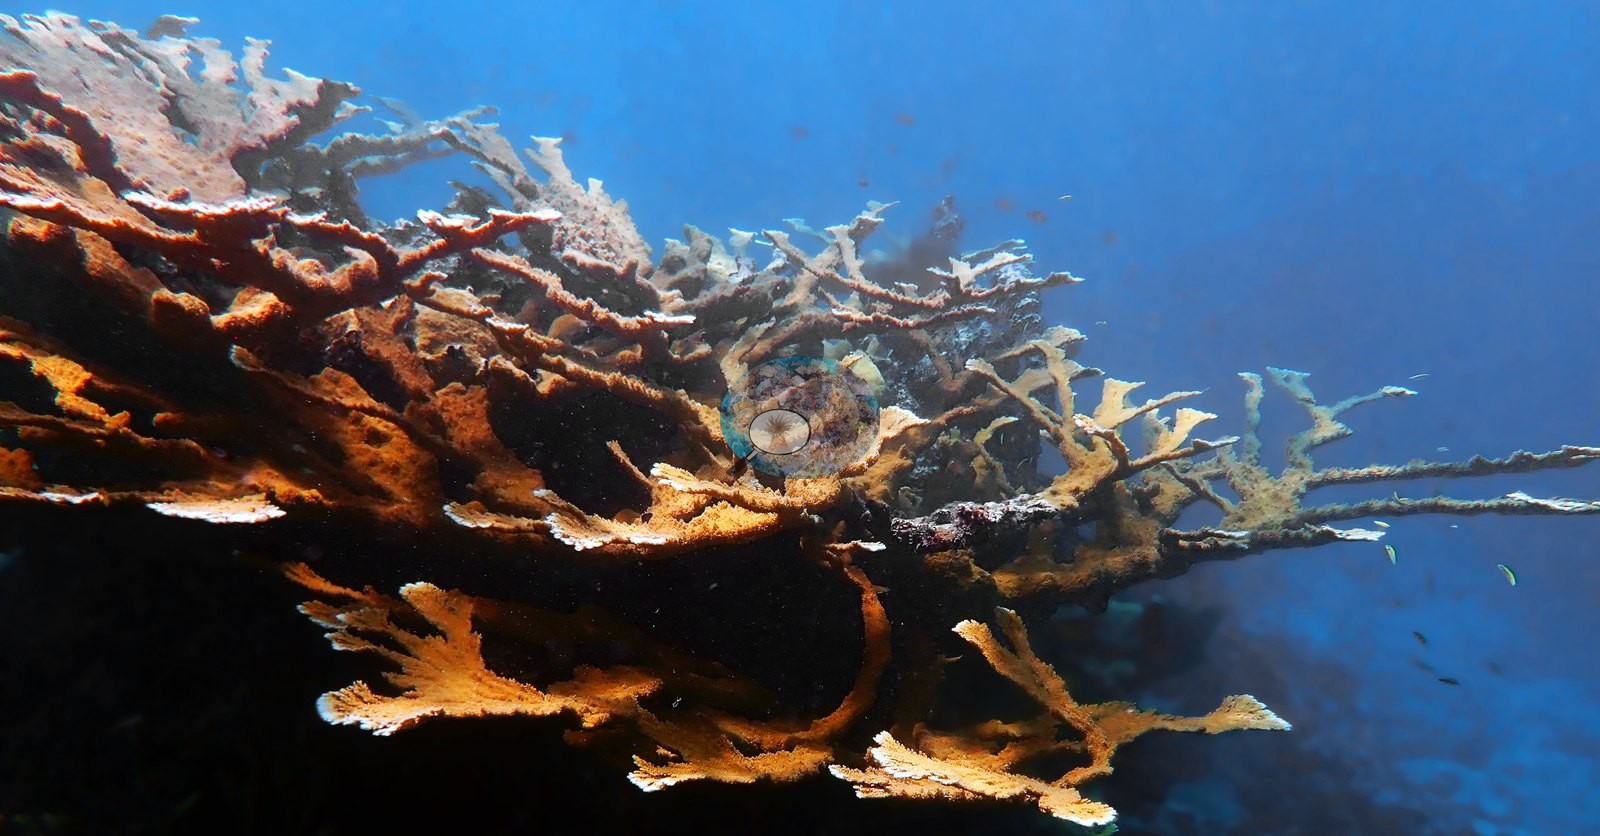
Anderson's frames give the range in one sequence: a whole thicket (e.g., Image 66), a very large colony (e.g., Image 63), a small recruit growing on live rock (e.g., Image 37), a sparse, thin-branched colony recorded as struggling (e.g., Image 51), and a diver alongside a standing skeleton for scale (e.g., Image 52).
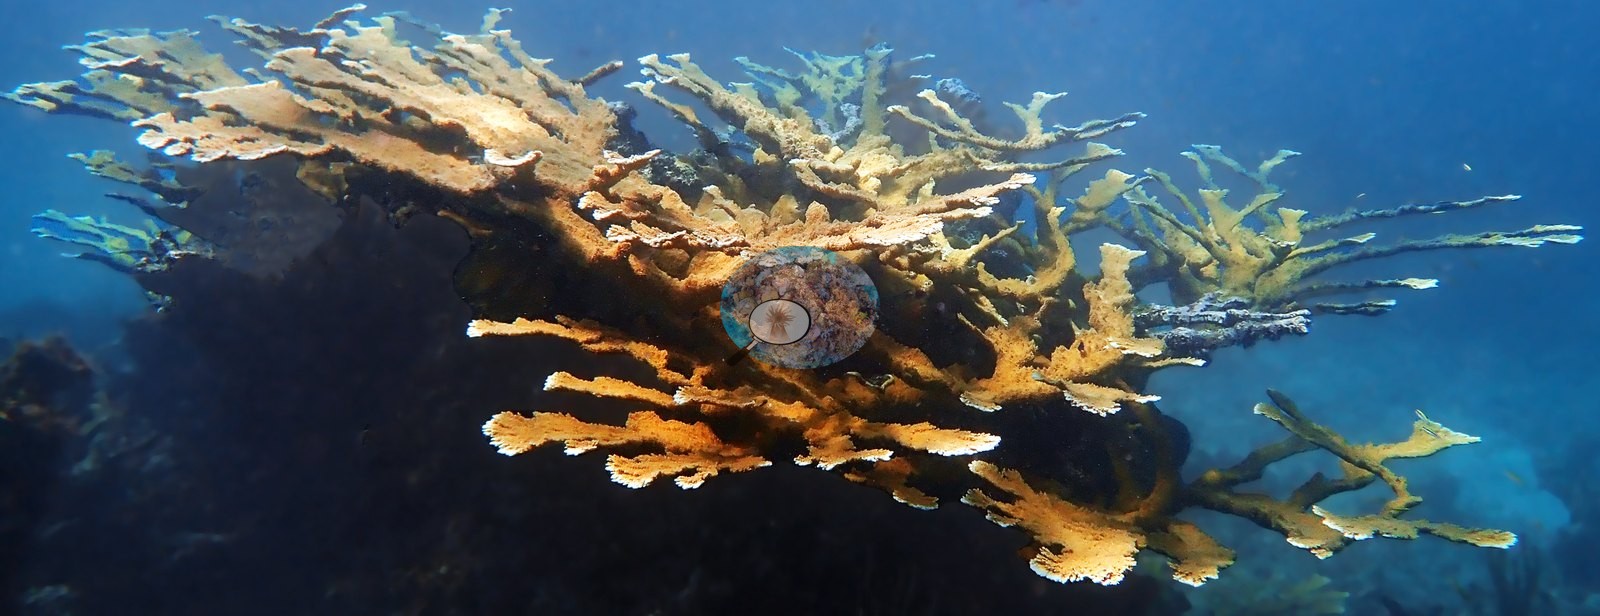
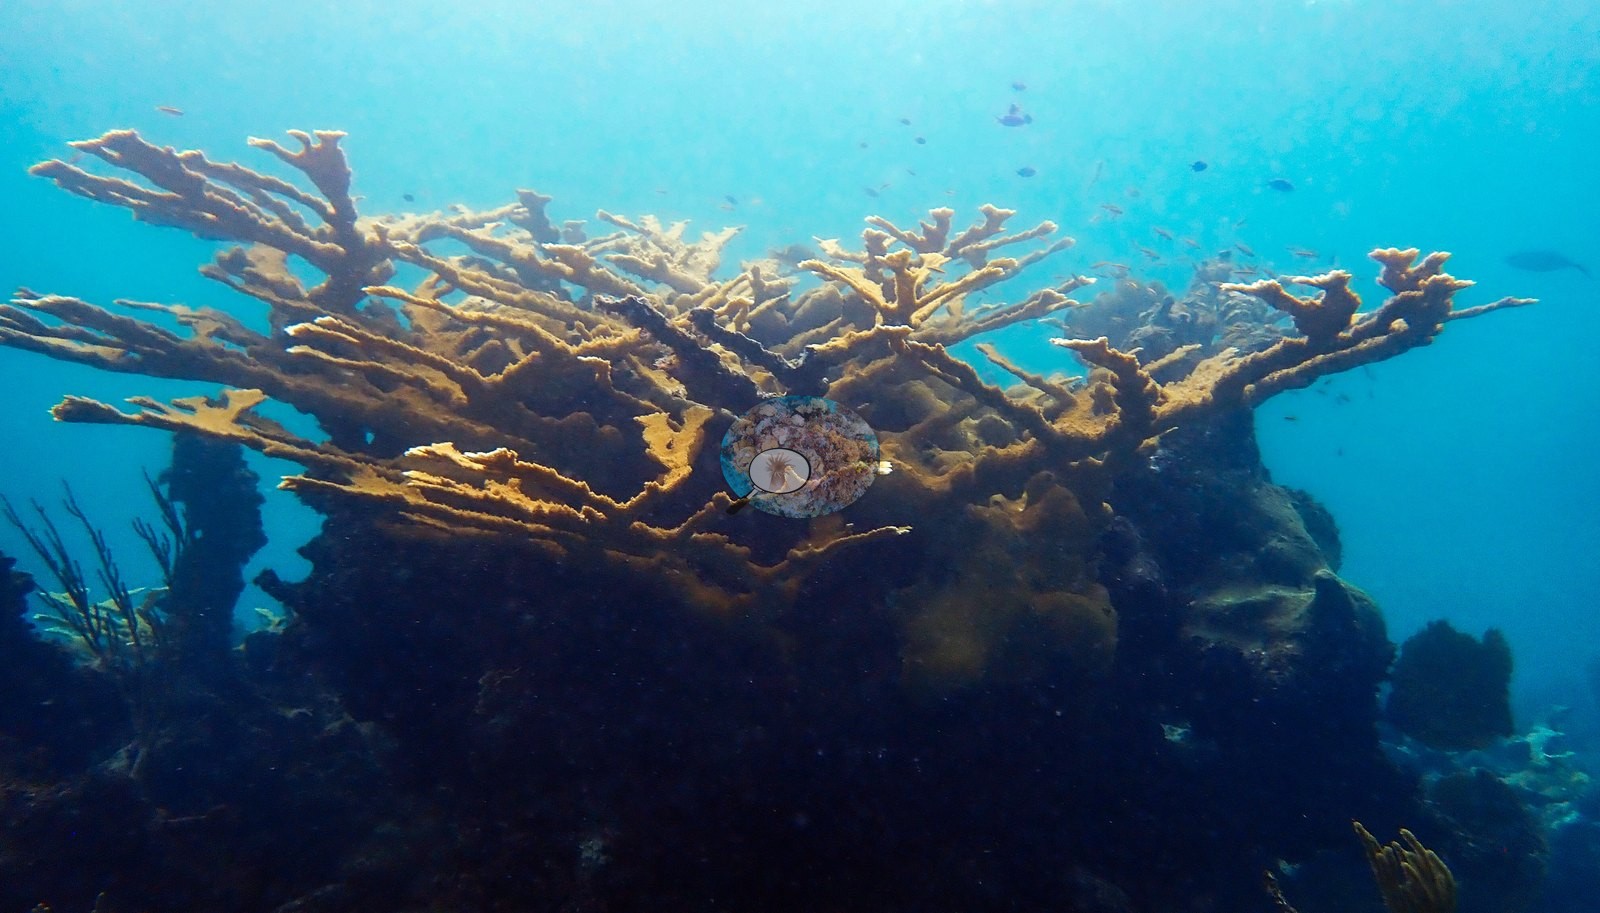
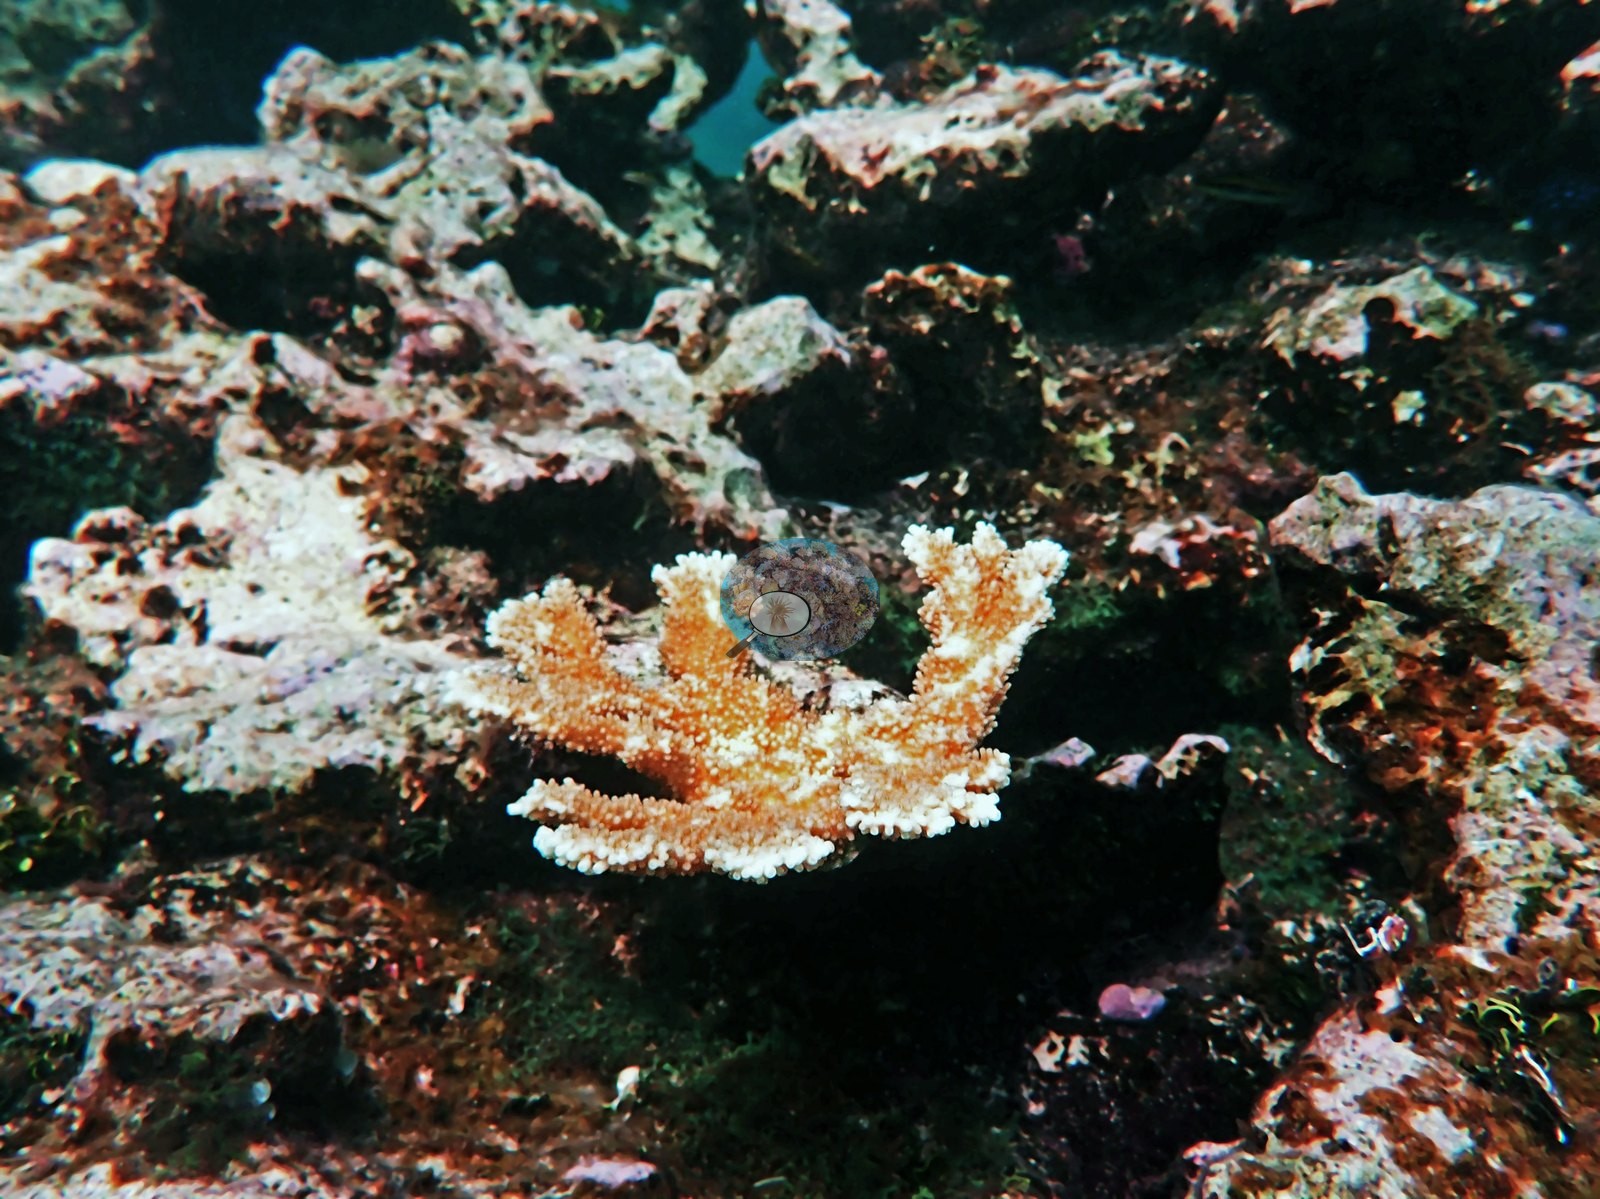
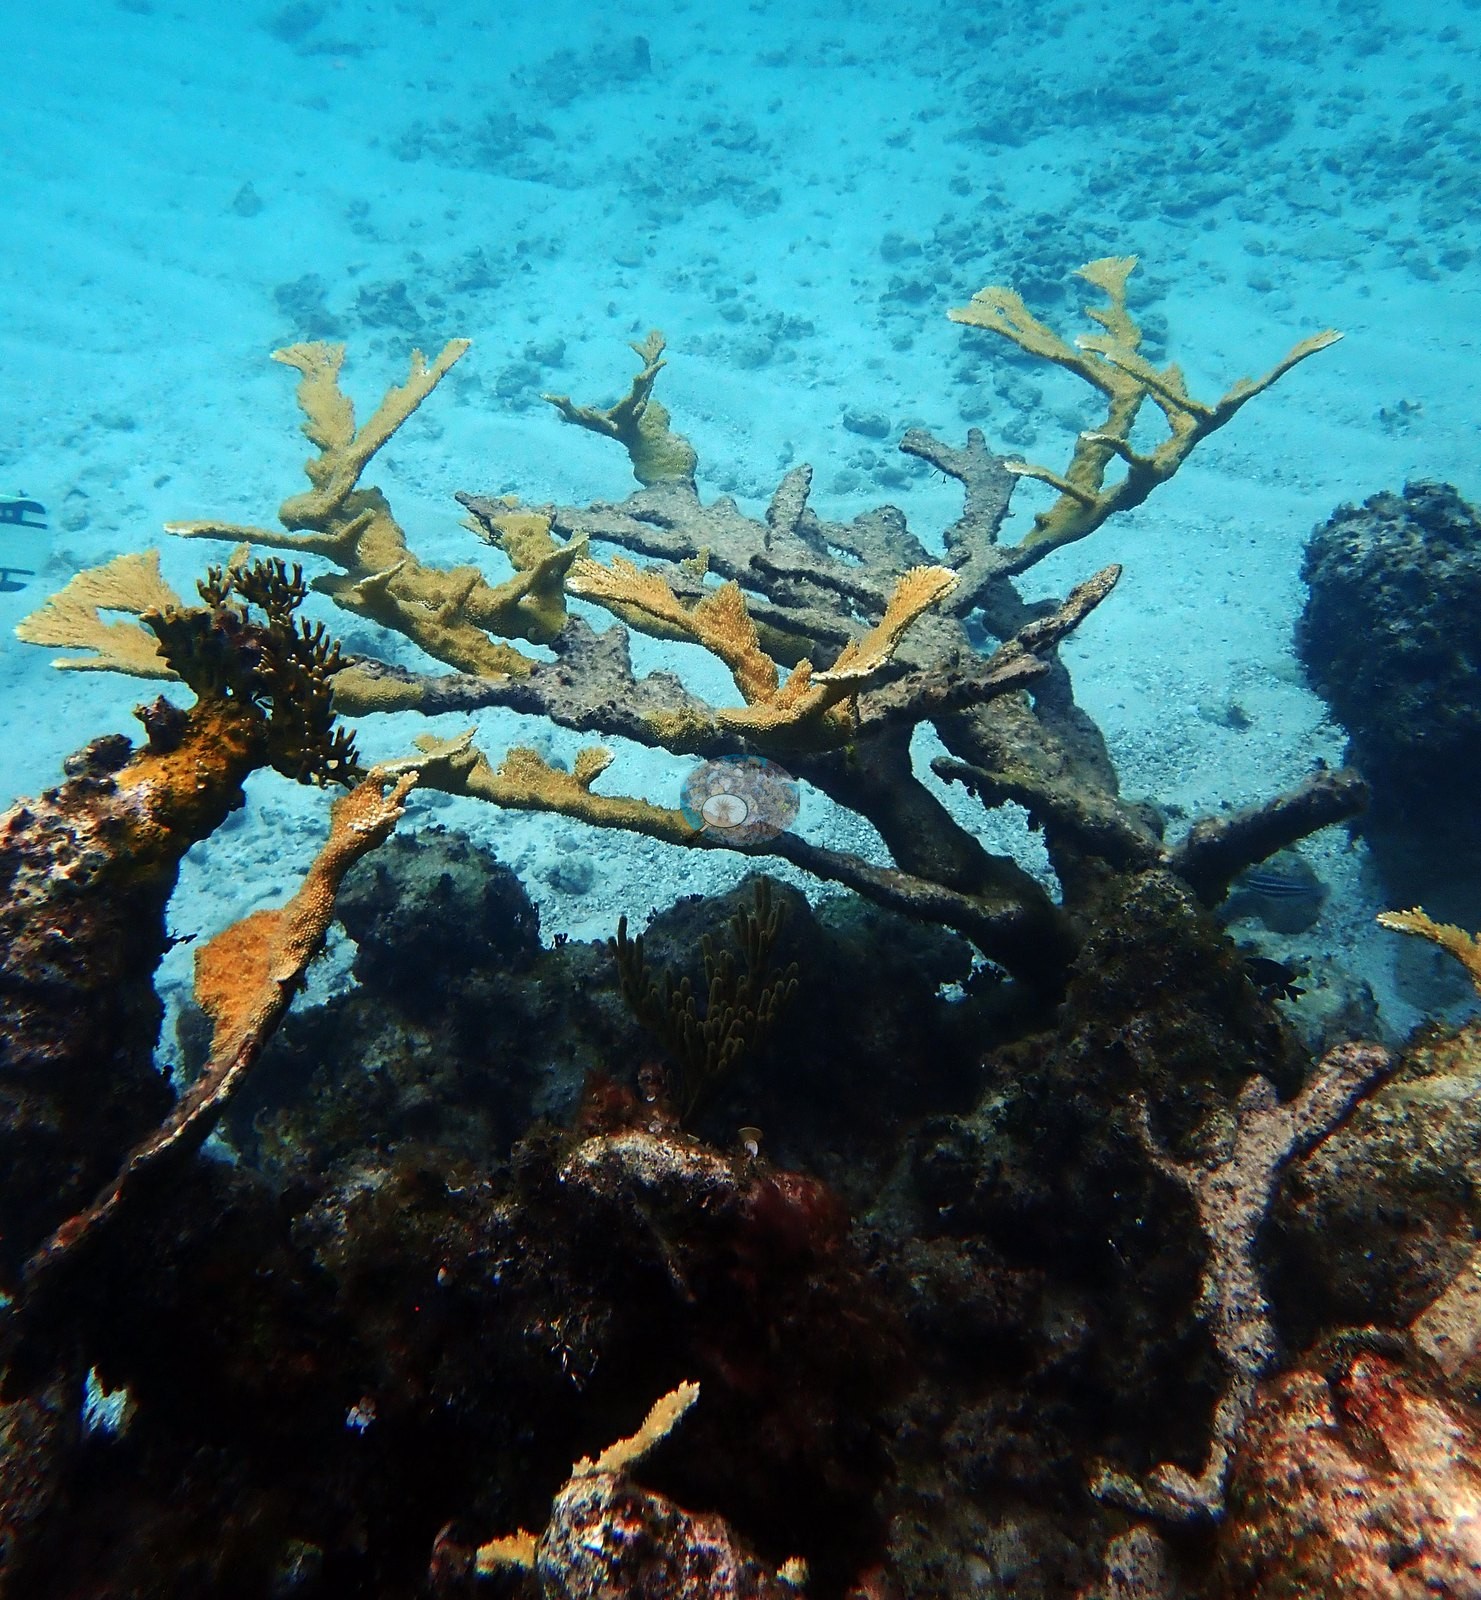
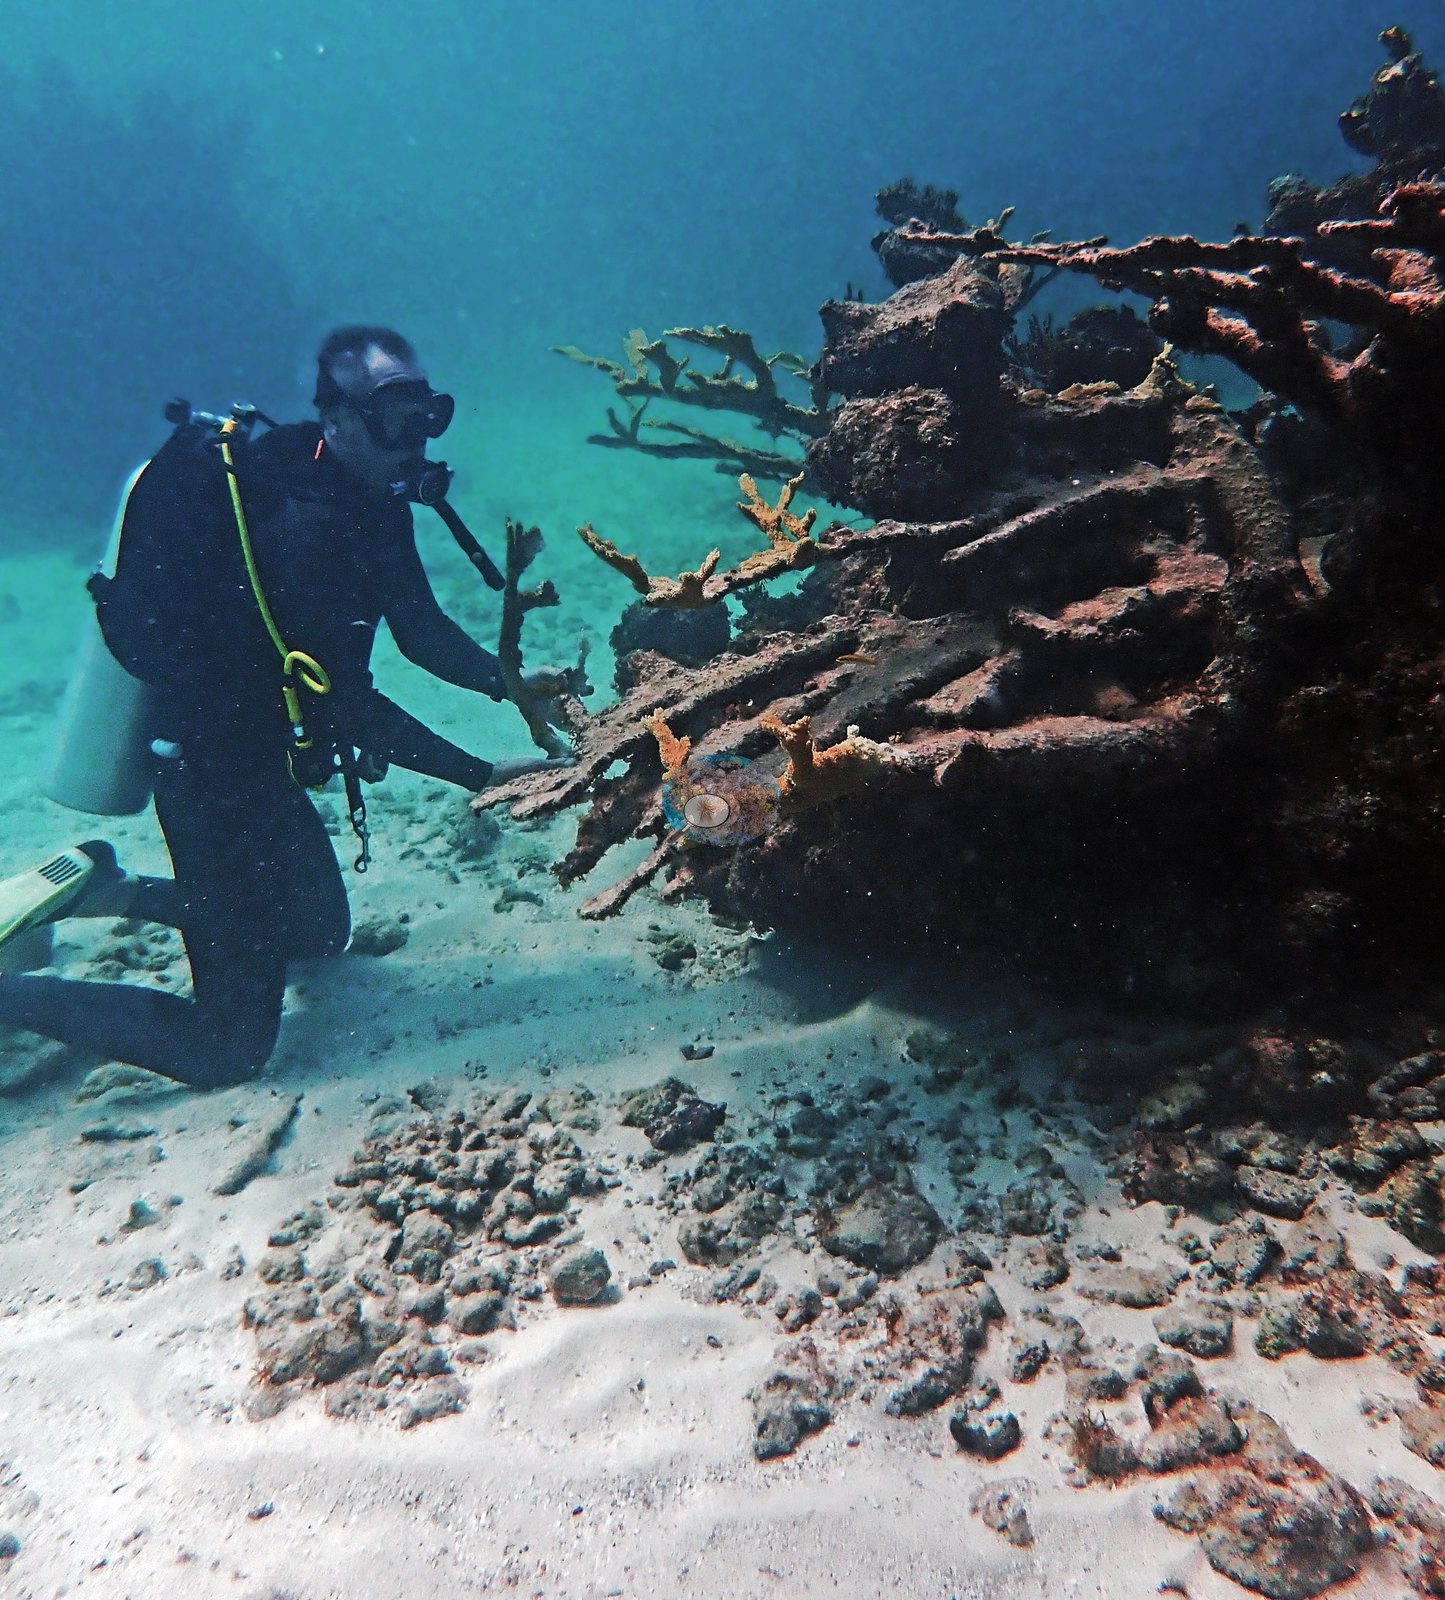
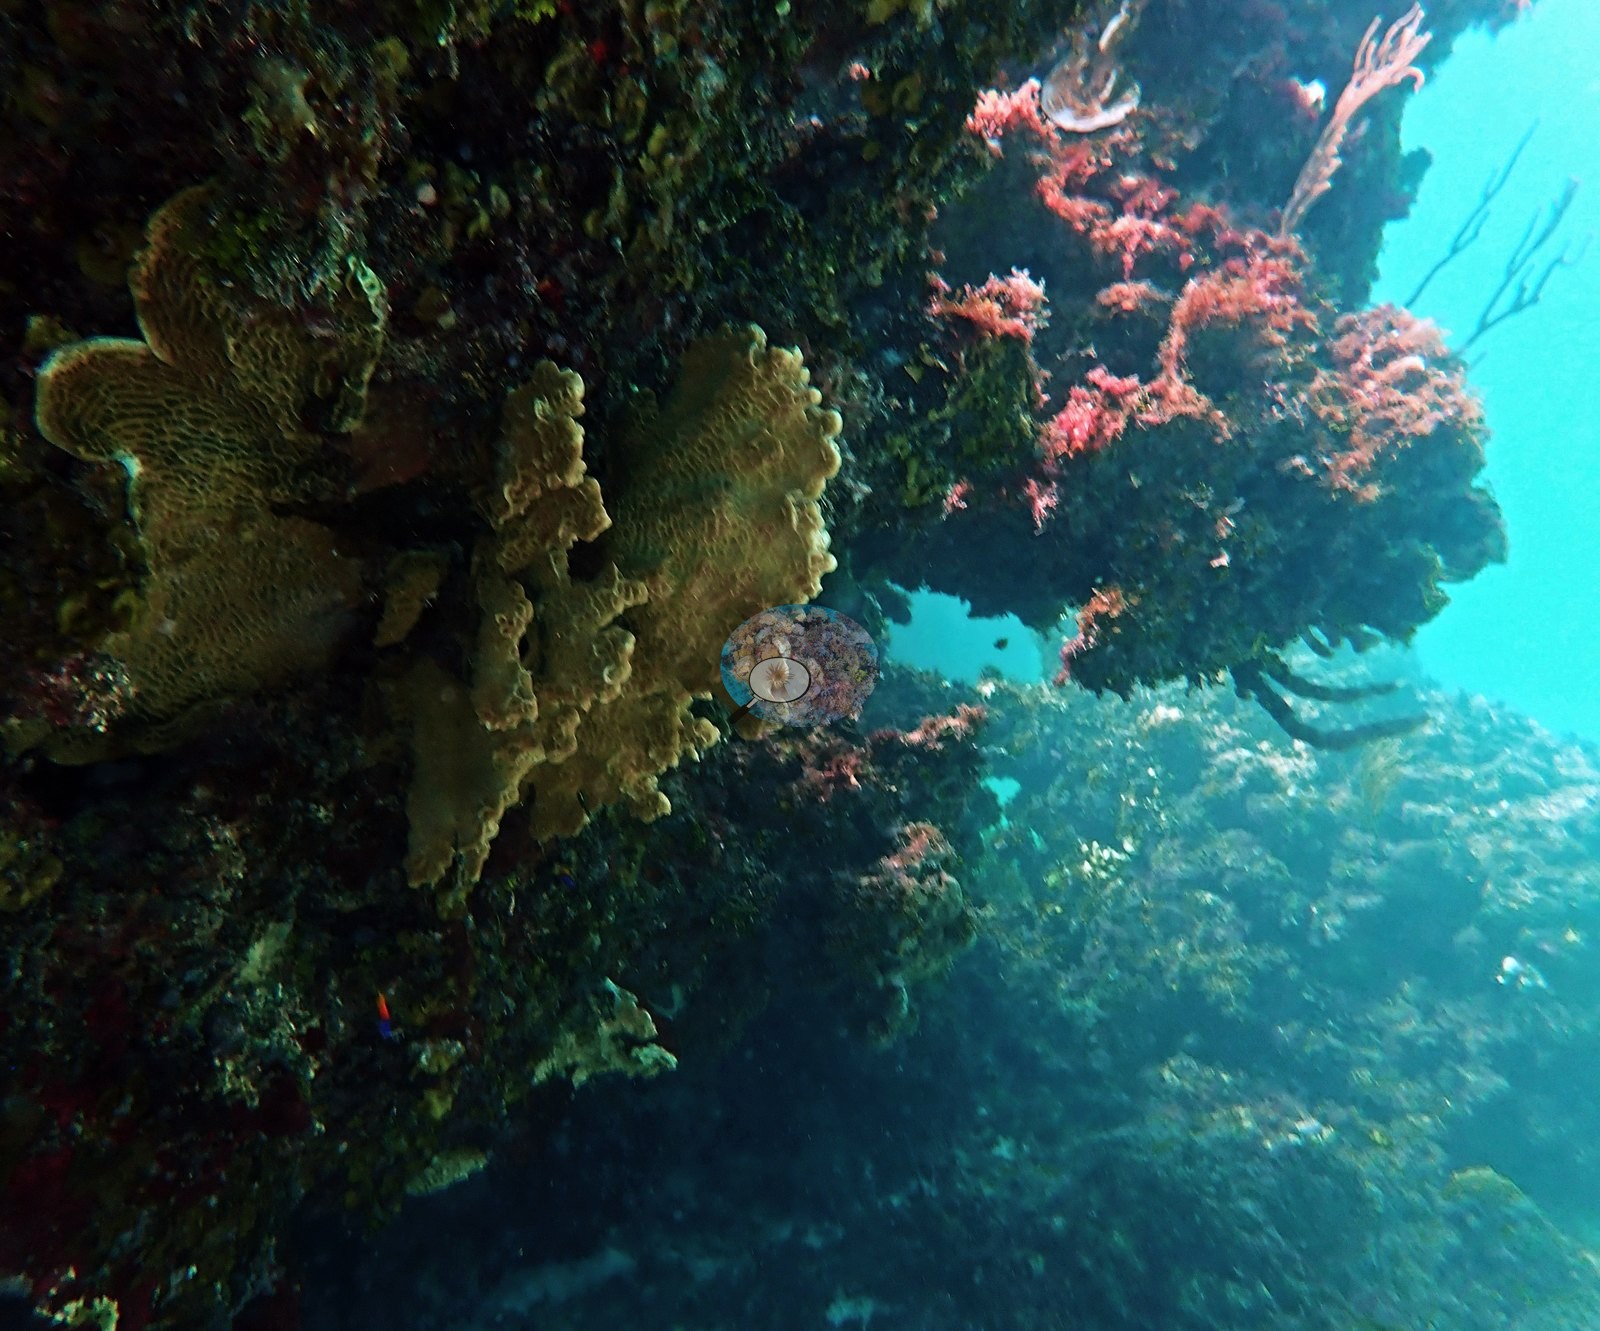
The counterpart to all that live tissue is standing dead framework: bare, turf- and silt-crusted elkhorn branches still in growth position in Image 36, Image 42, Image 43, and Image 39 (recorded by Anderson as dead Acropora framework), and eroded branch stubs mixed into the pavement in Image 38, Image 40, and Image 50.
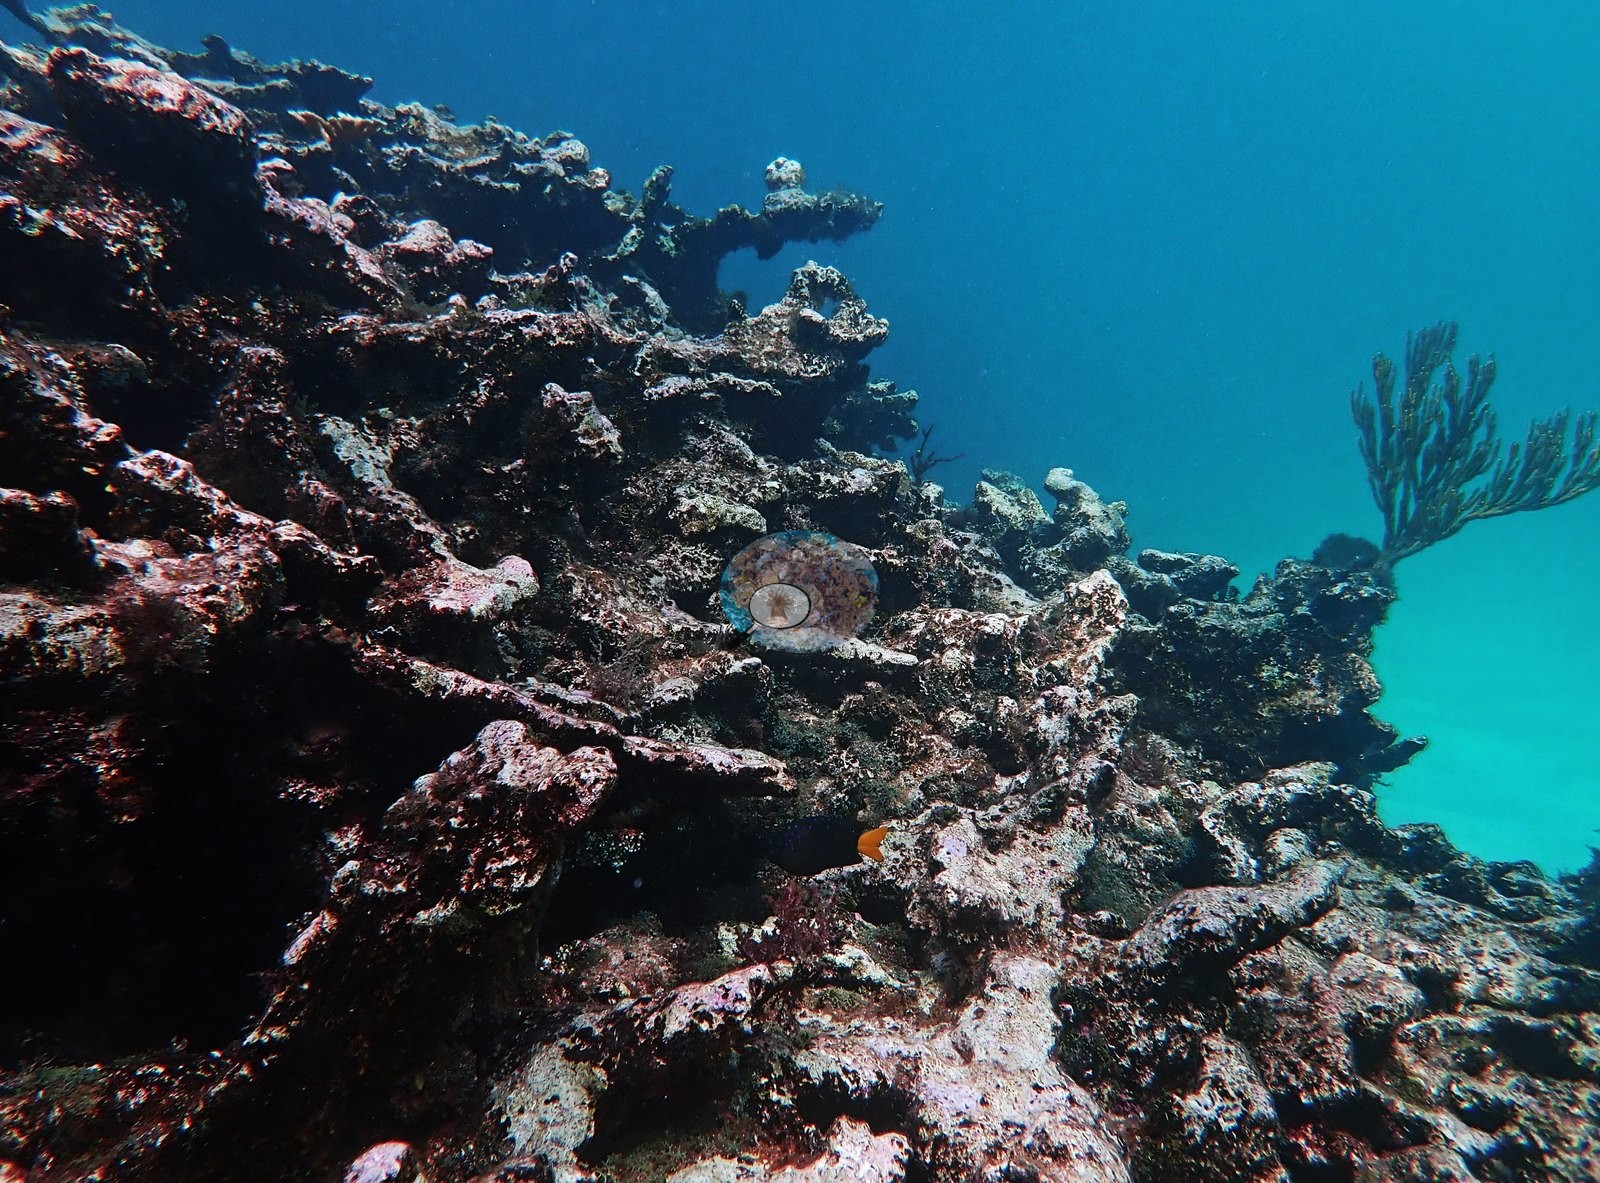
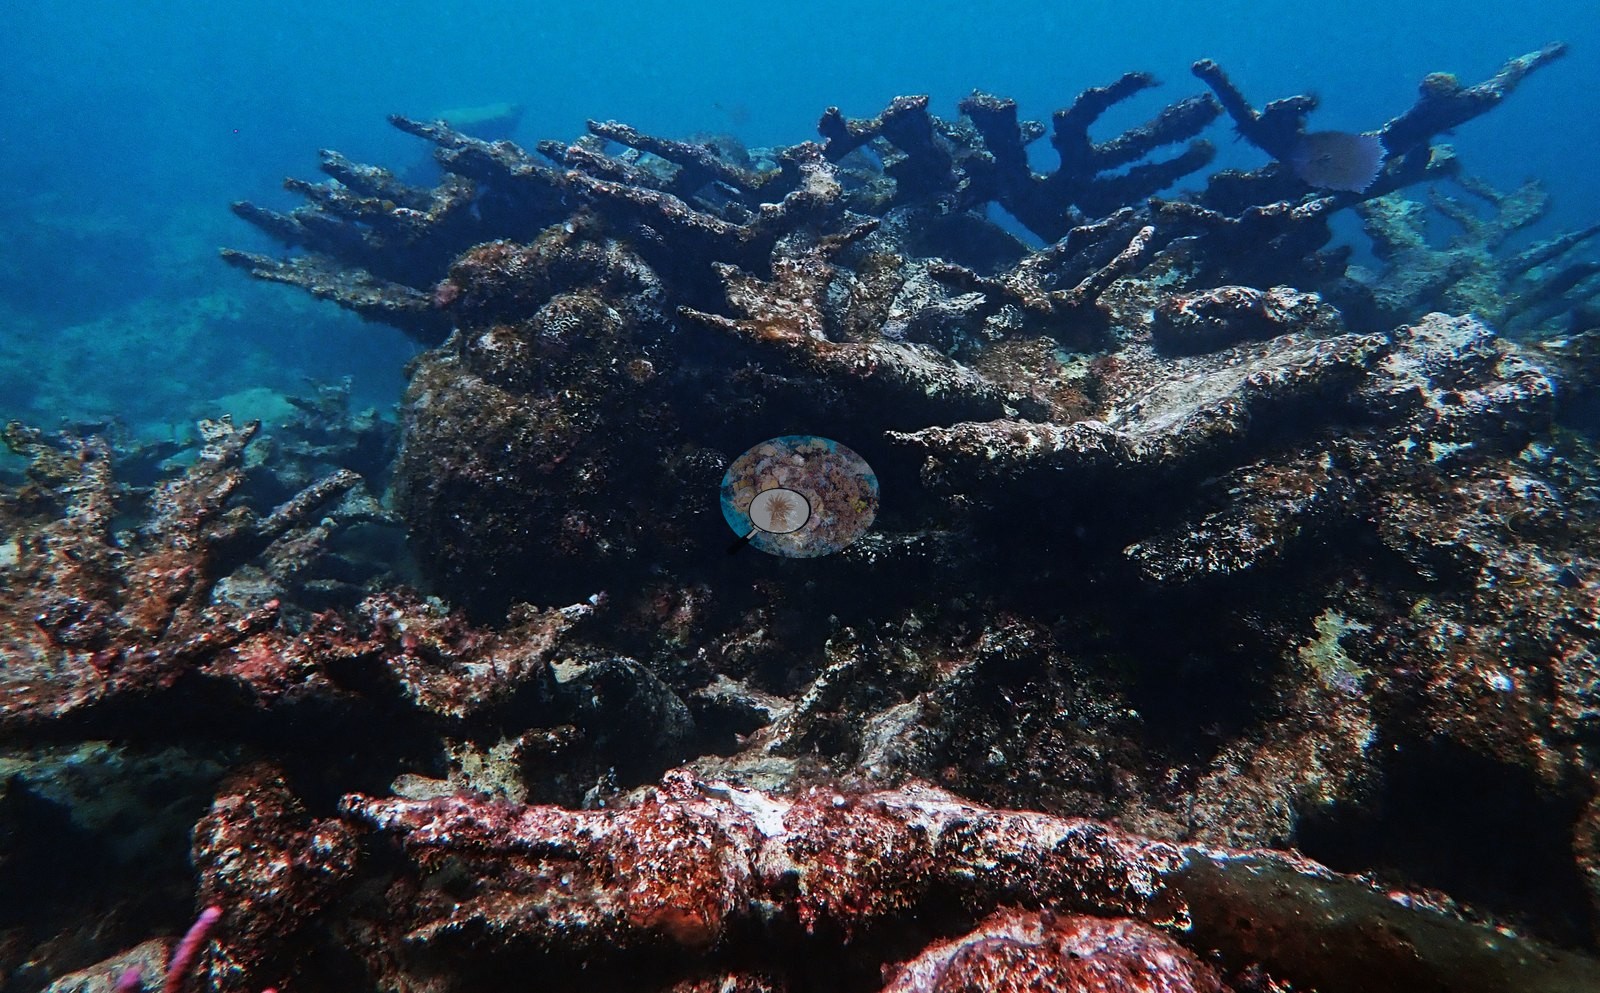
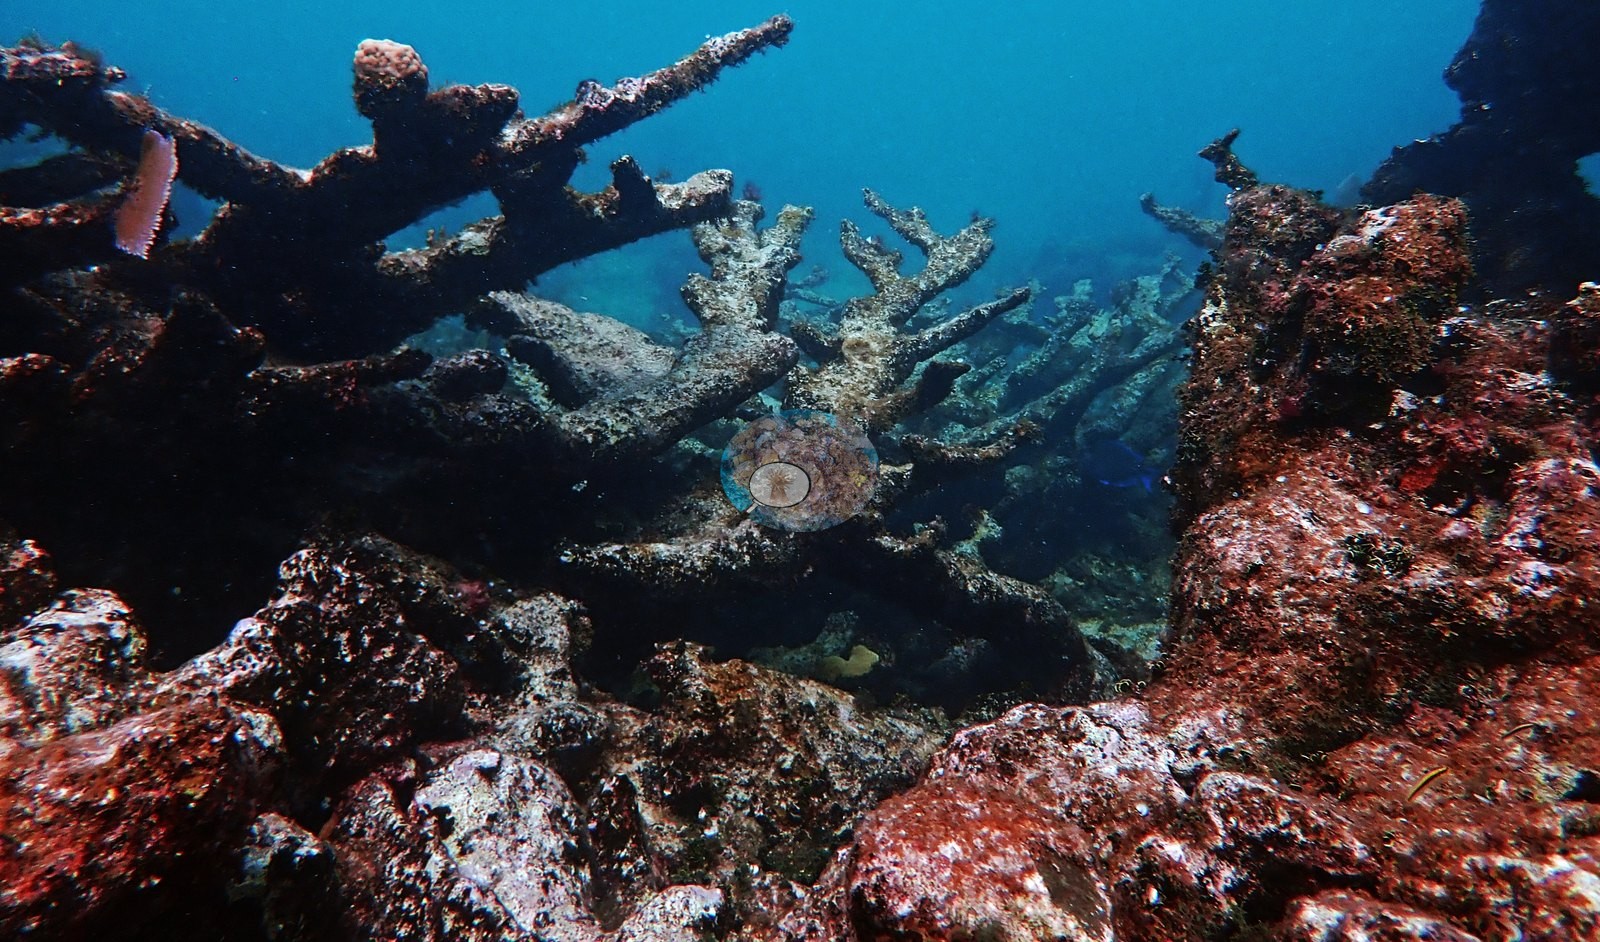
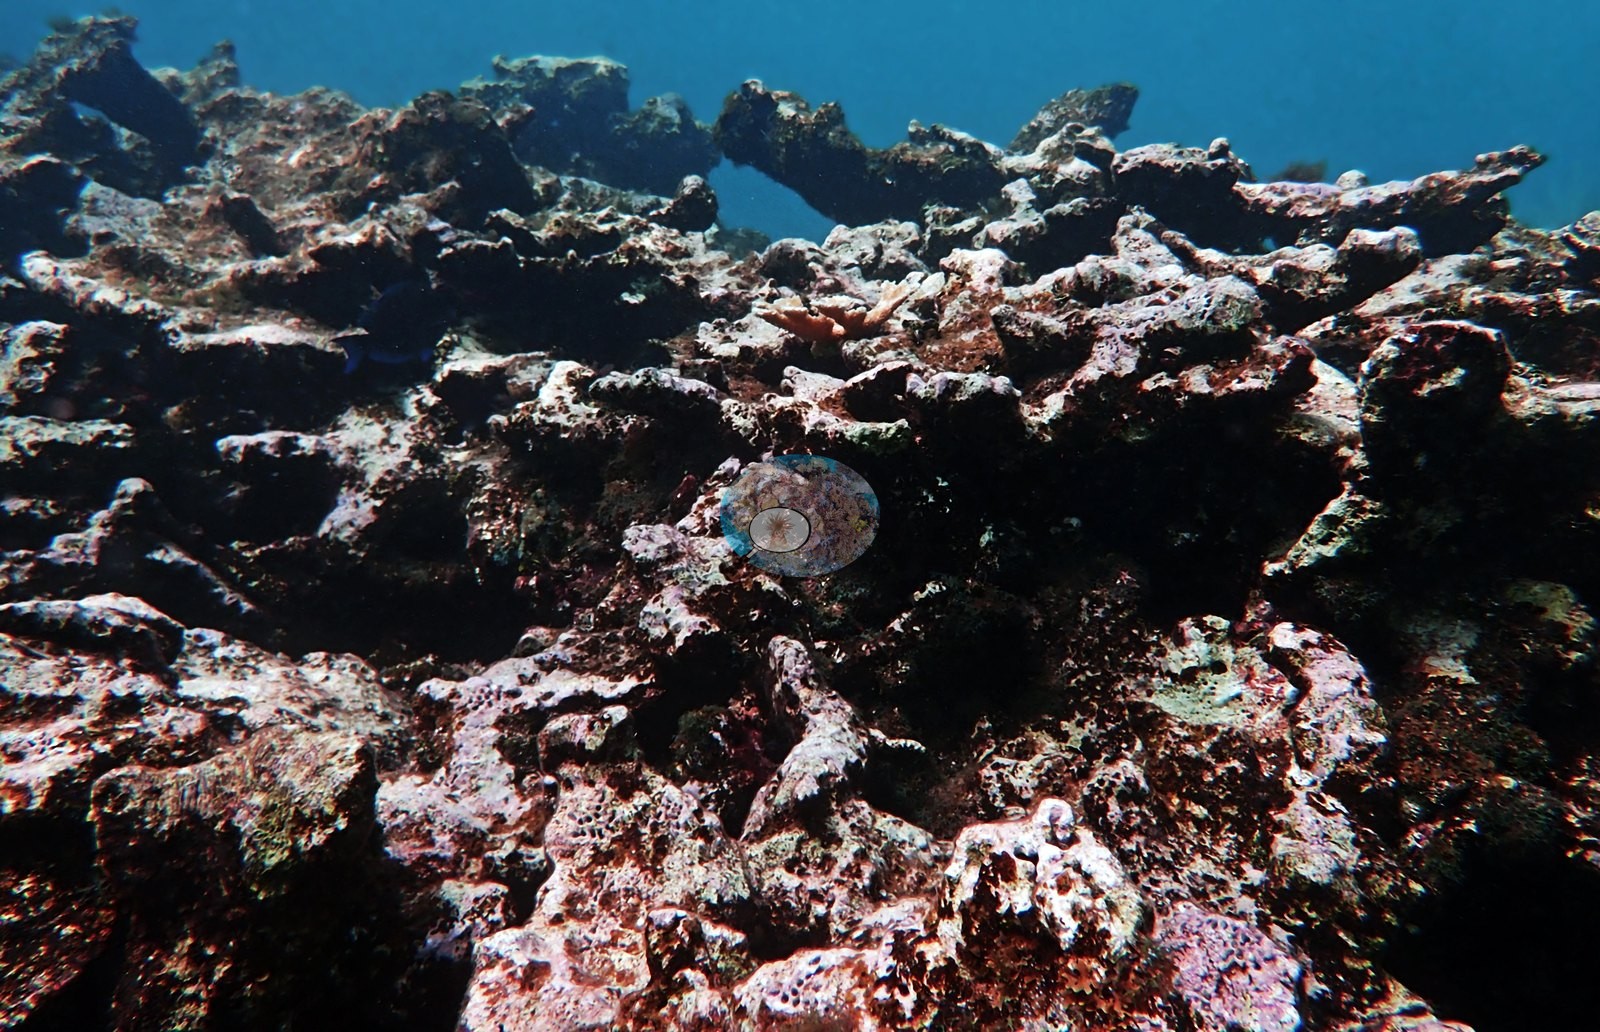
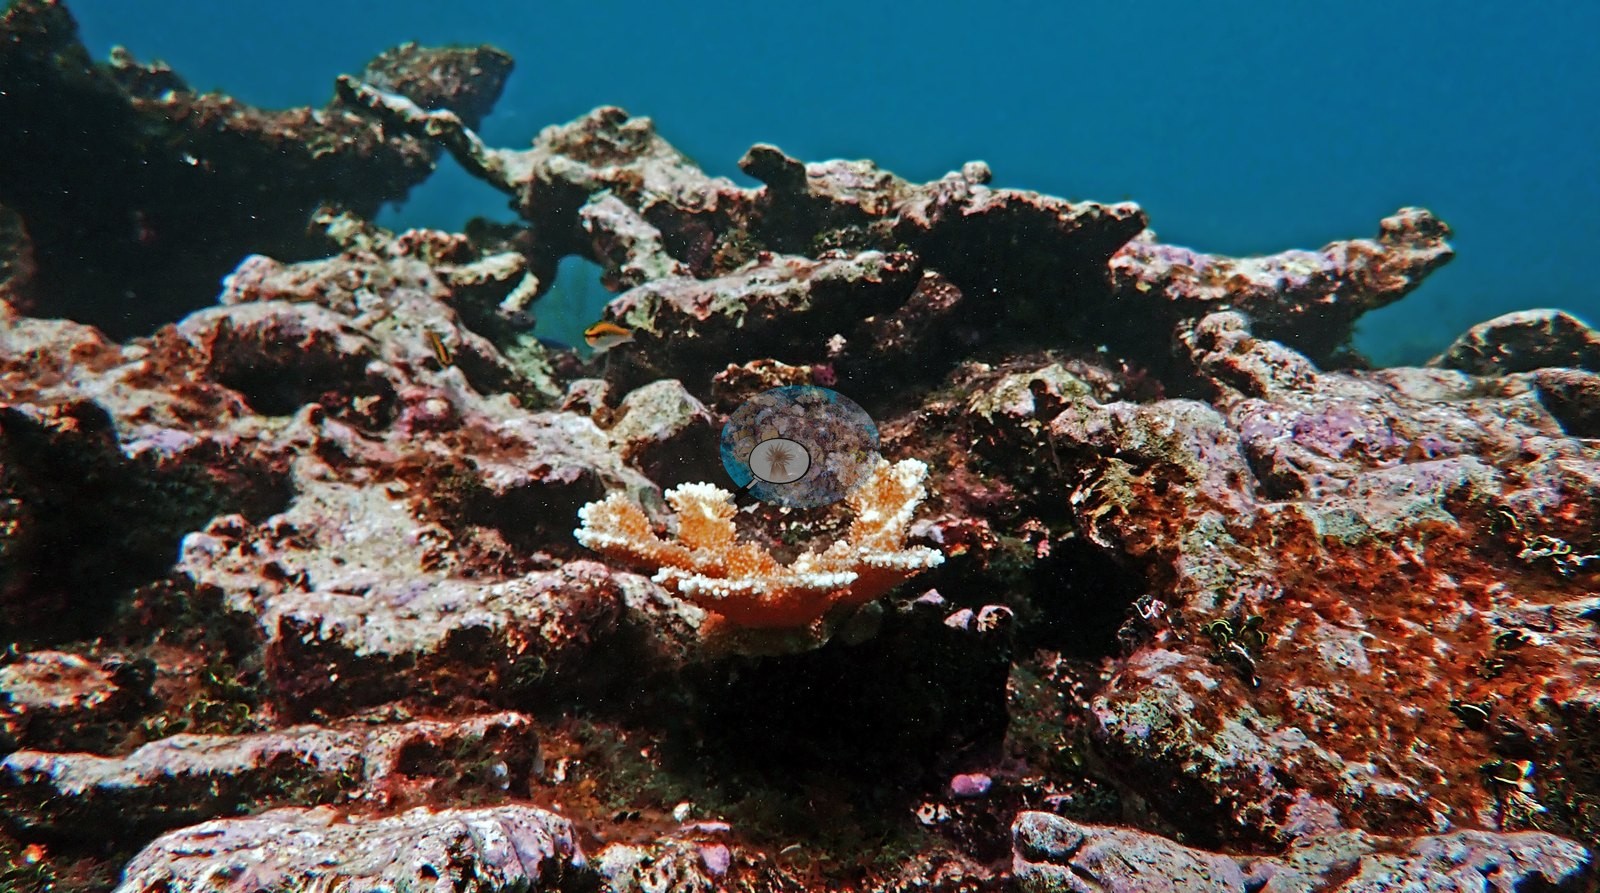
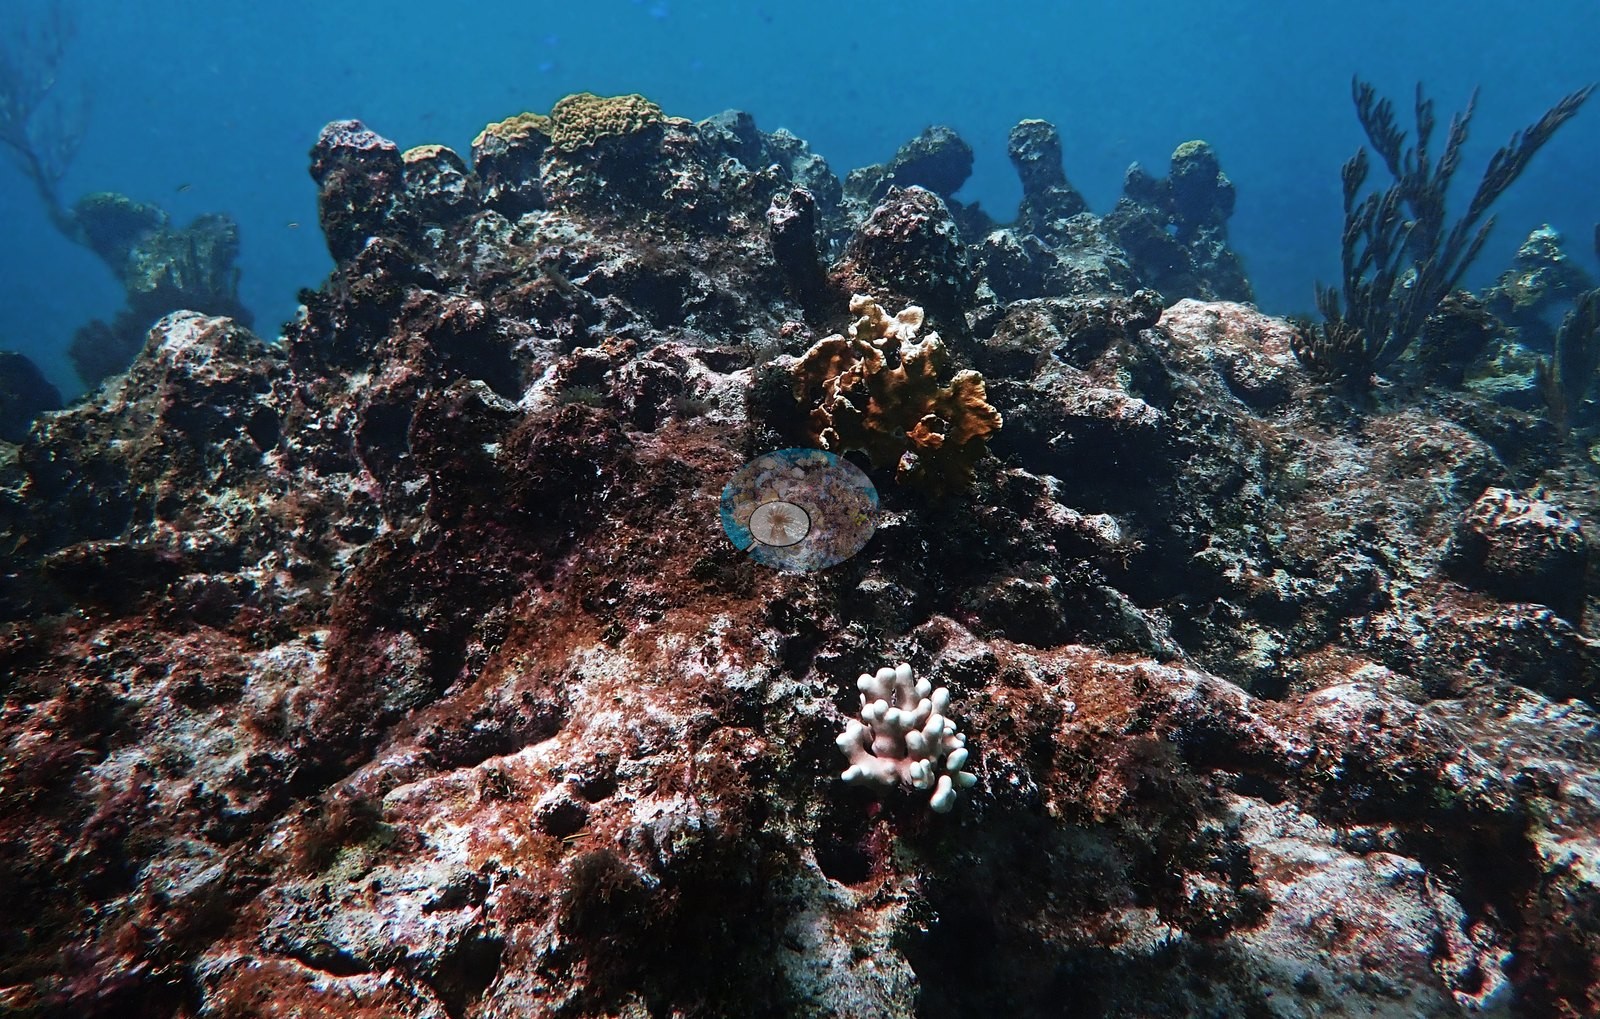
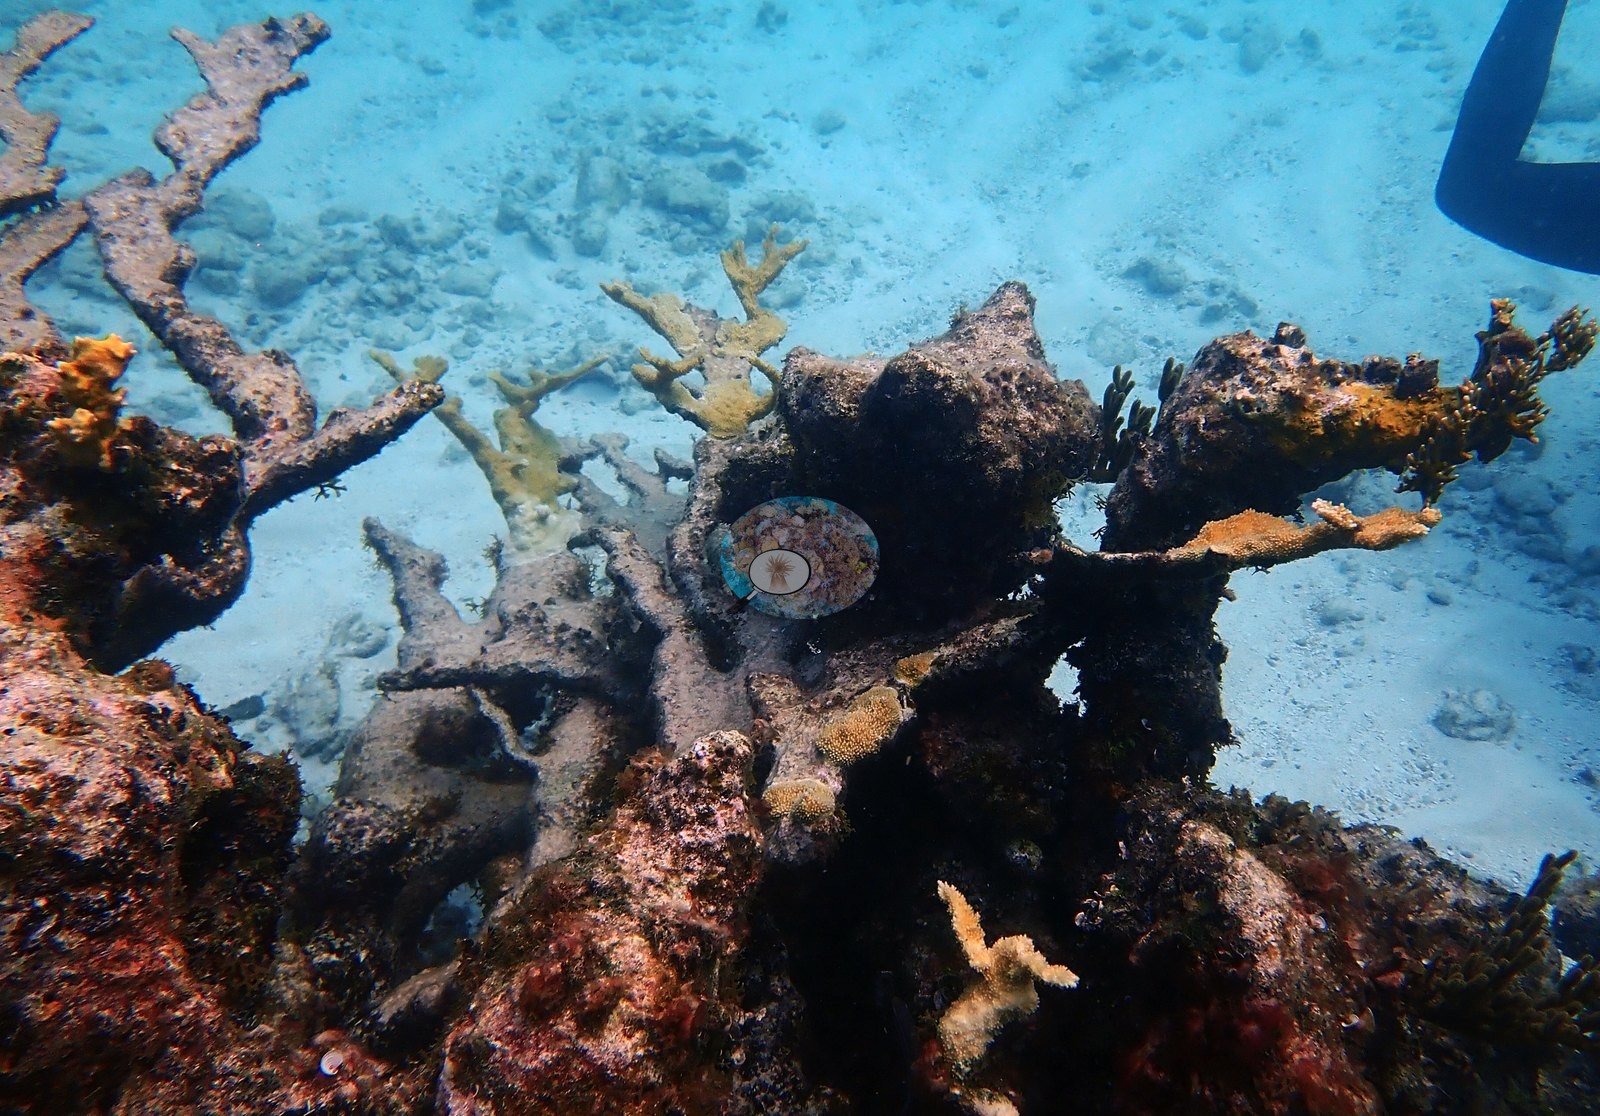
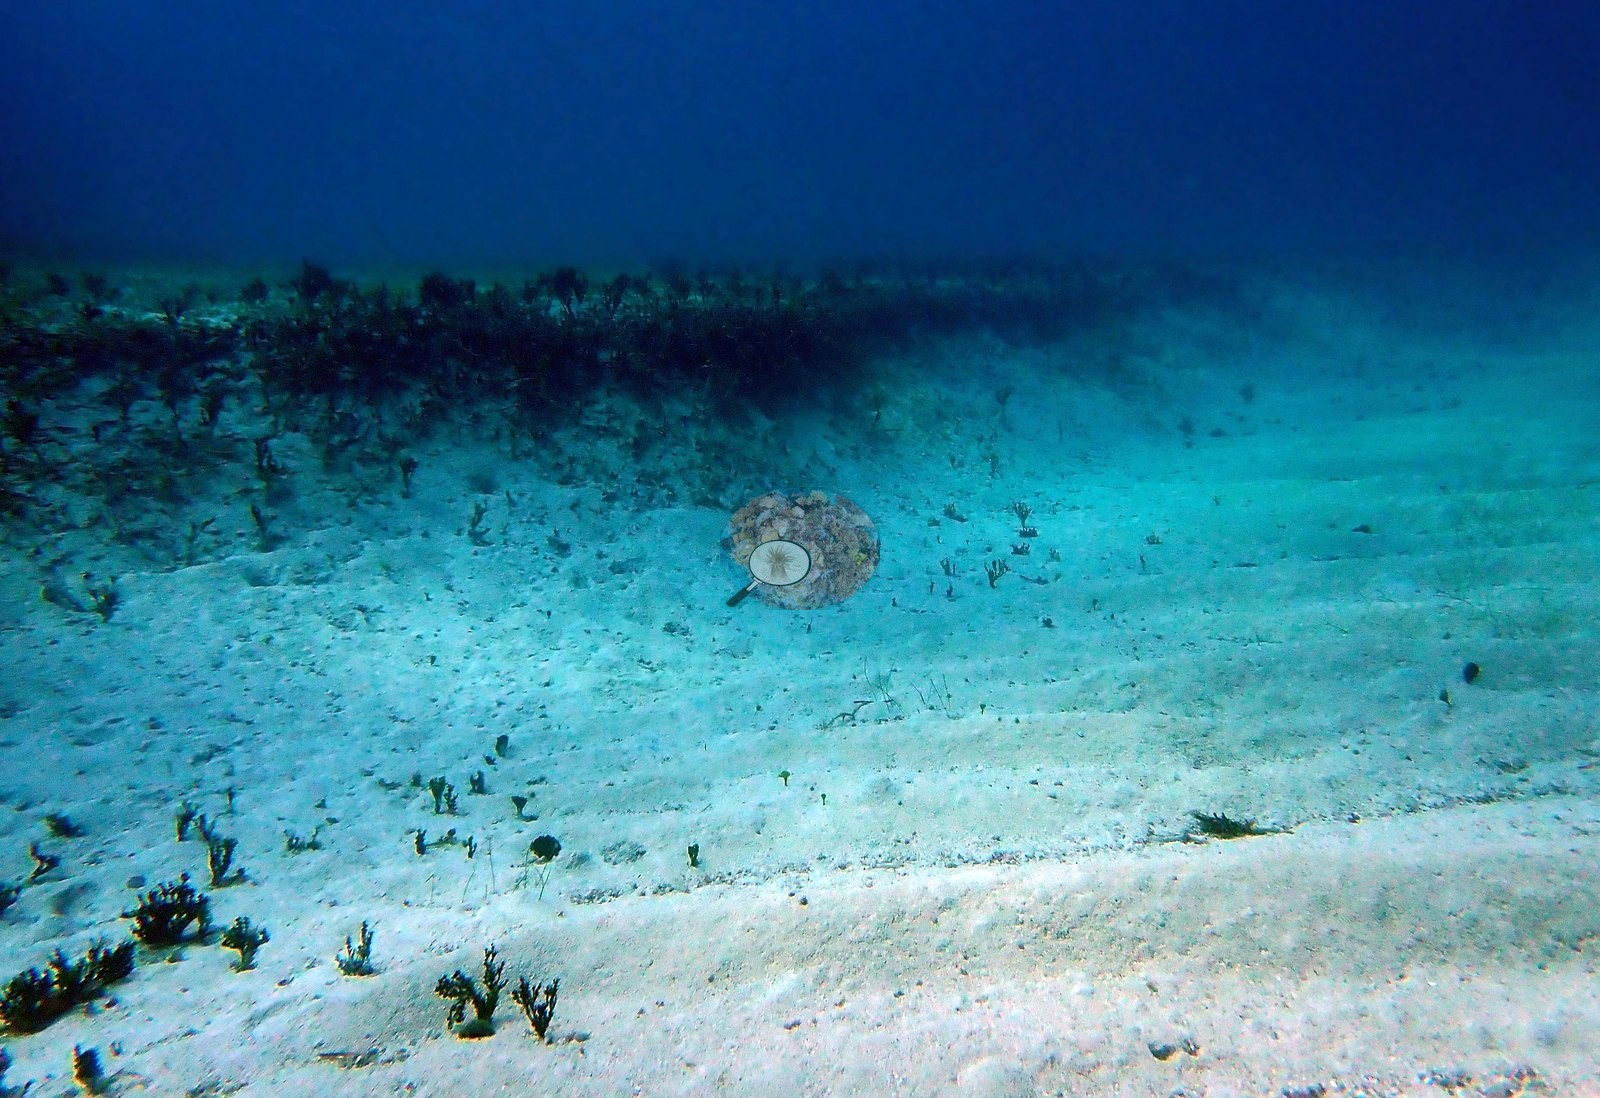
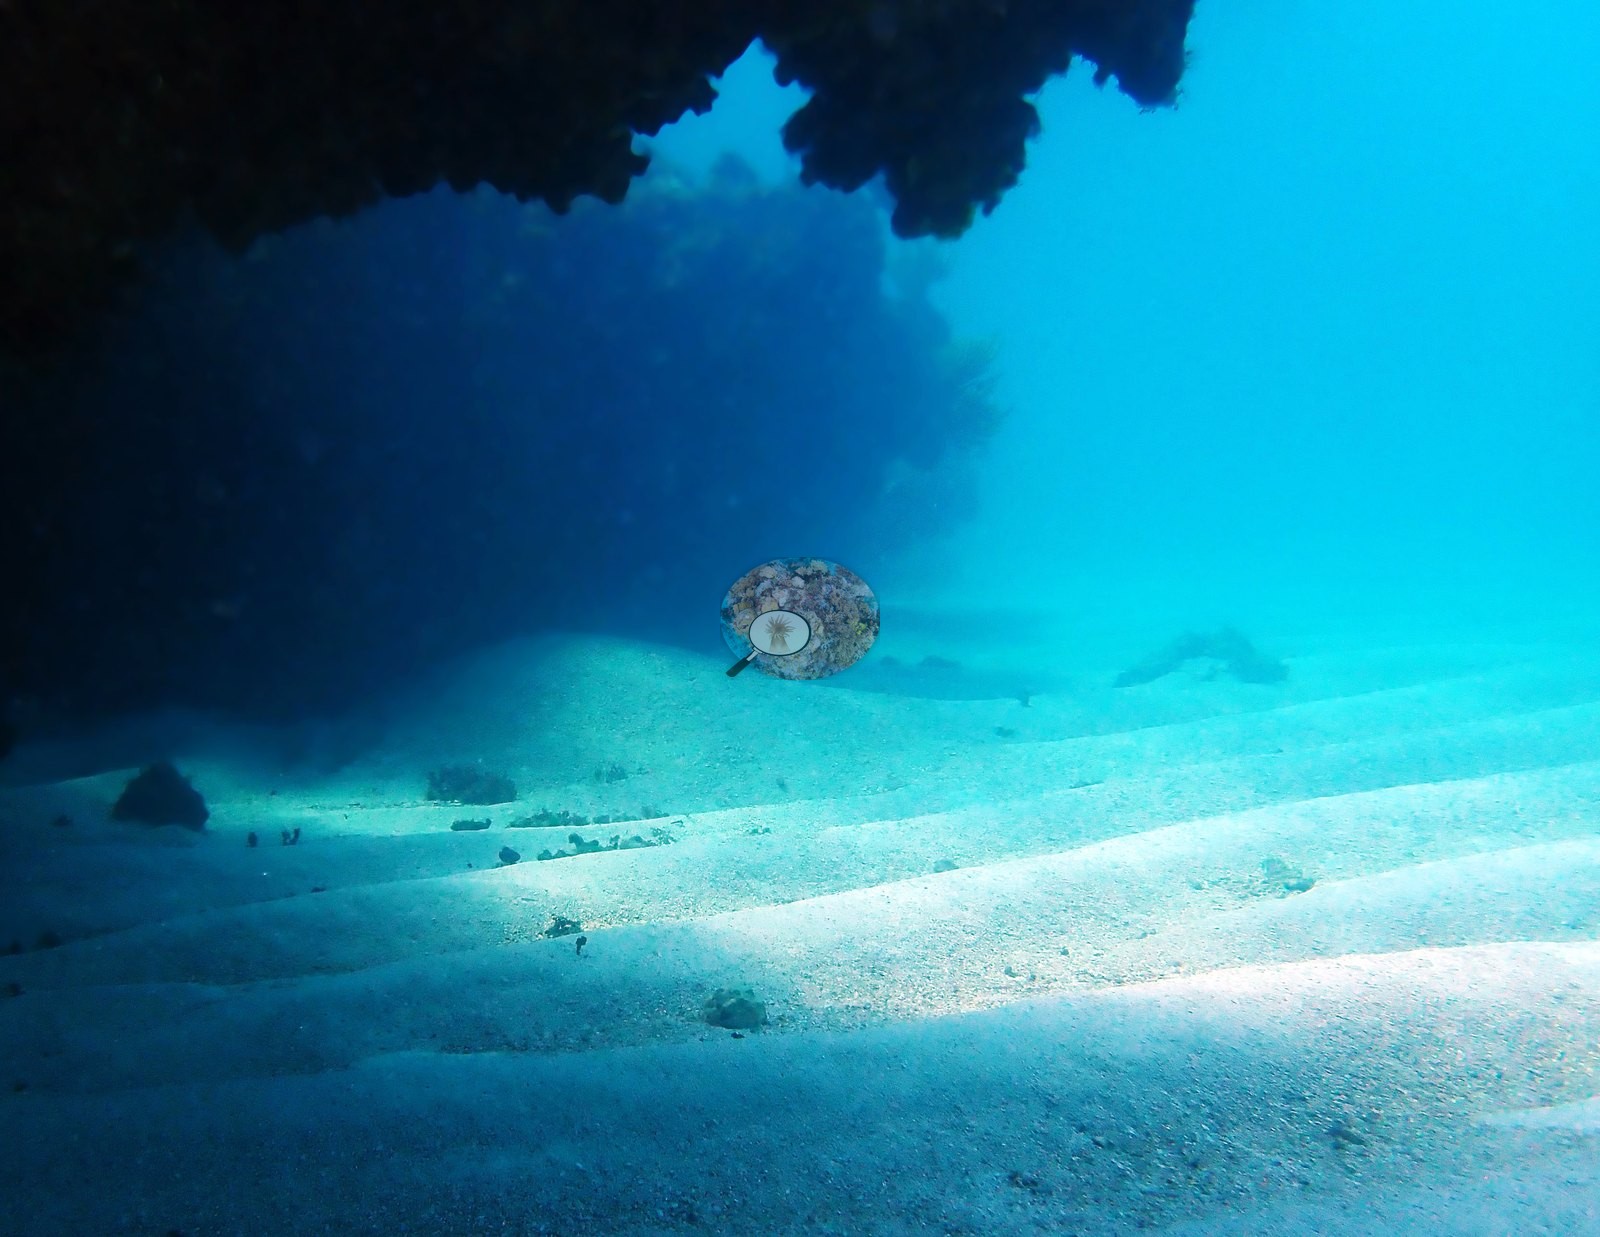
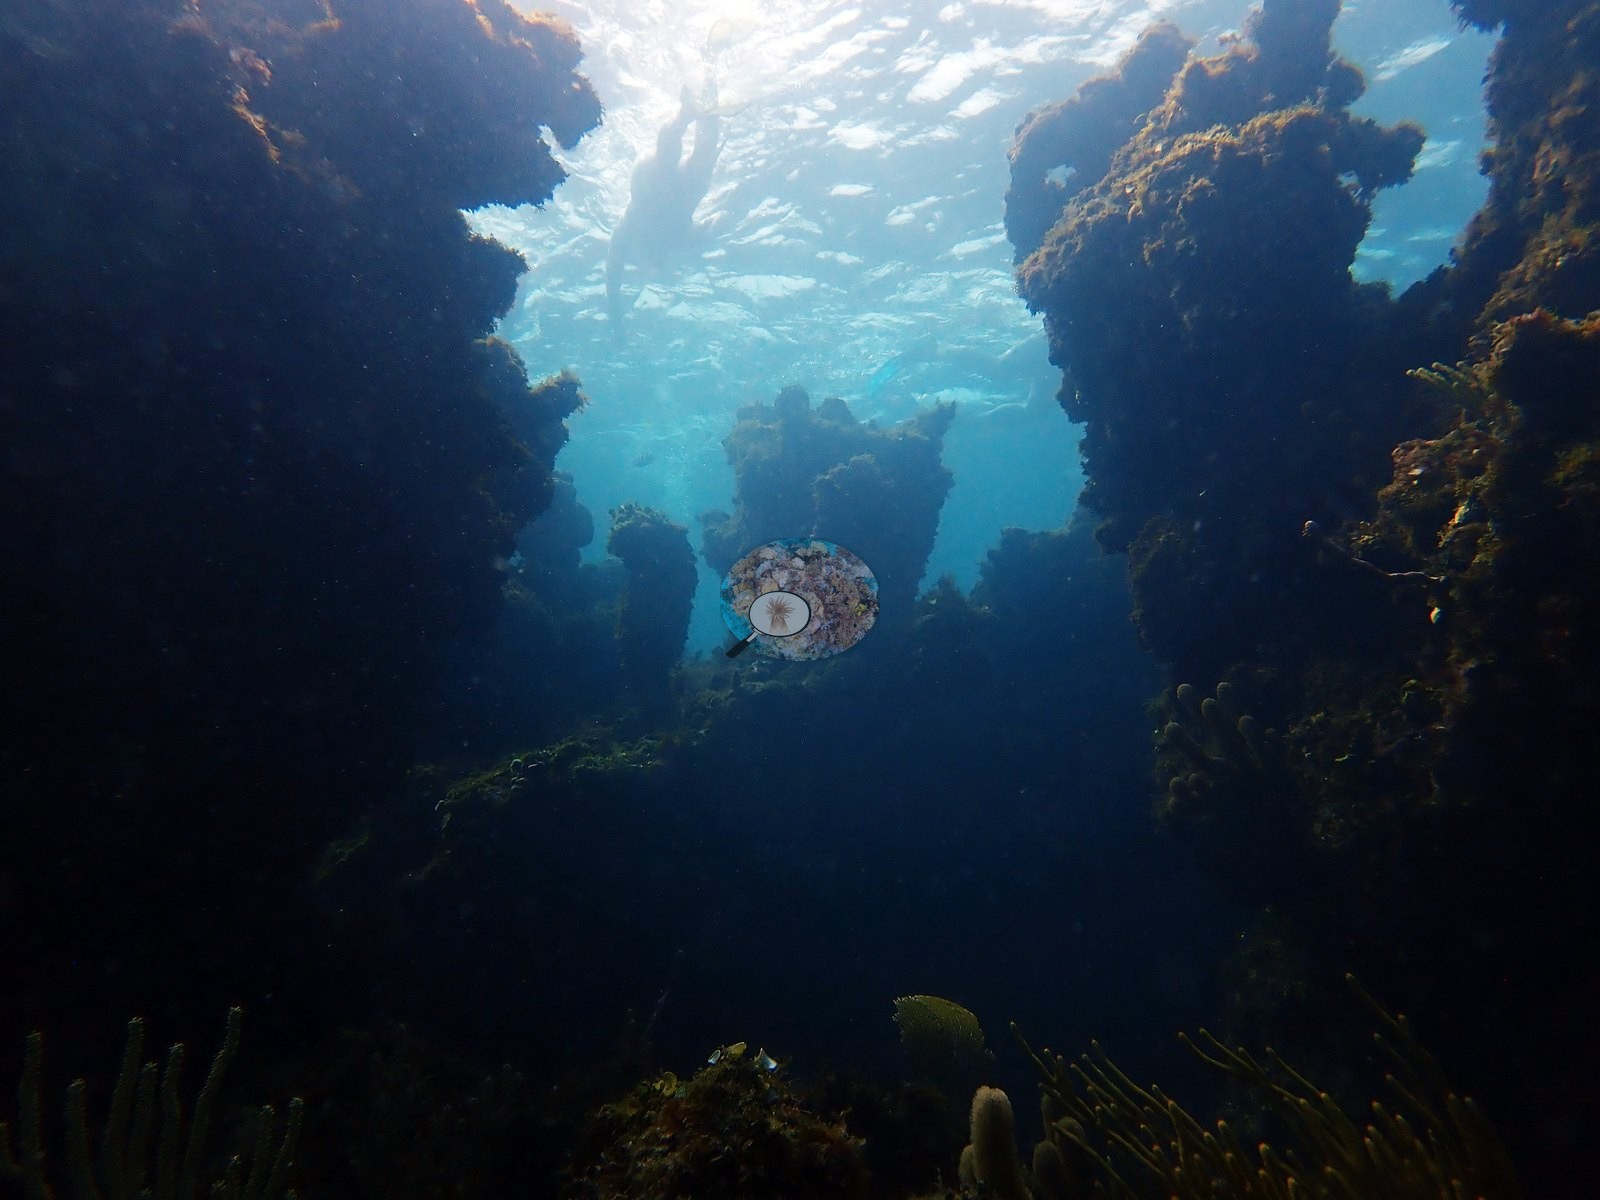
Live and dead elkhorn sit side by side across the site. The reef matrix between the elkhorn is low-relief hardbottom and spur-and-groove pavement carrying a dense red, pink, and mauve crust of coralline algae, turf, and encrusting sponge (e.g., Image 7, Image 8, Image 20, Image 21, Image 31, Image 35, Image 55, Image 56), broken by broad expanses of rippled white sand and rubble (e.g., Image 2, Image 17, Image 18, Image 25, Image 69) and by a couple of narrow shaded swim-throughs and ledges (e.g., Image 22, Image 23, Image 25).
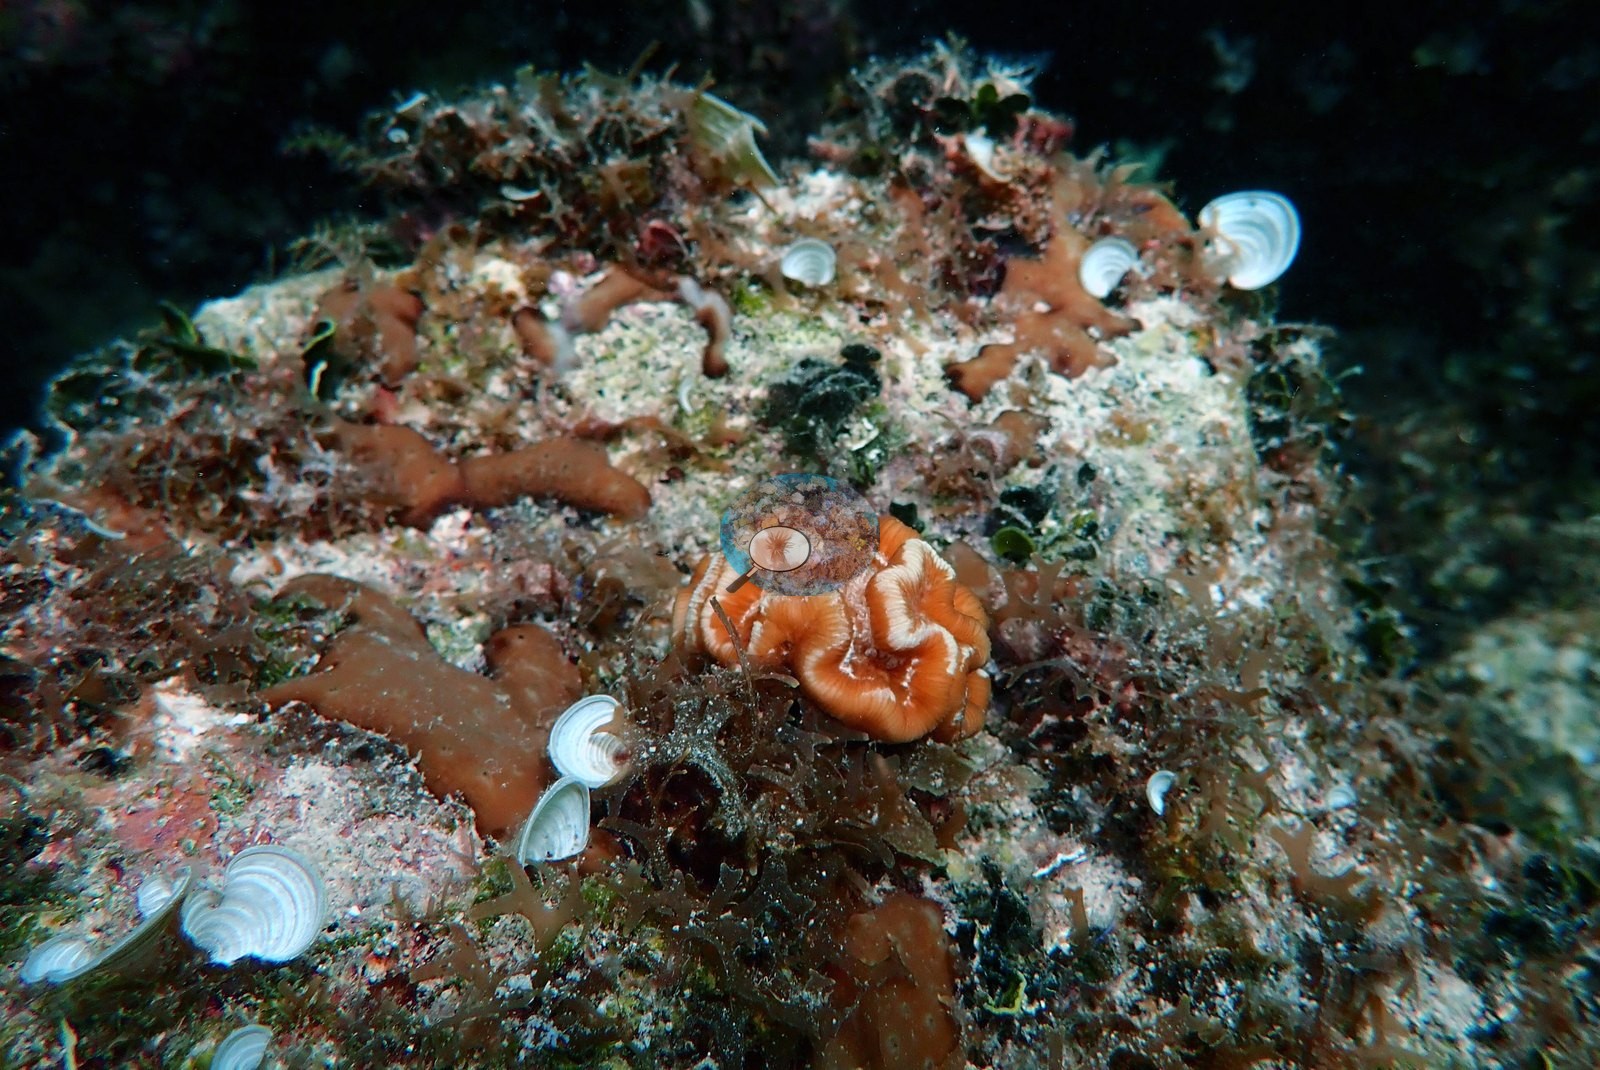
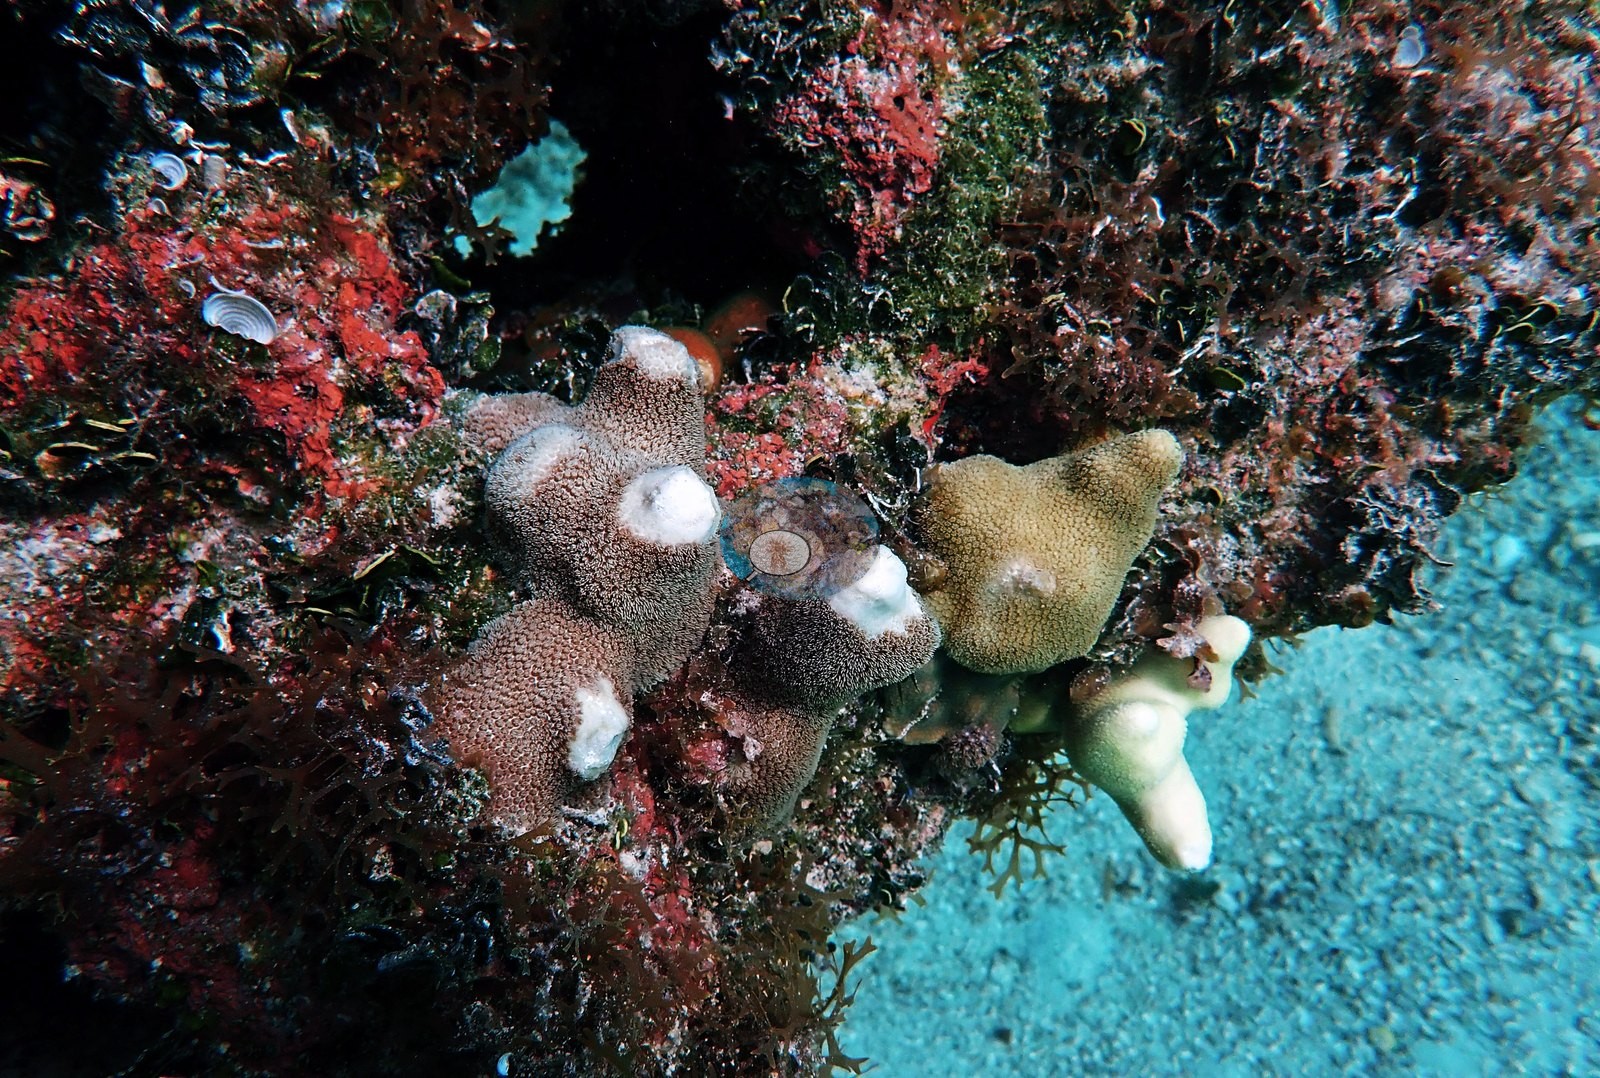
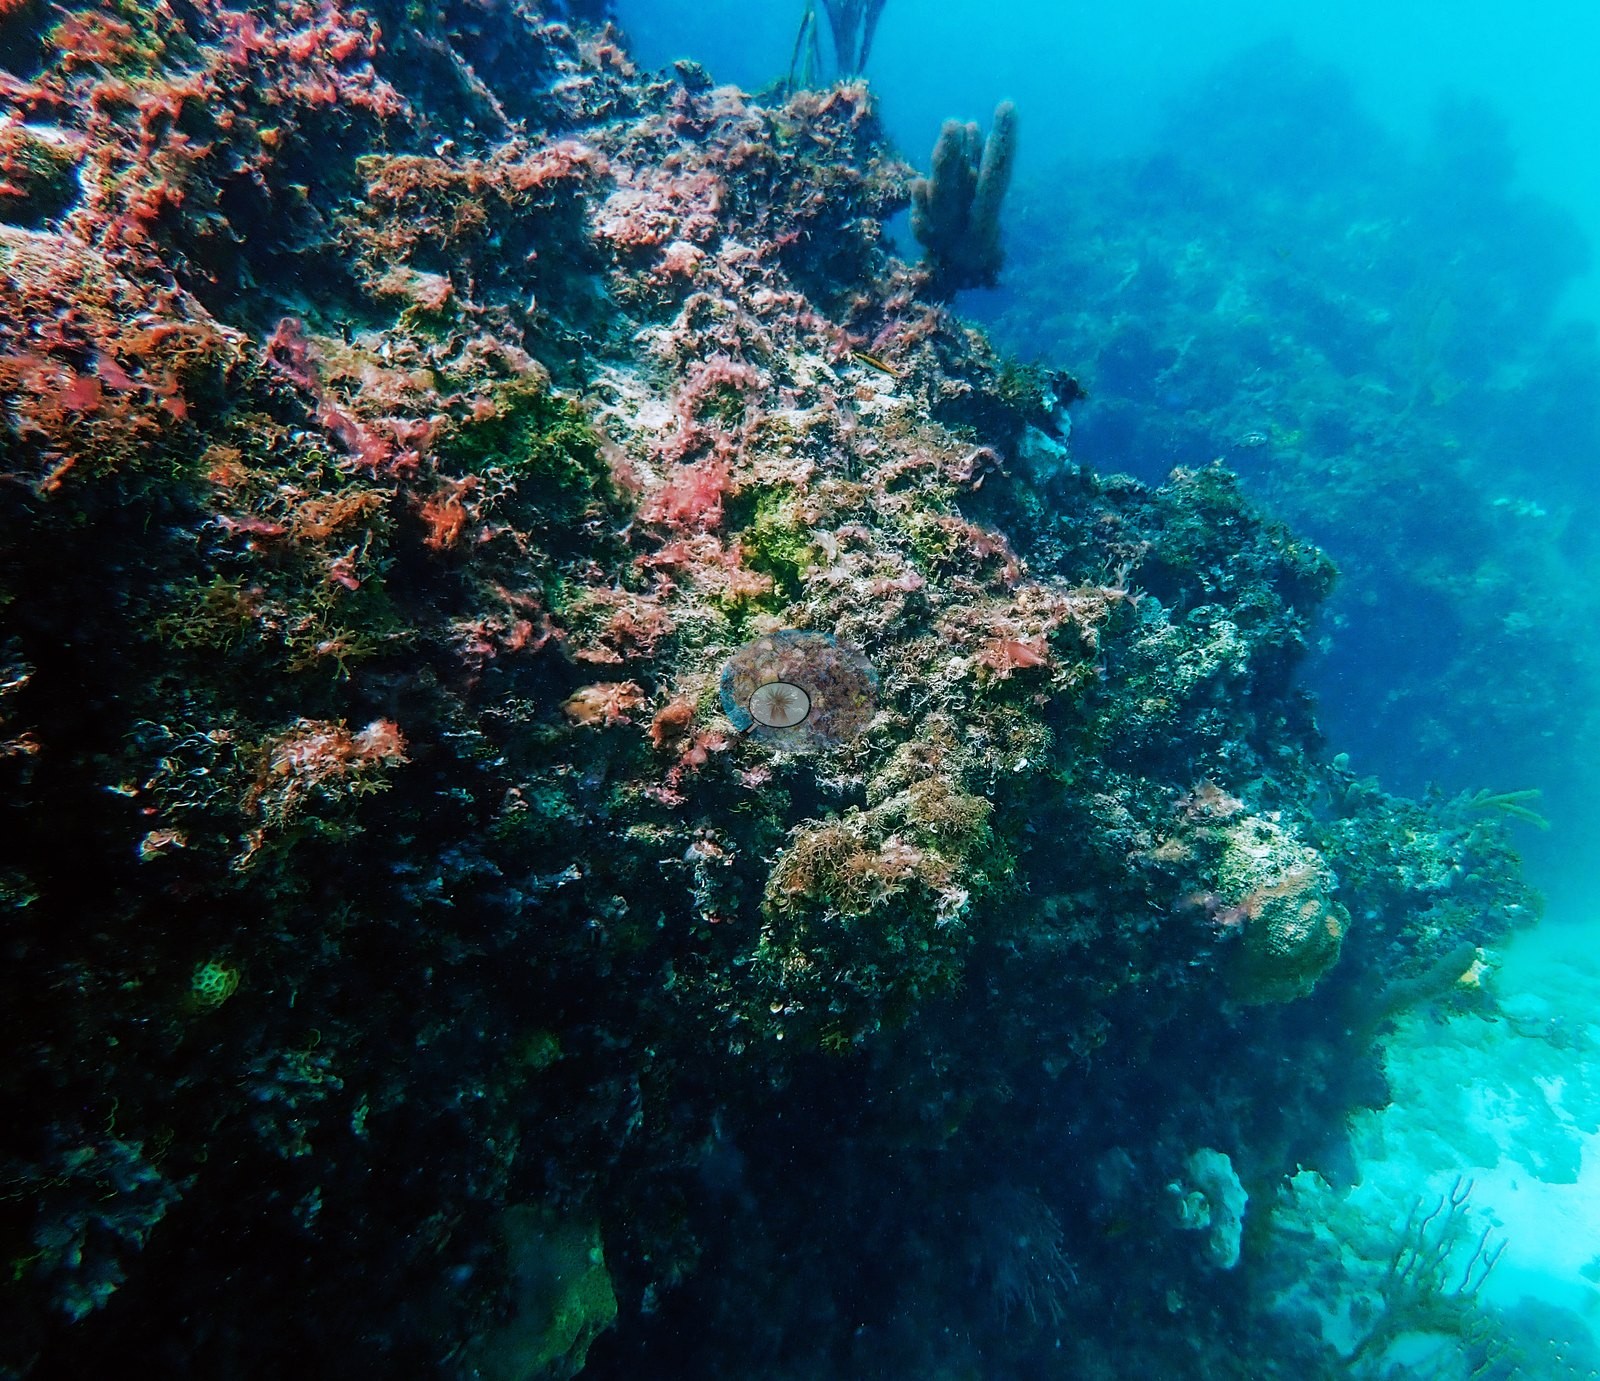
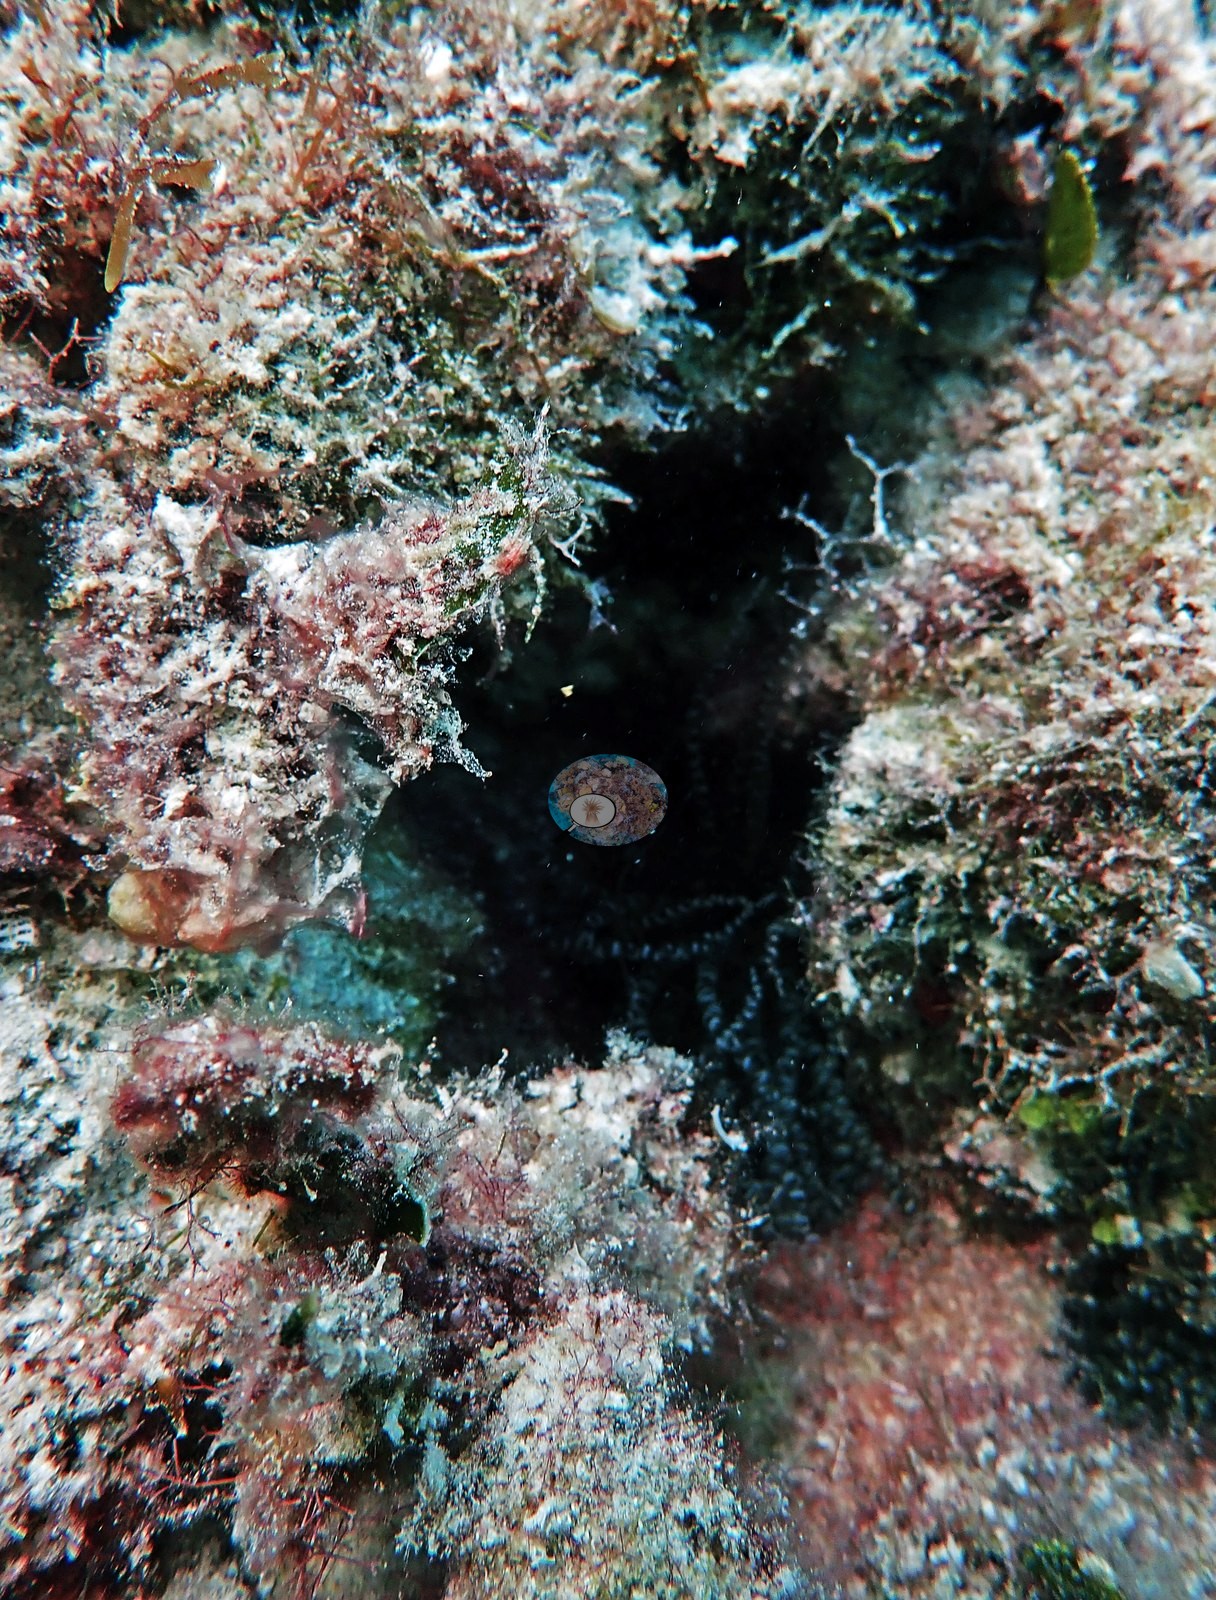
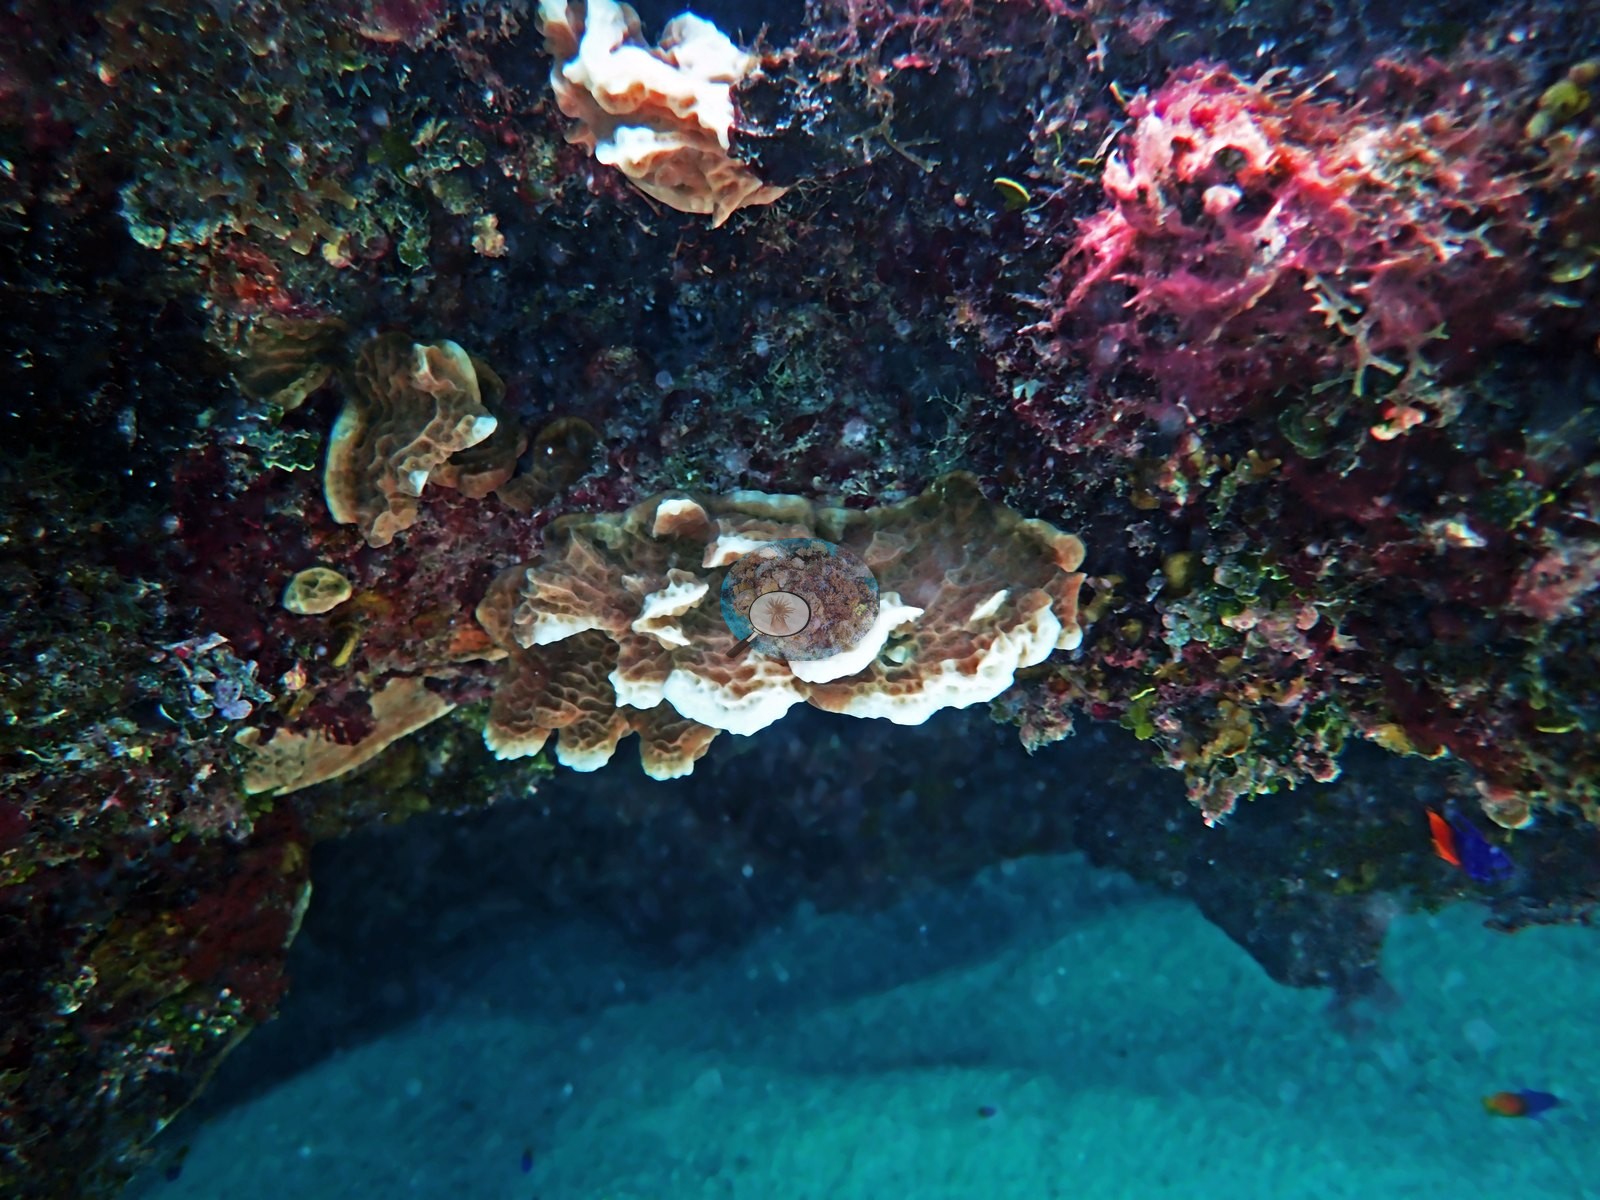
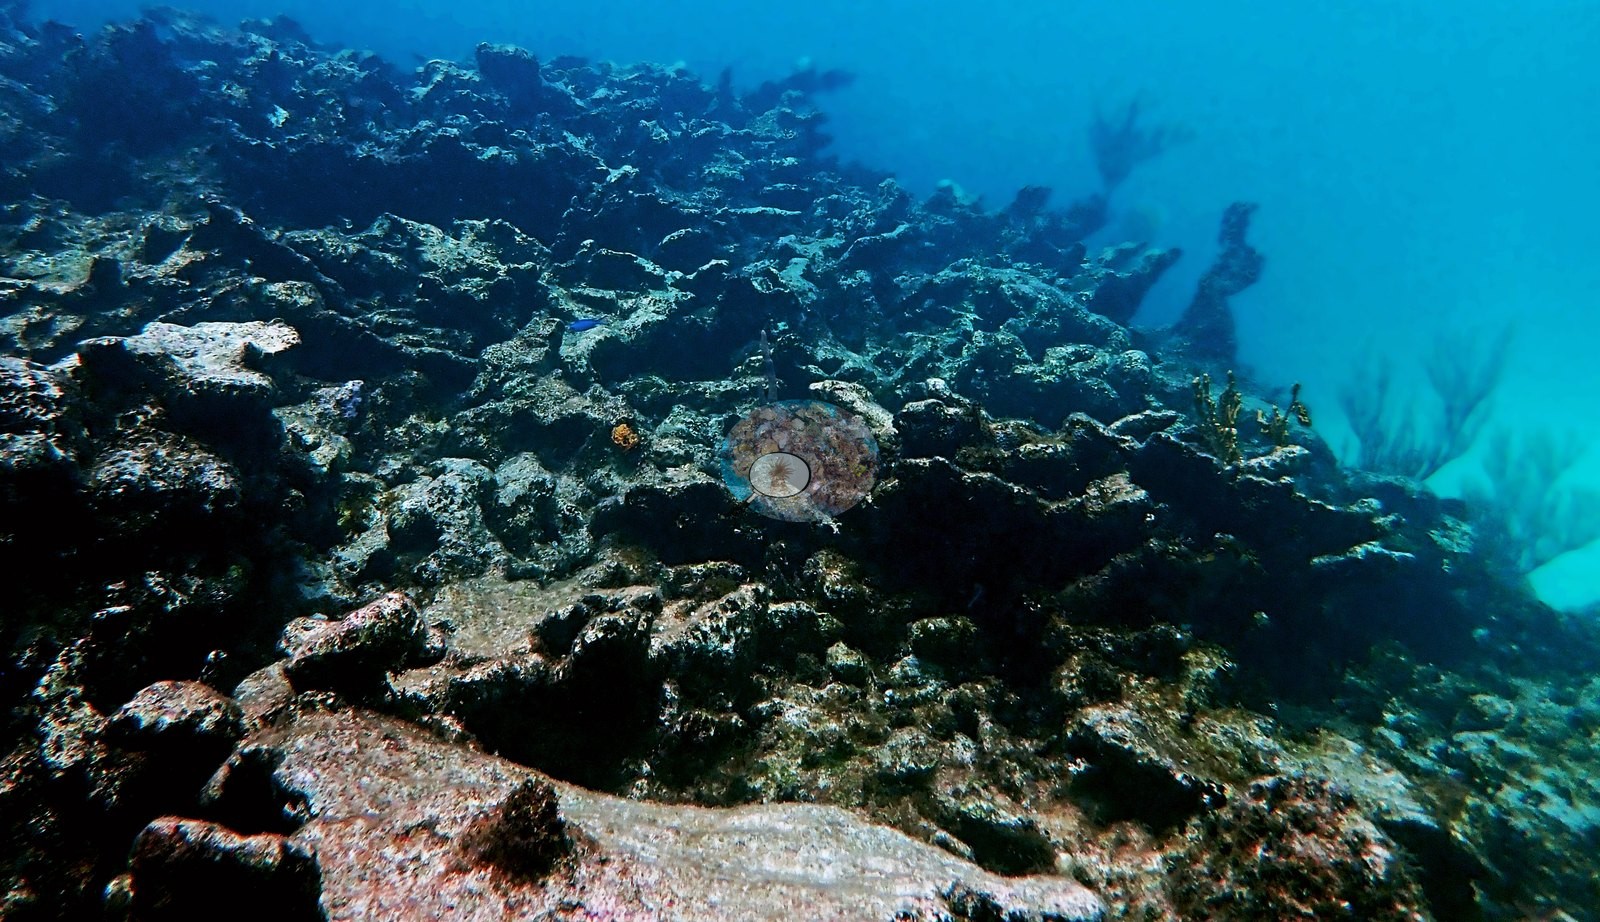
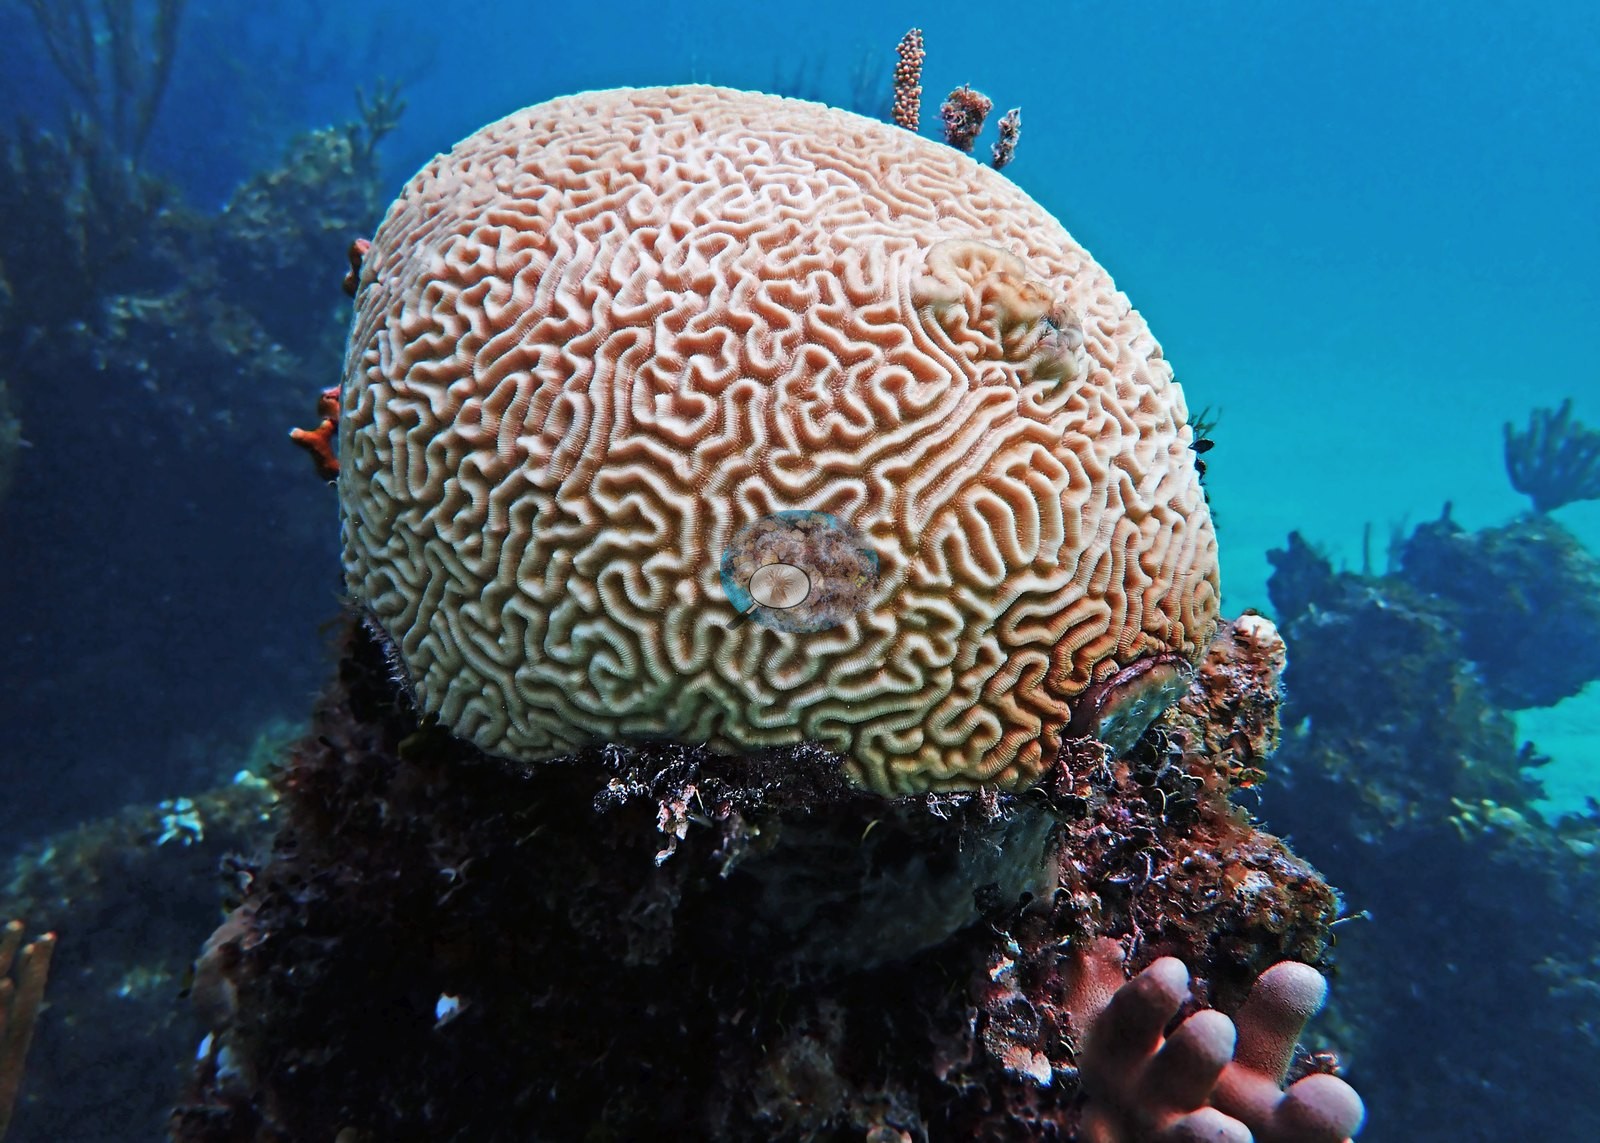
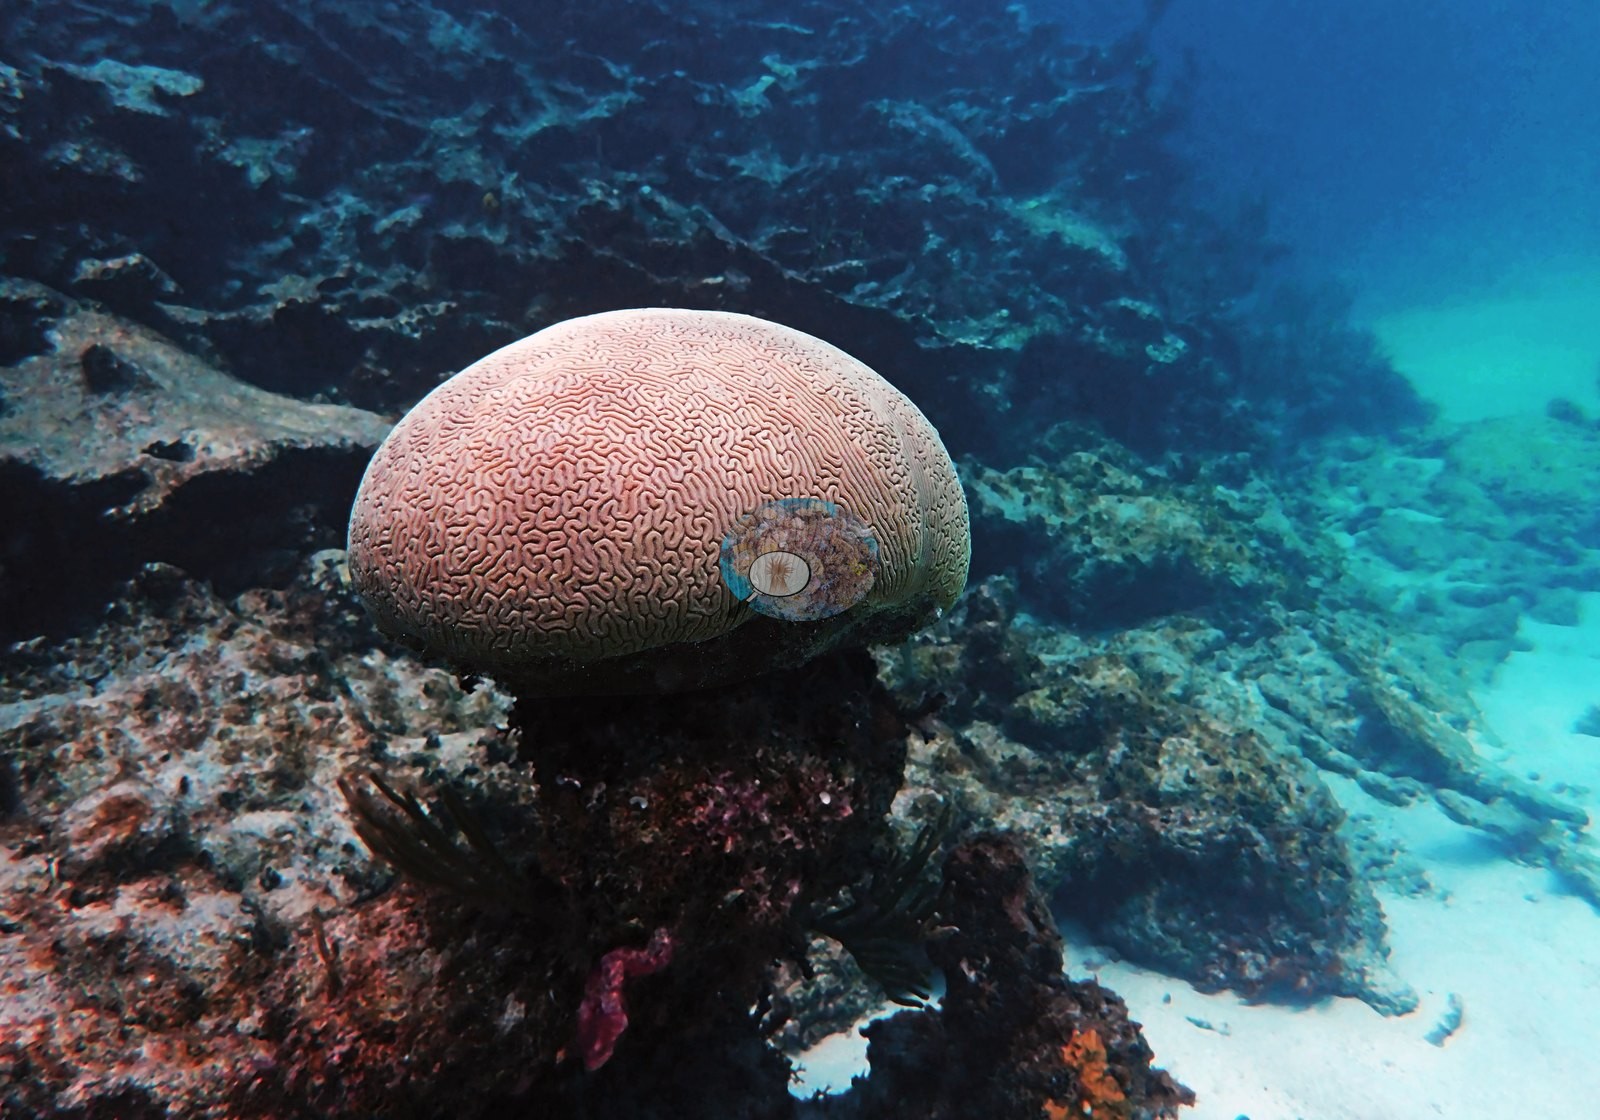
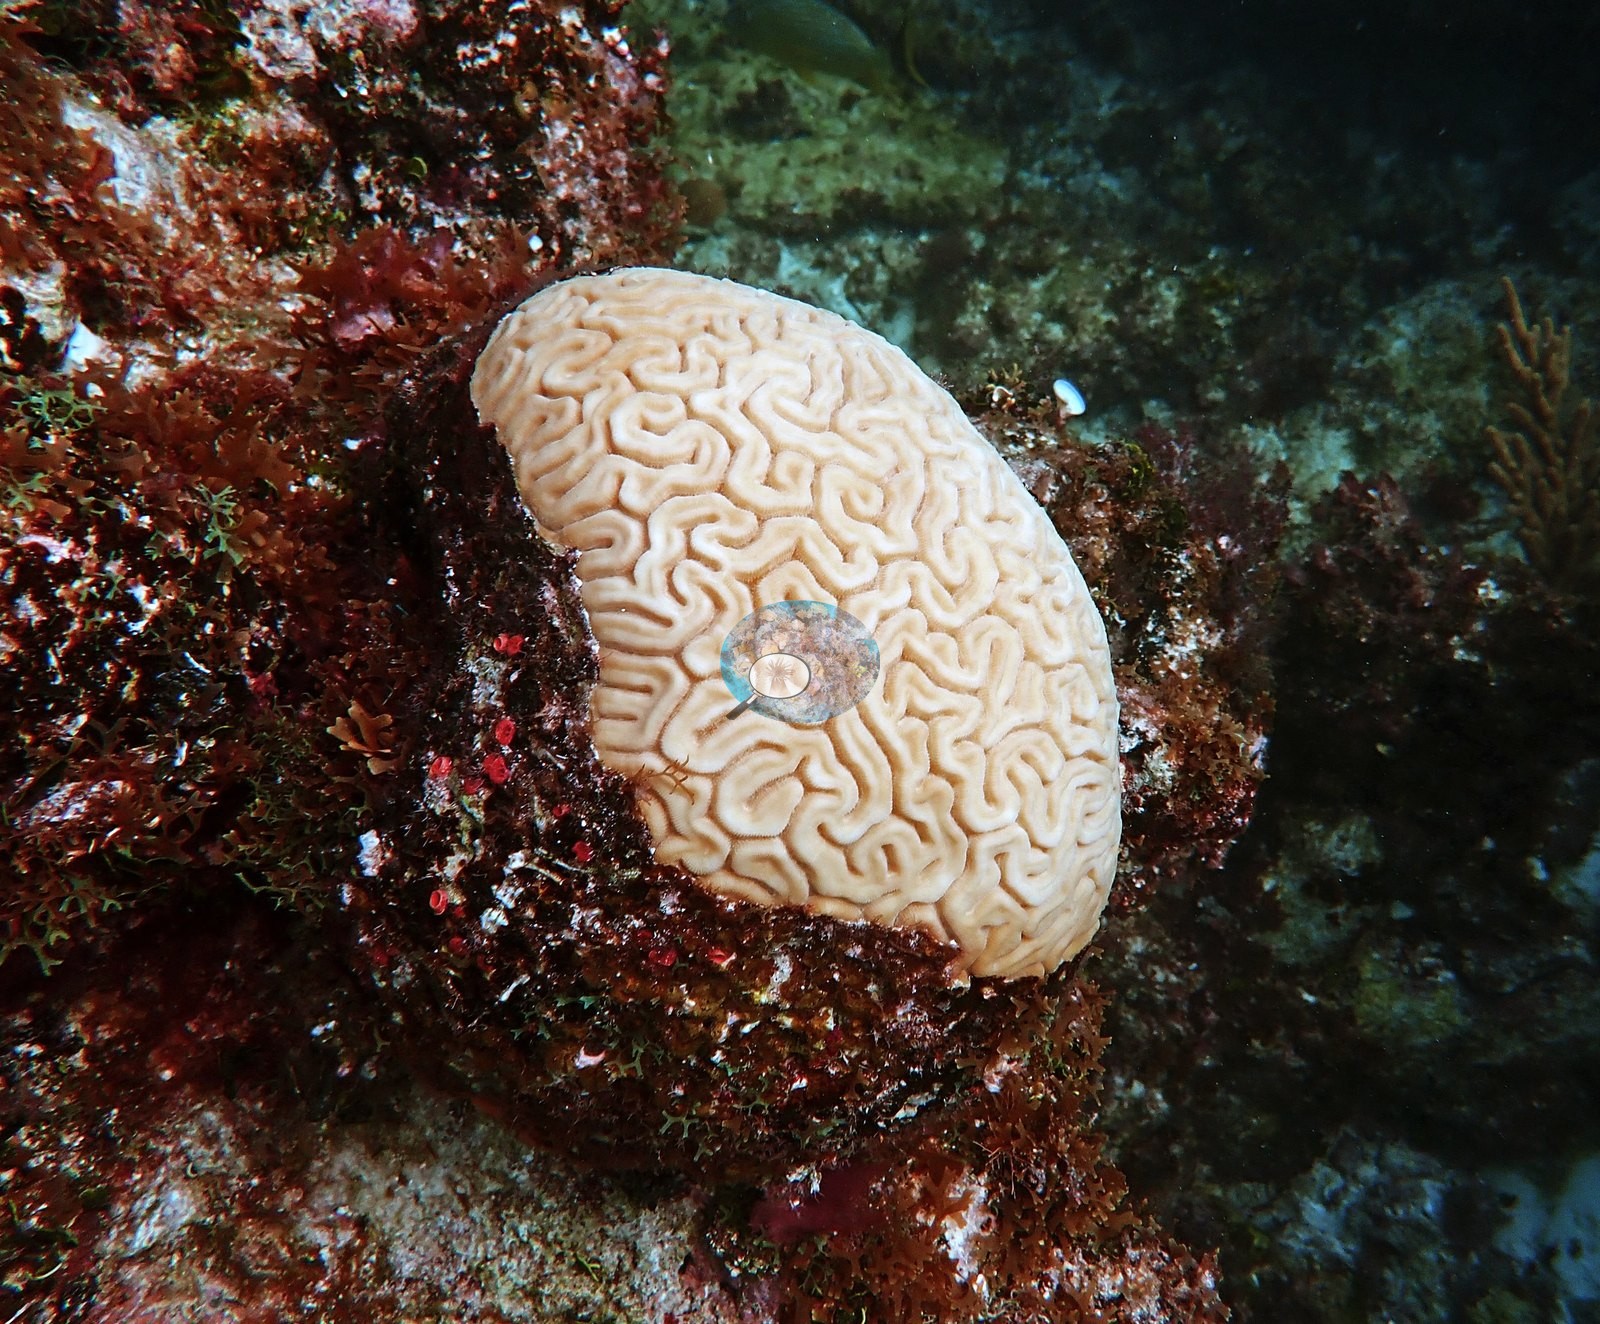
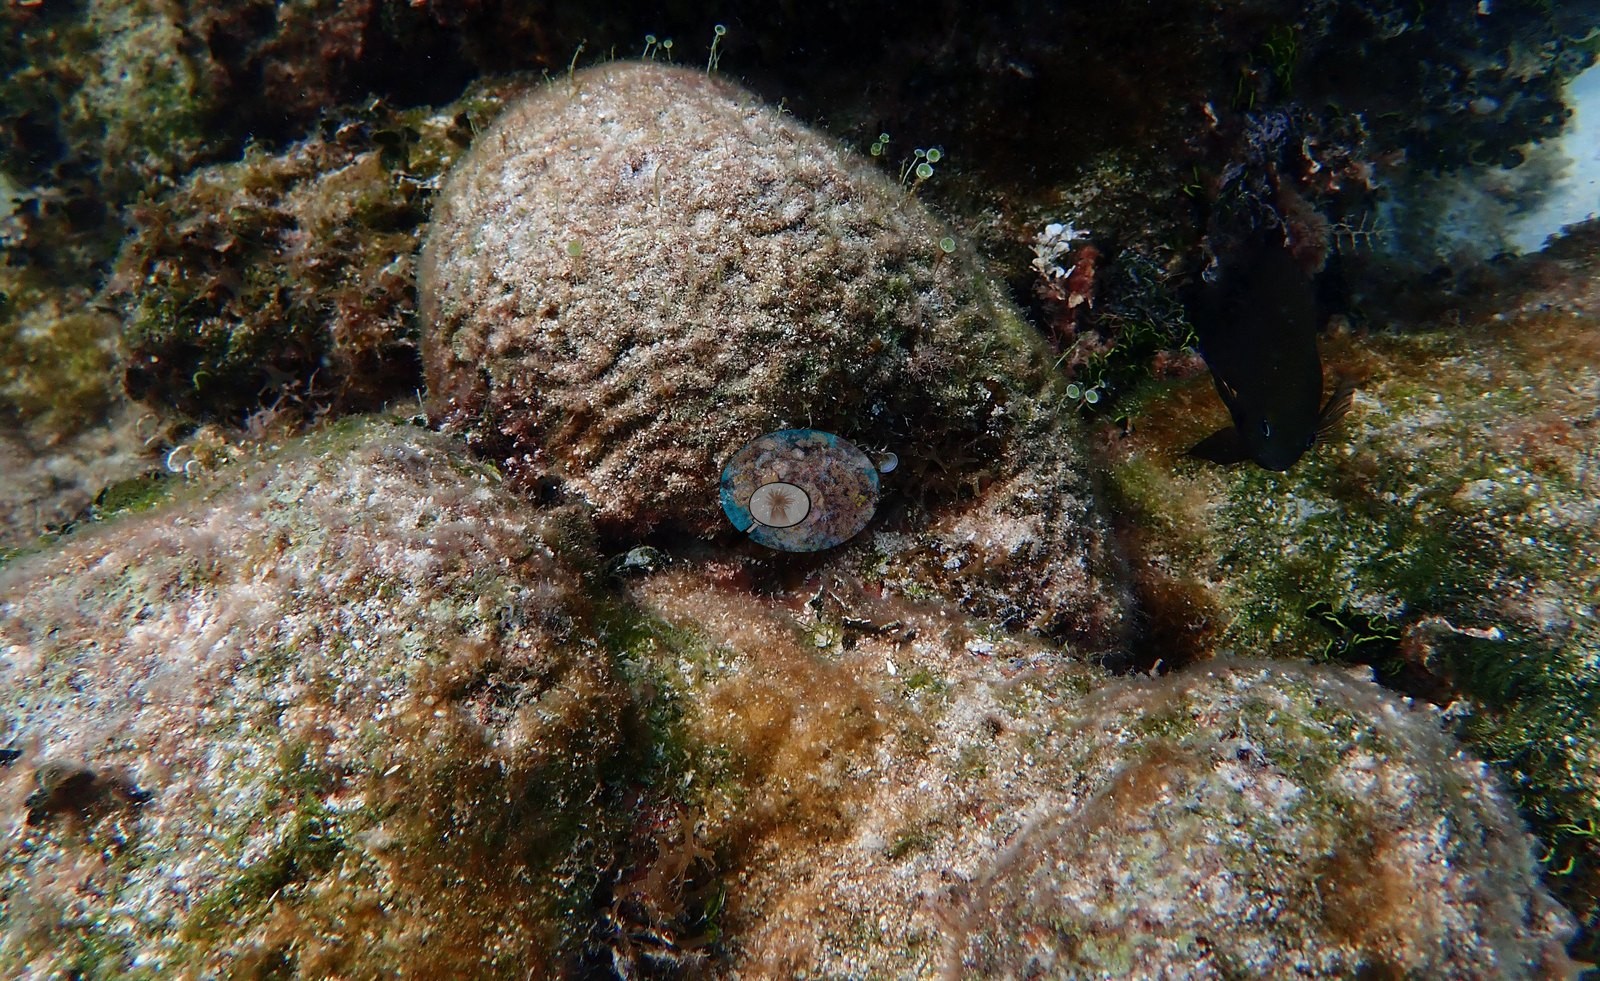
Massive corals are present as scattered discrete heads rather than as a continuous framework: large brain corals with strongly meandering ridges, several of them intact and fully pigmented (e.g., Image 9, Image 34, and Image 44, the last two recorded by Anderson as healthy and not diseased), against one large gray, algal-covered dome recorded as dead (e.g., Image 33).
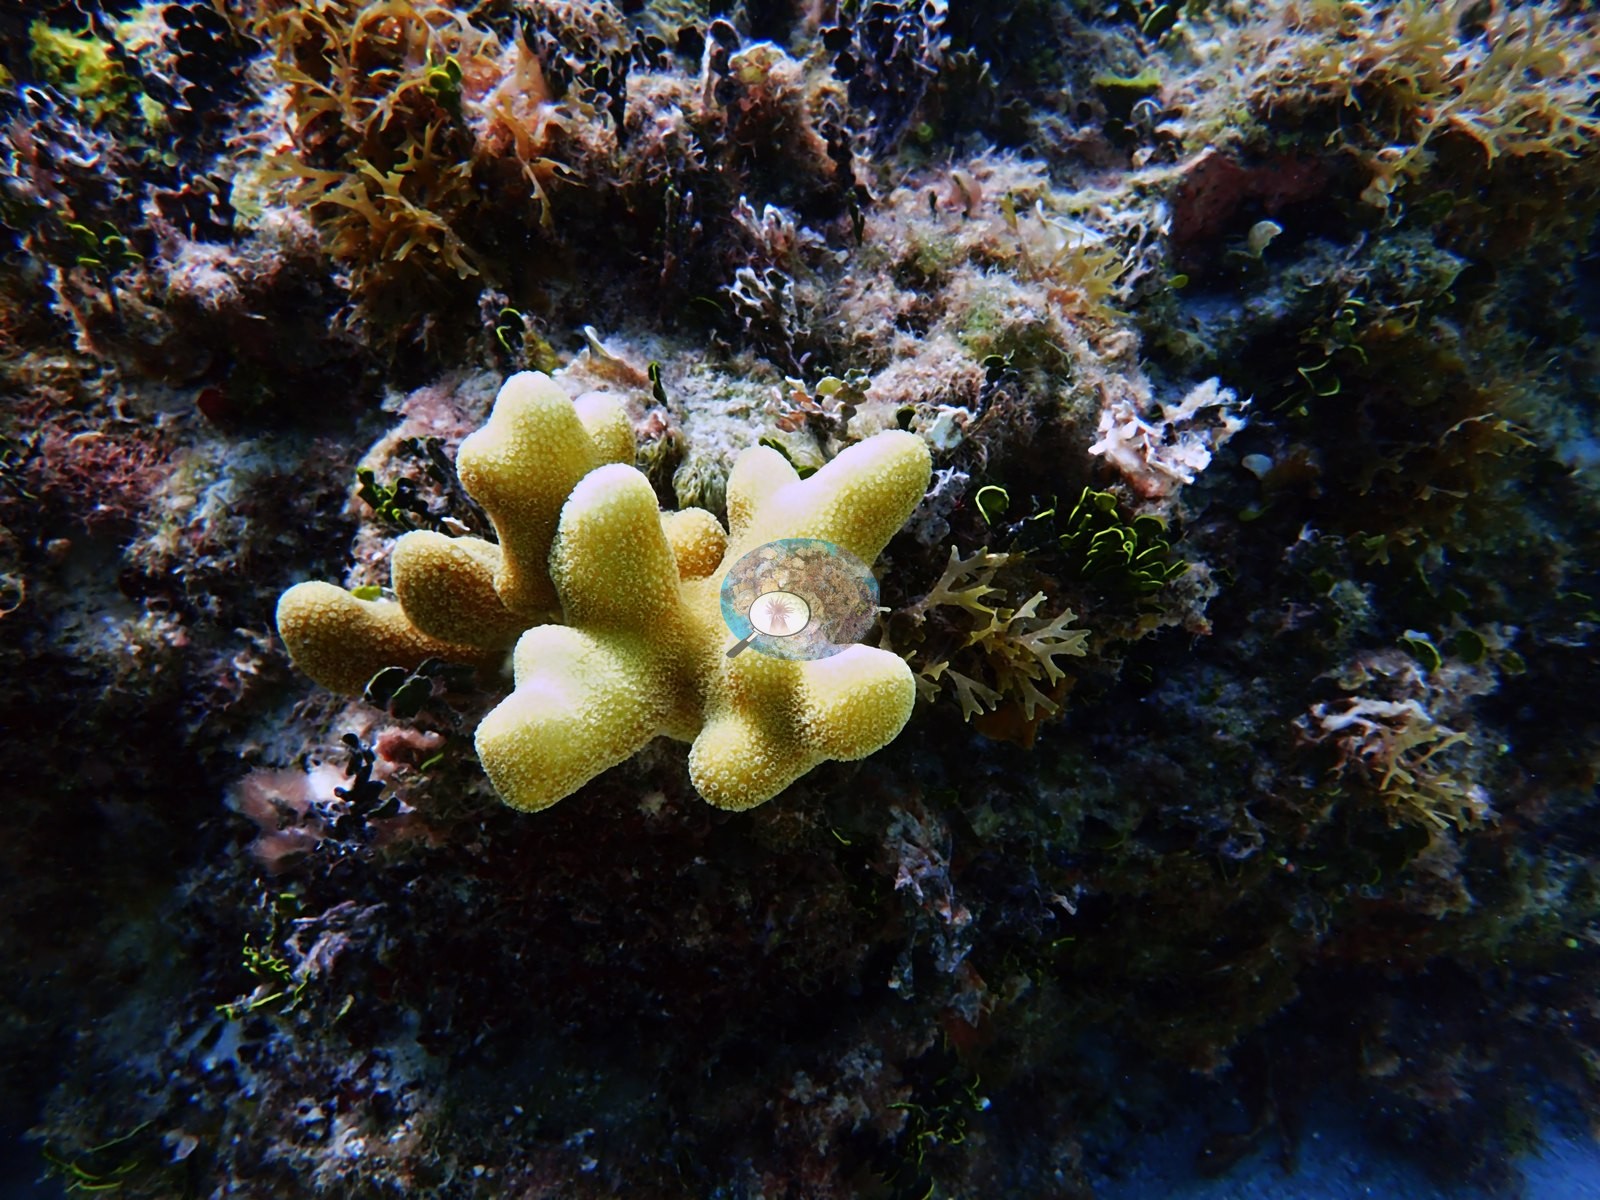
Mustard-yellow to olive mounding colonies recur (e.g., Image 19, Image 24, Image 72, Image 73, Image 70), one of which Anderson recorded as a diseased poritid (e.g., Image 70).
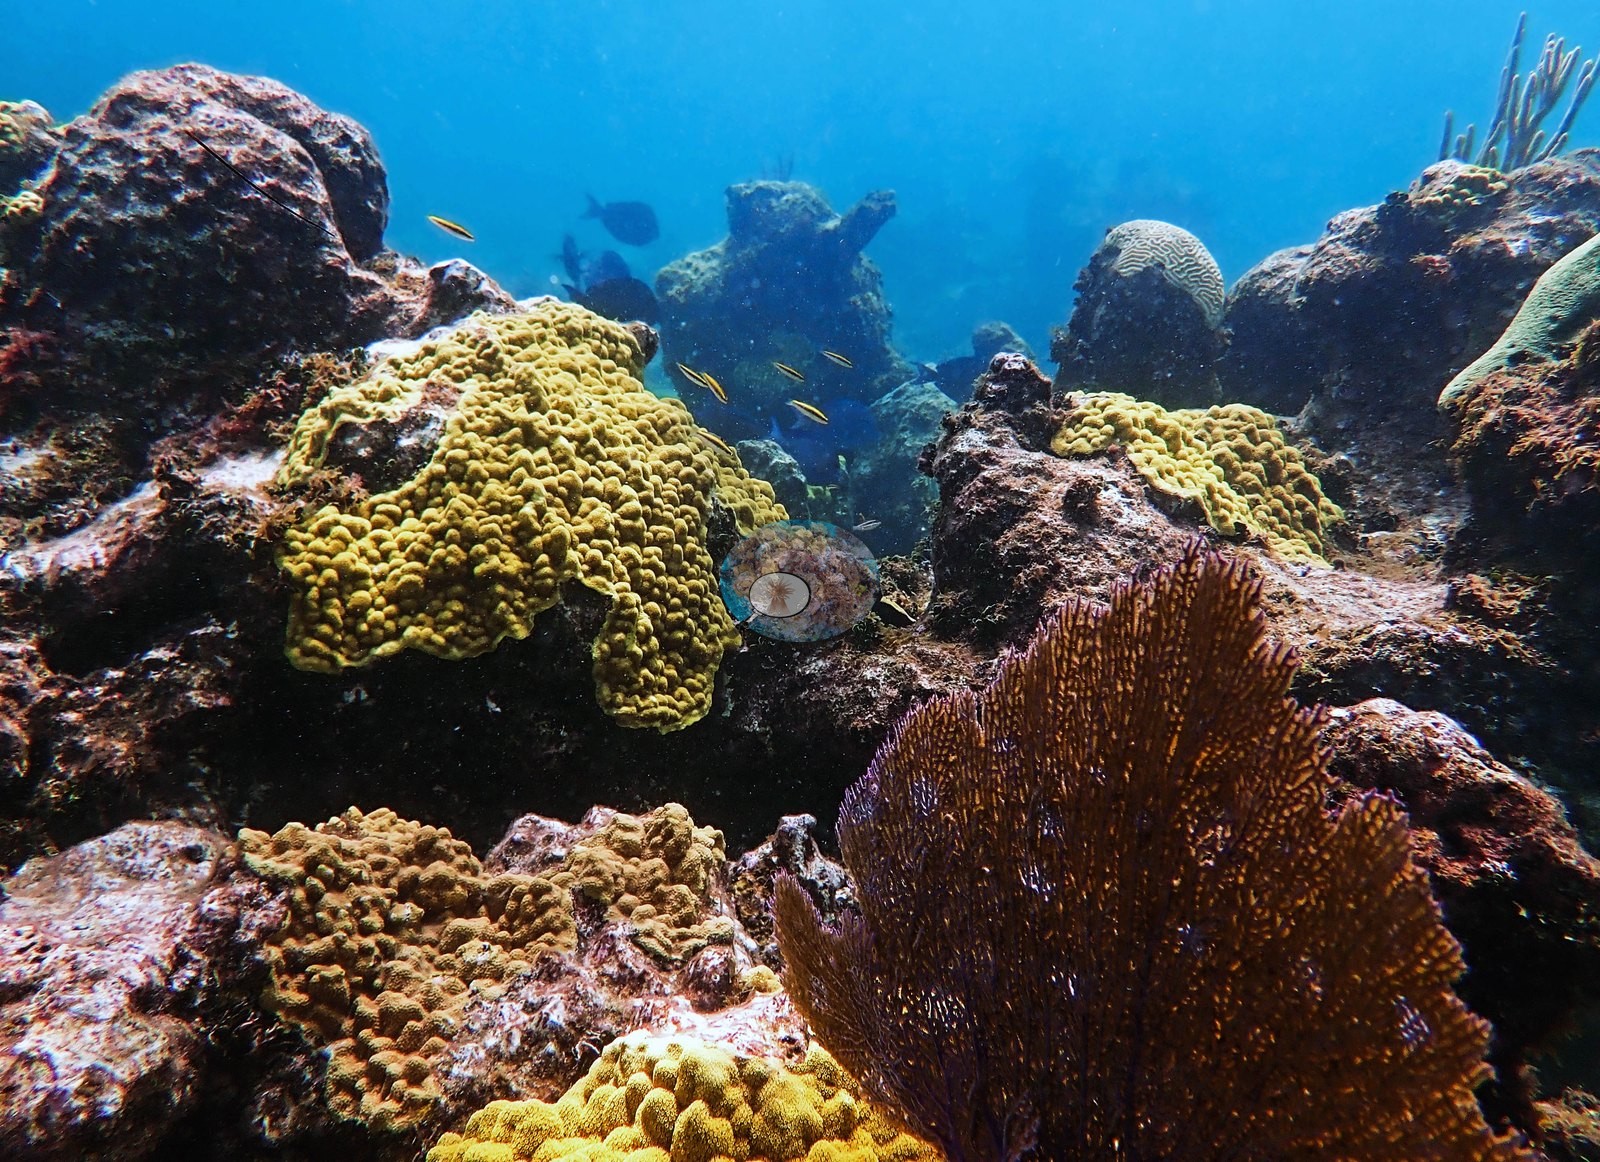
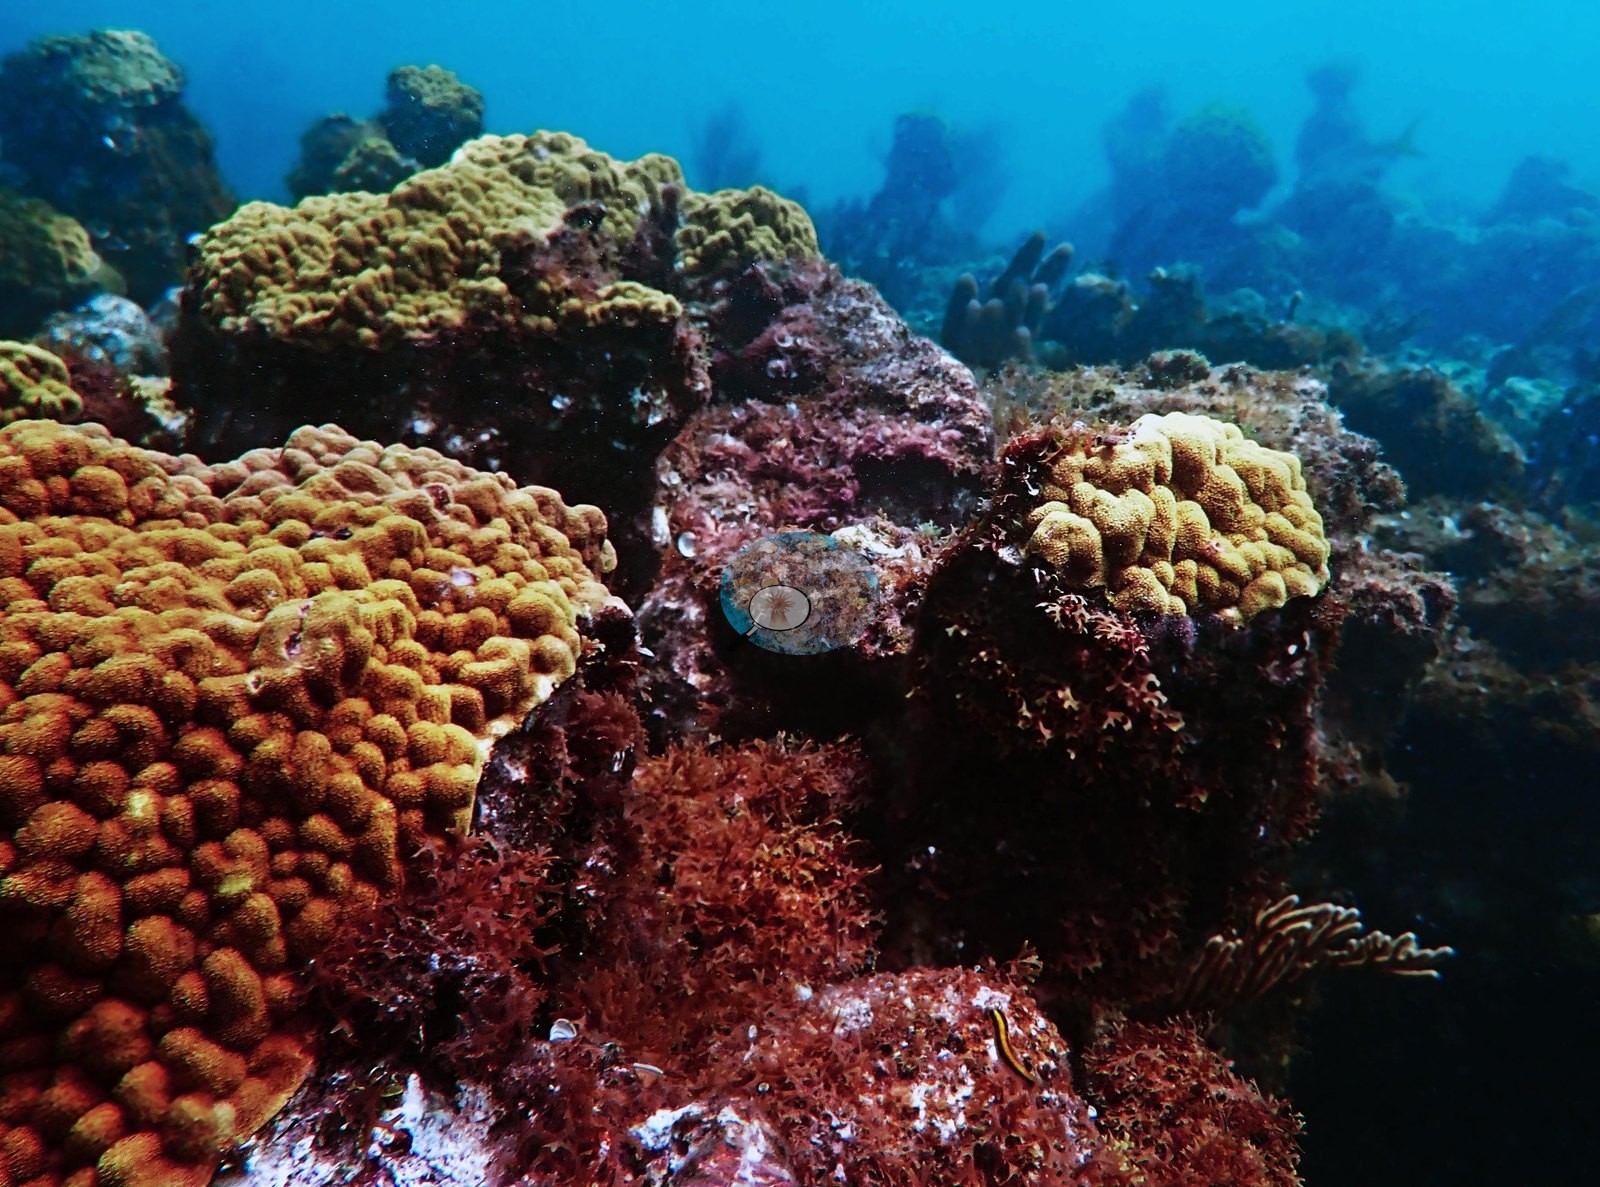
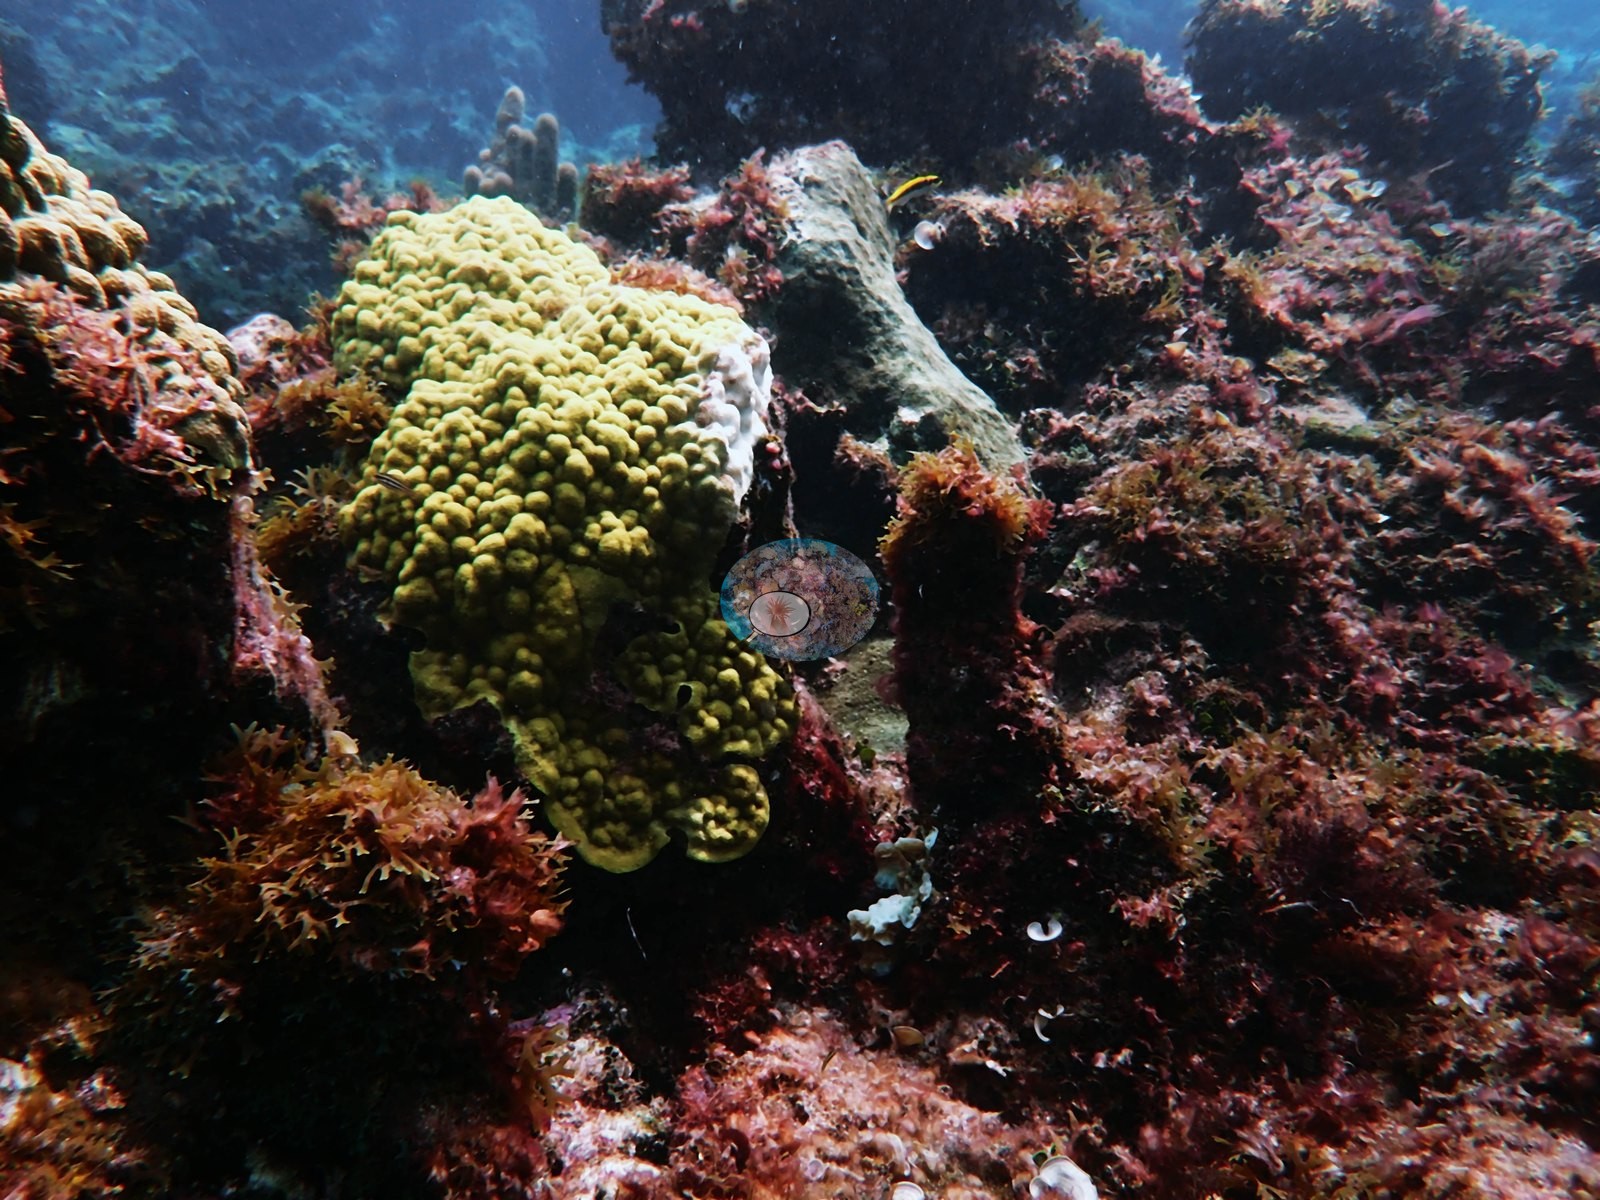
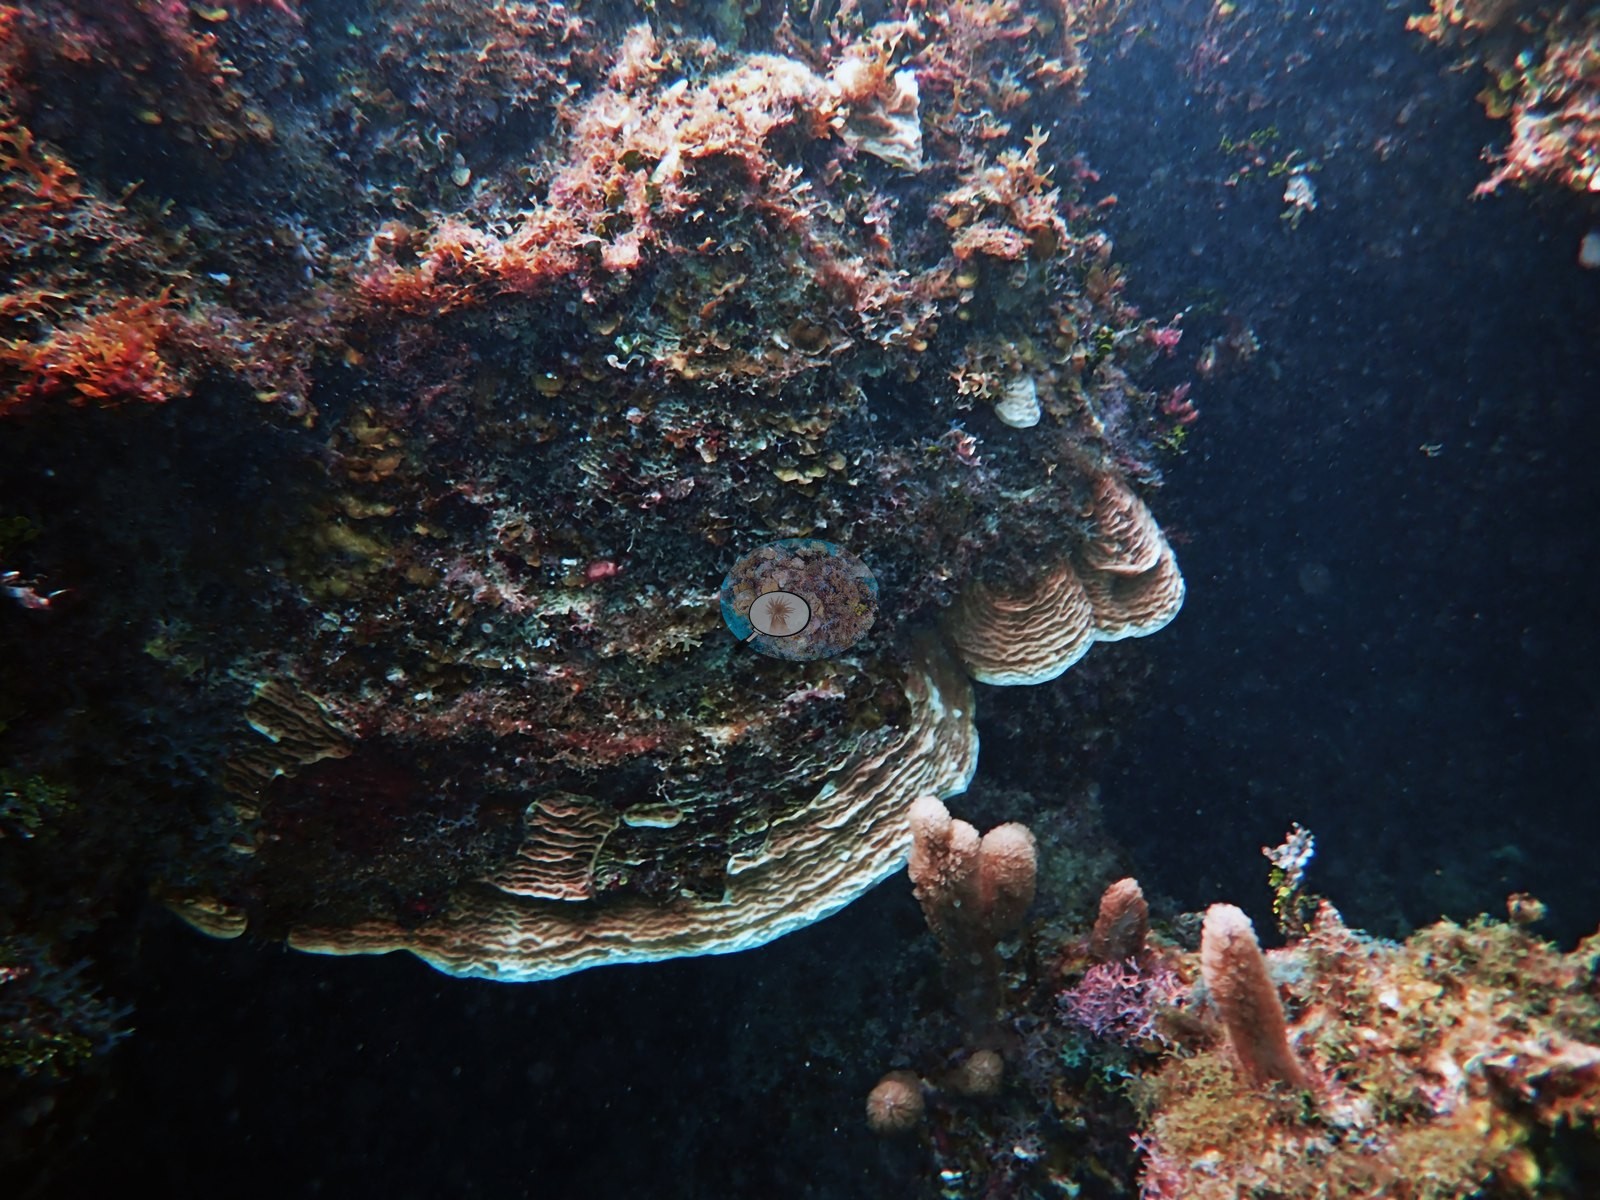
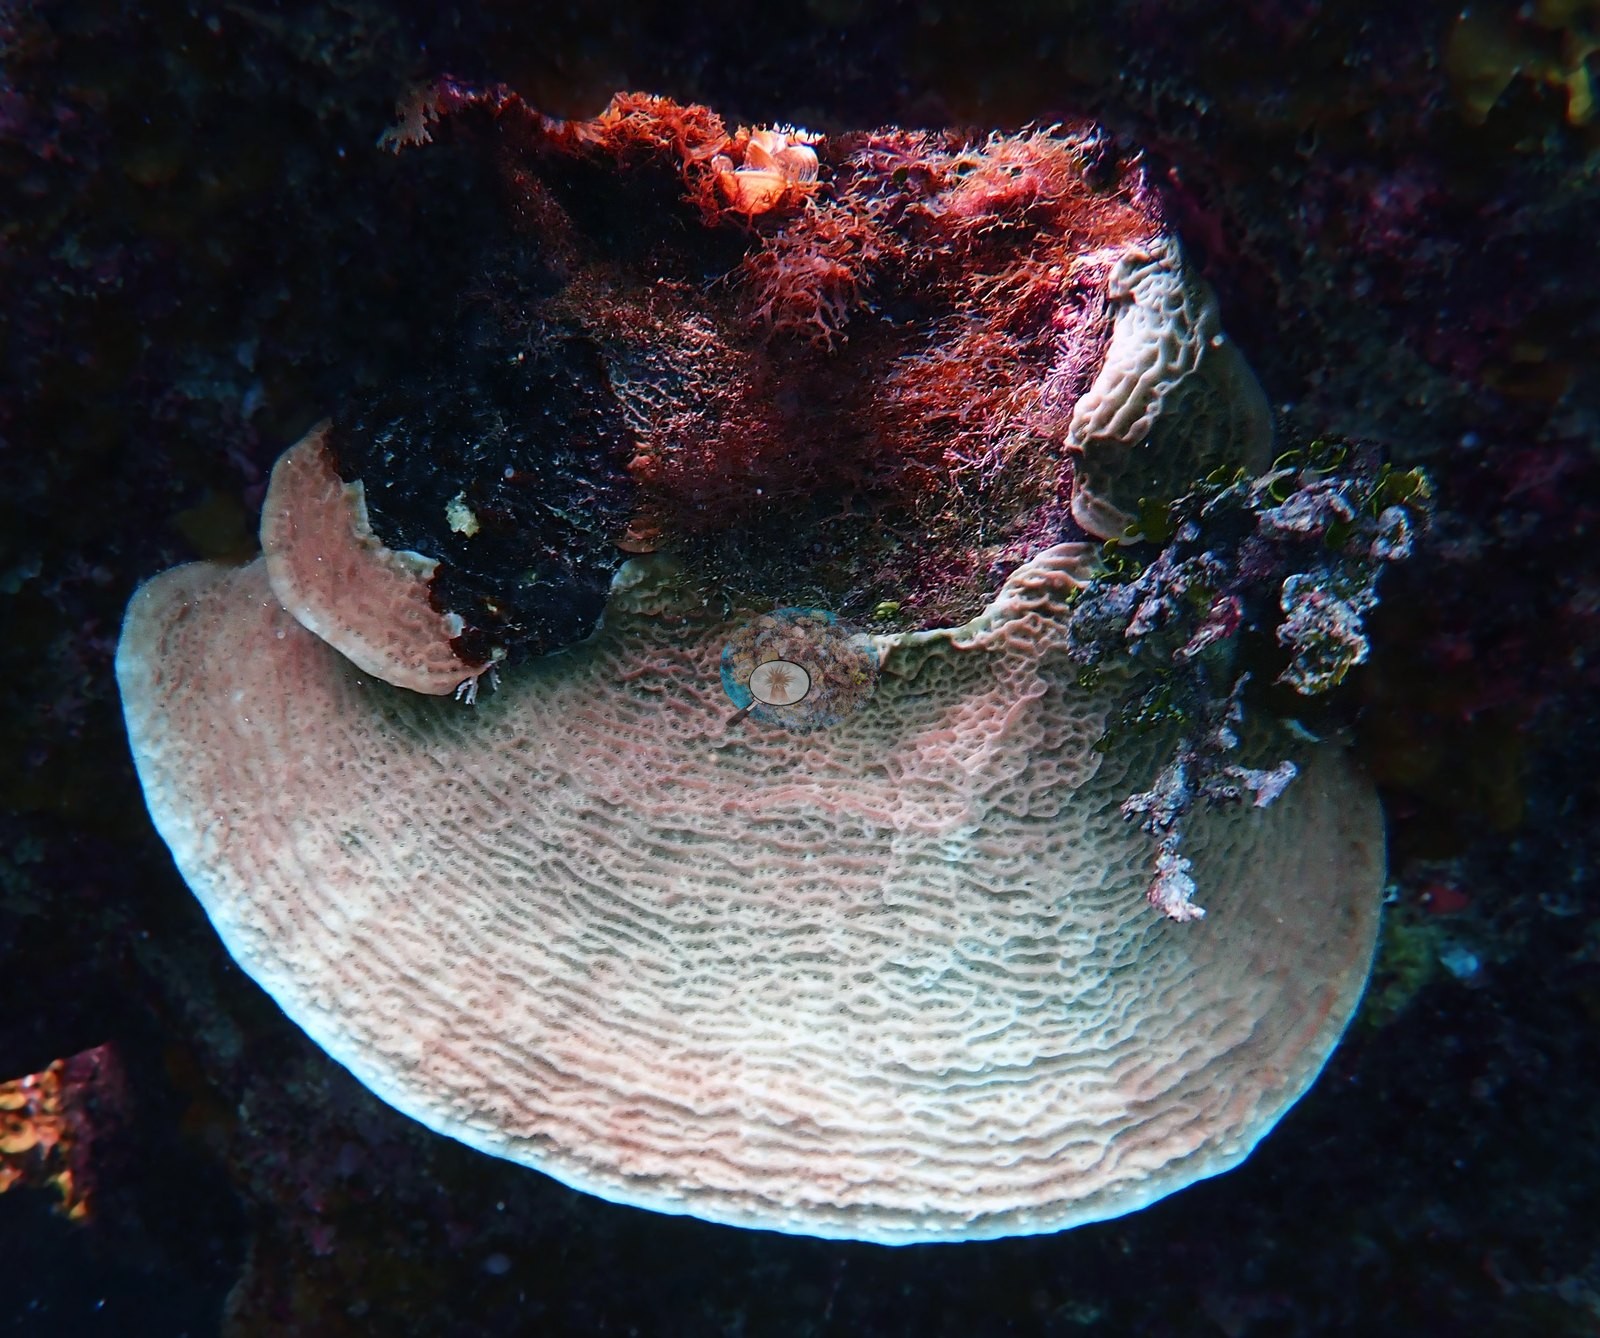
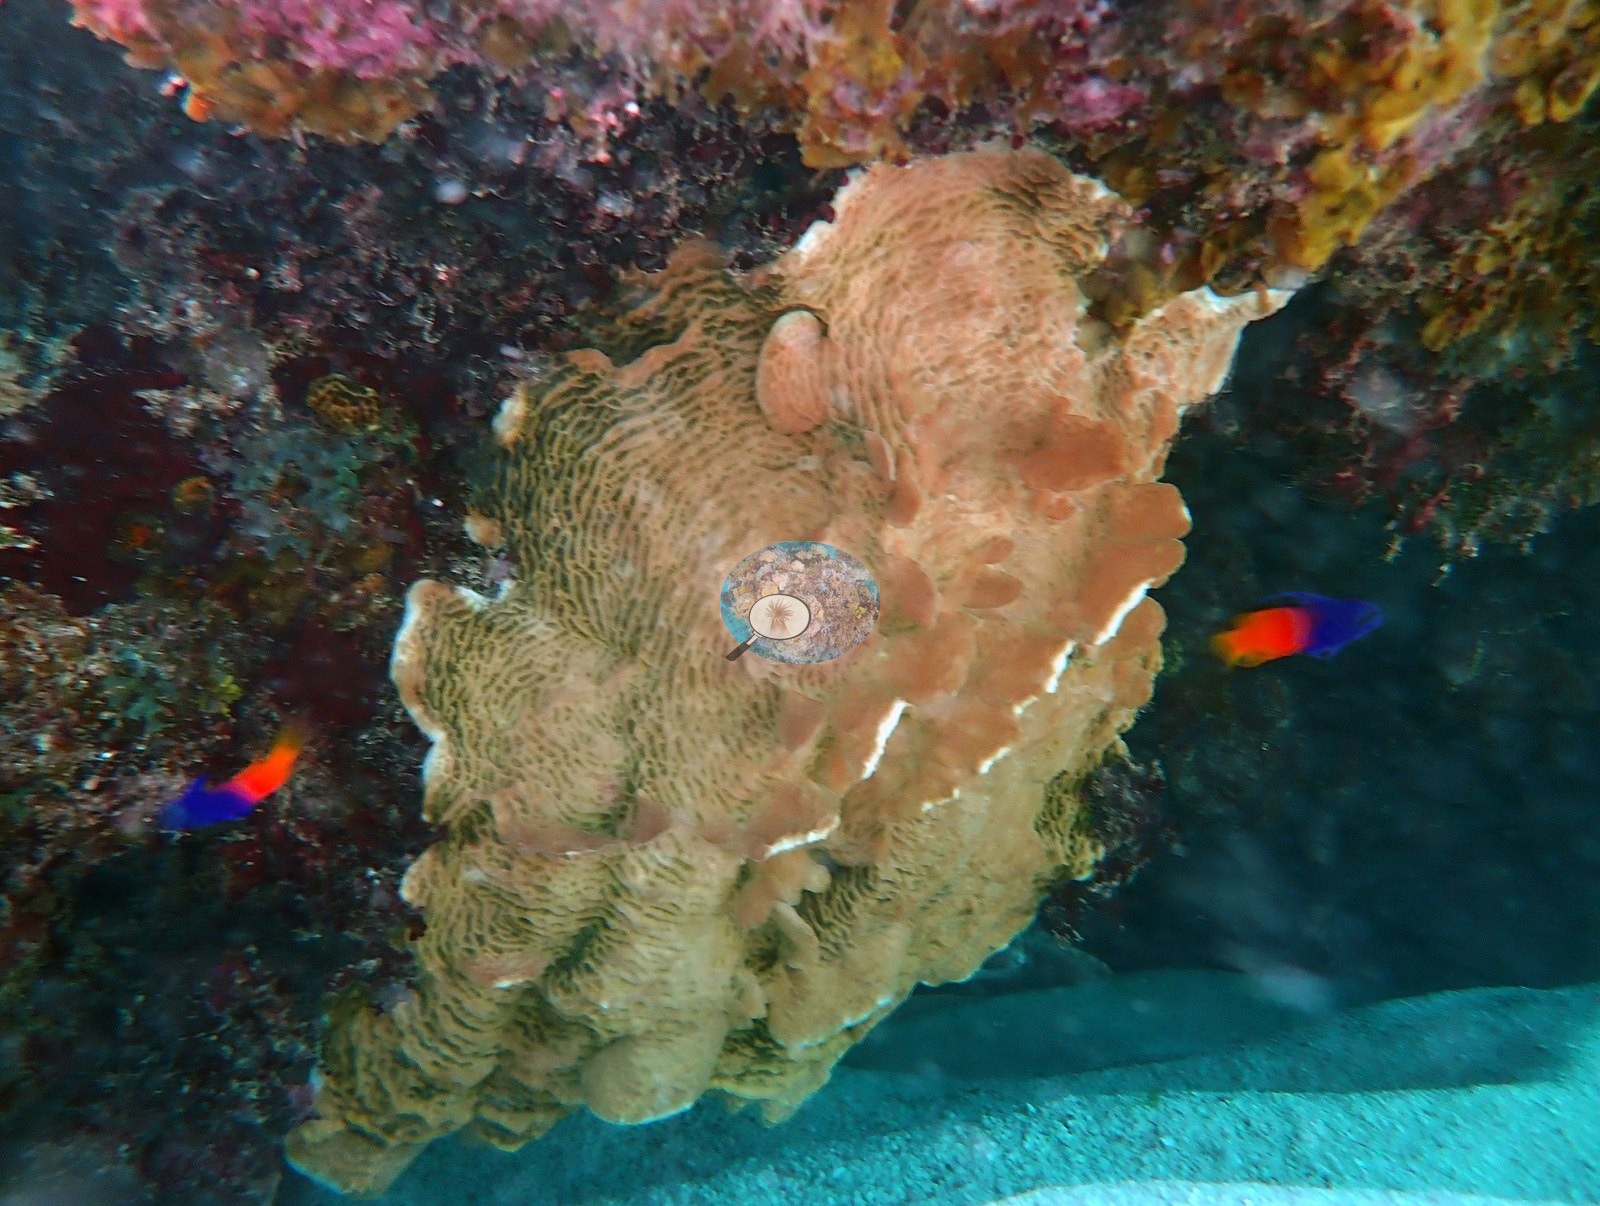
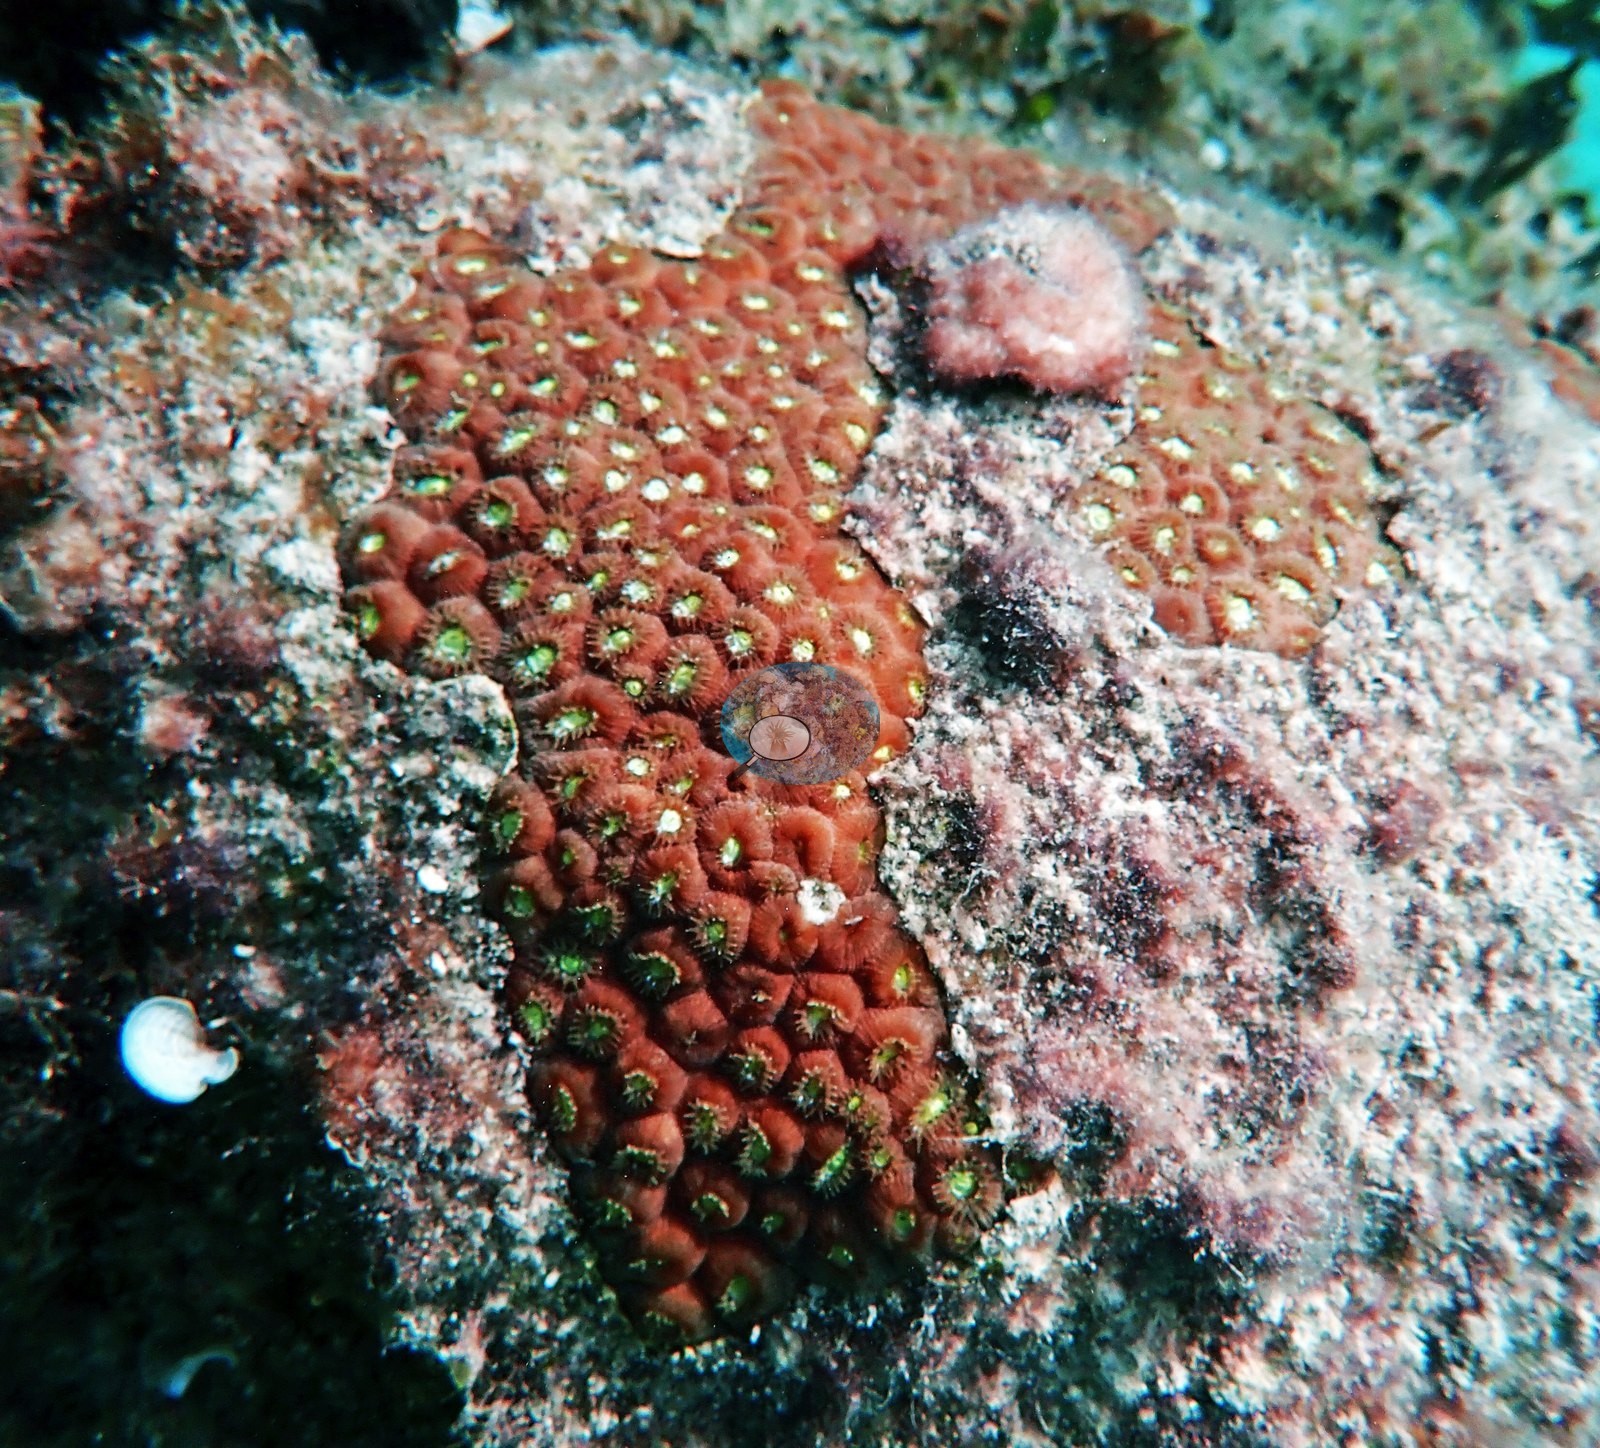
Plating and encrusting agariciid-type sheets stack under ledges and on shaded faces (e.g., Image 11, Image 12, Image 13, Image 31, Image 32), Image 6 is a close-up of an orange-brown large-calice colony on crusted rock, and small mounding and encrusting recruits are dotted across the pavement (e.g., Image 15, Image 16, Image 27, Image 41).
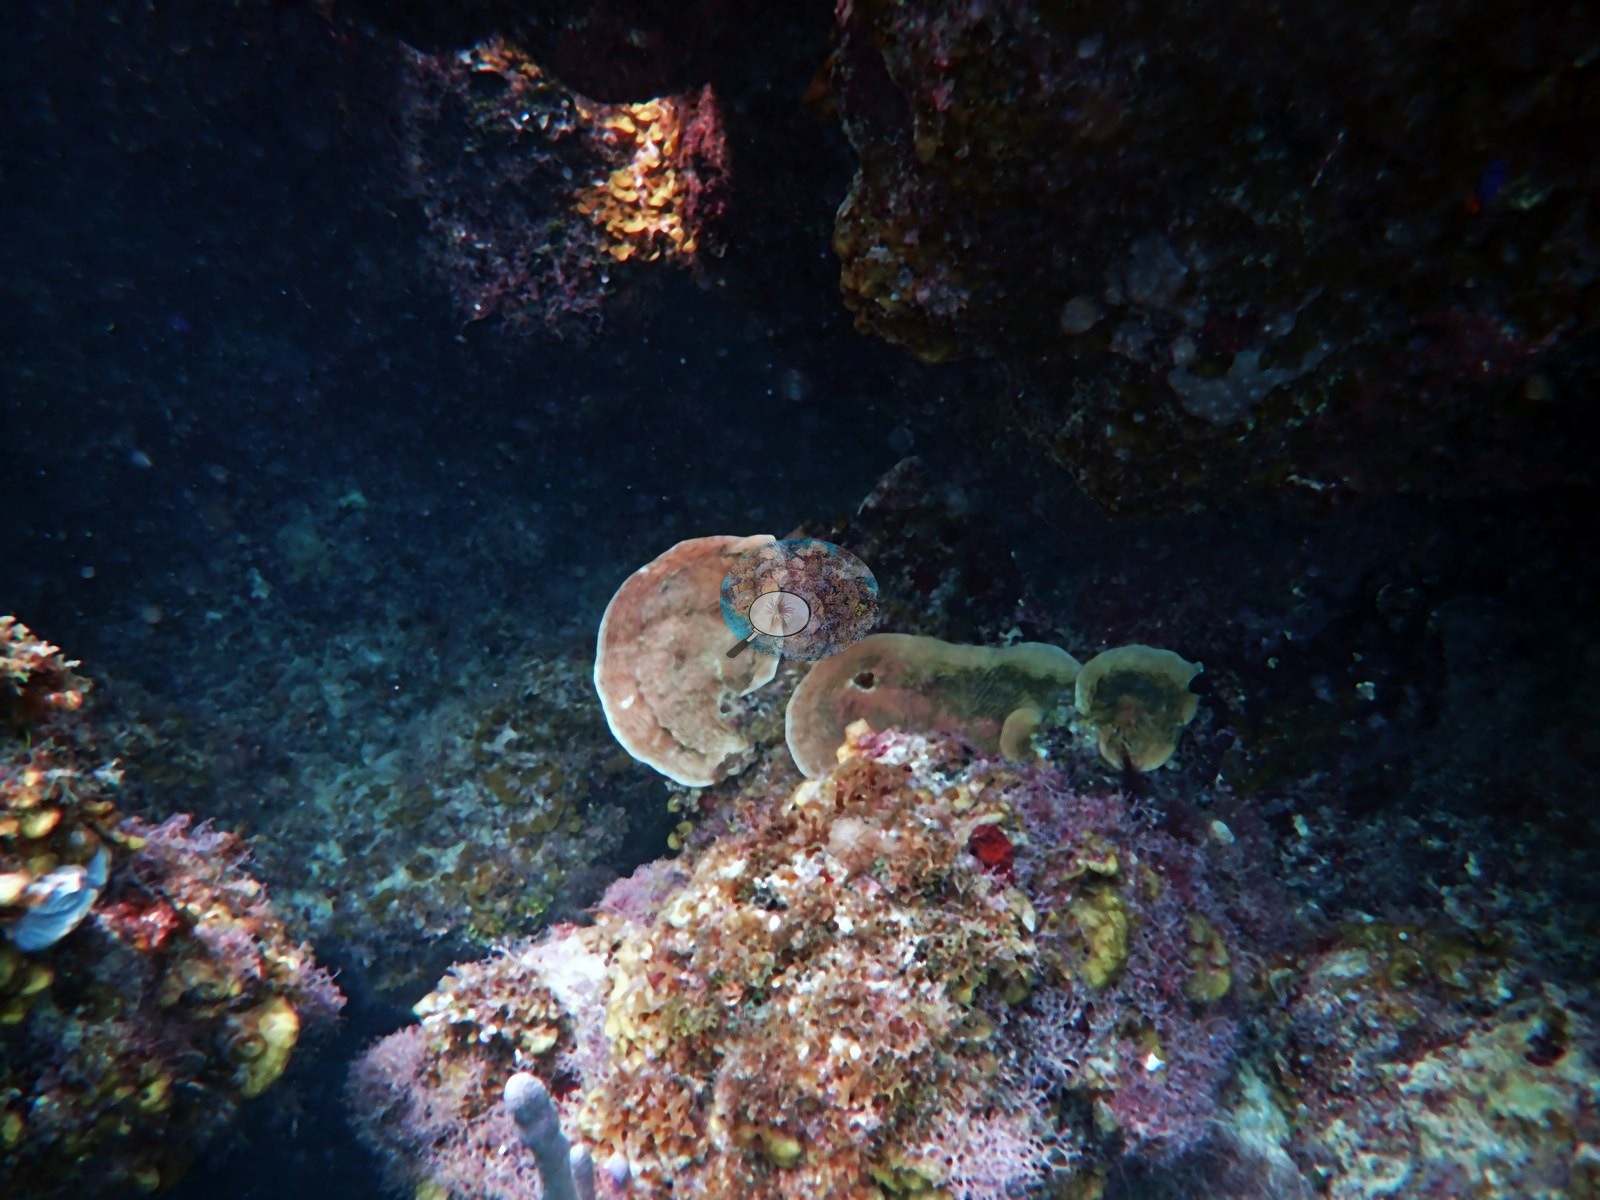
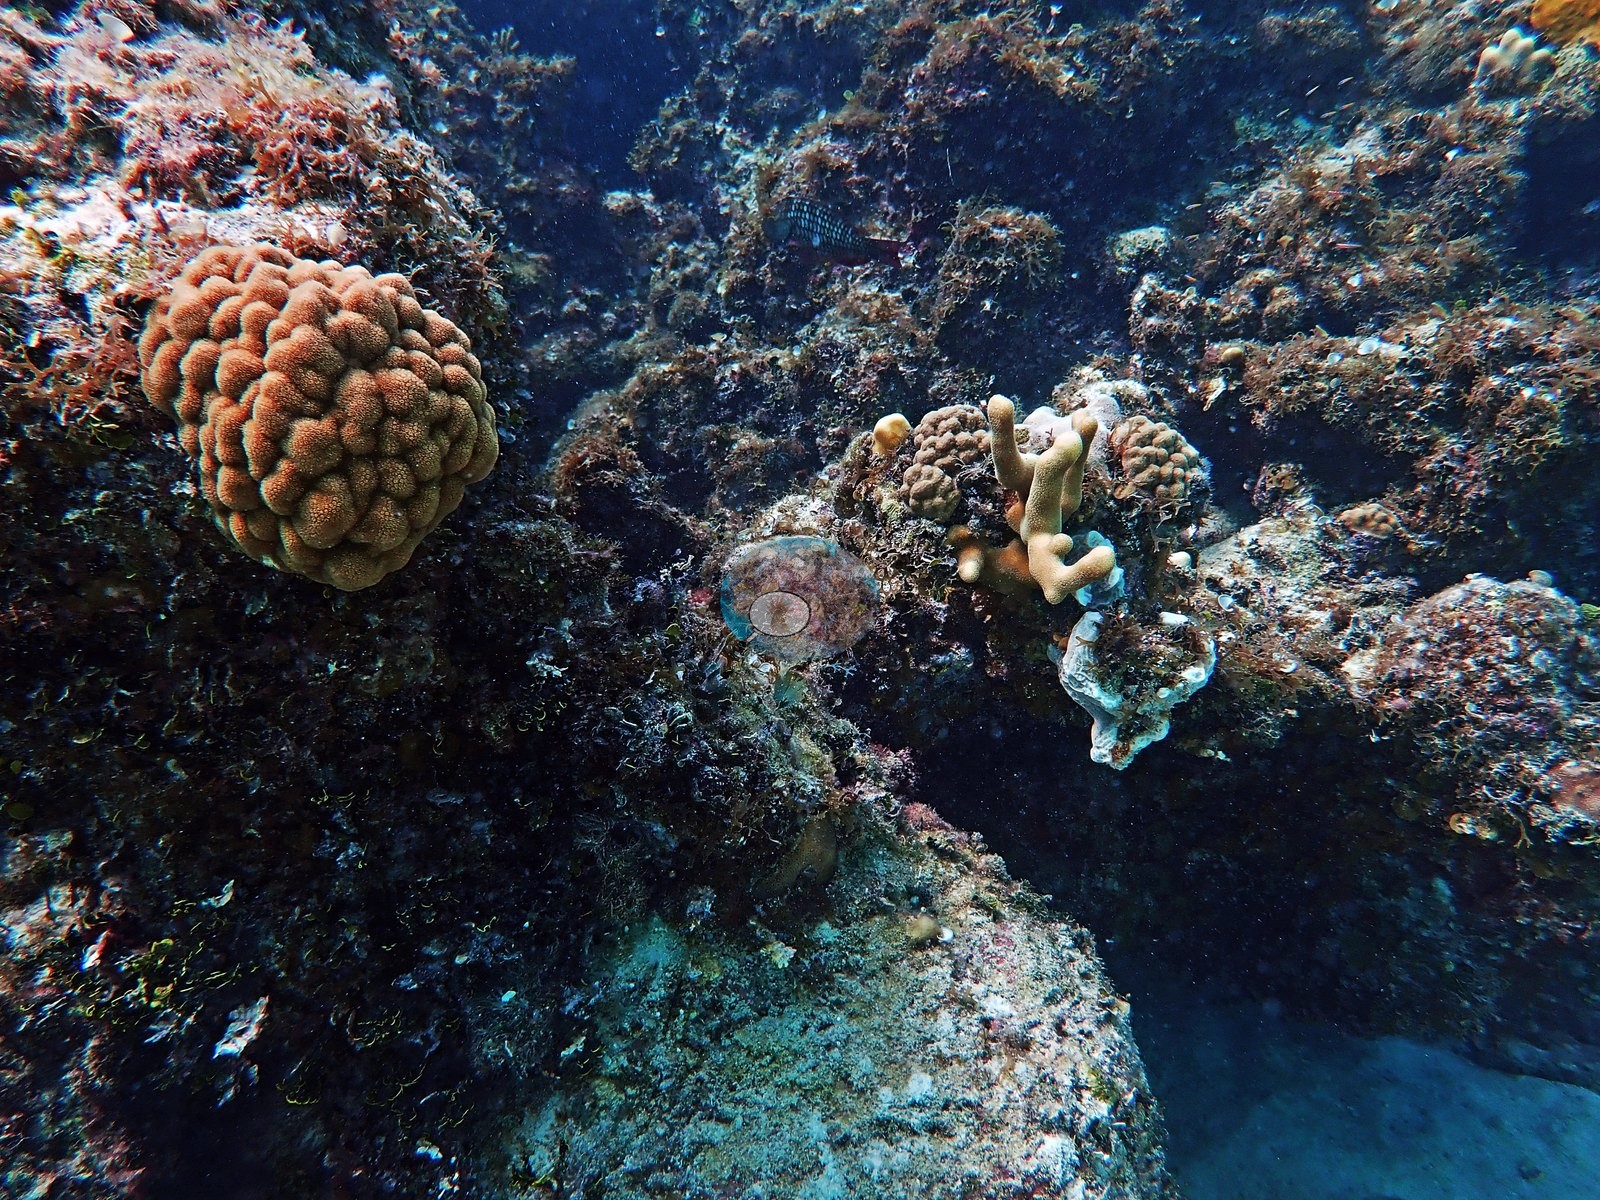
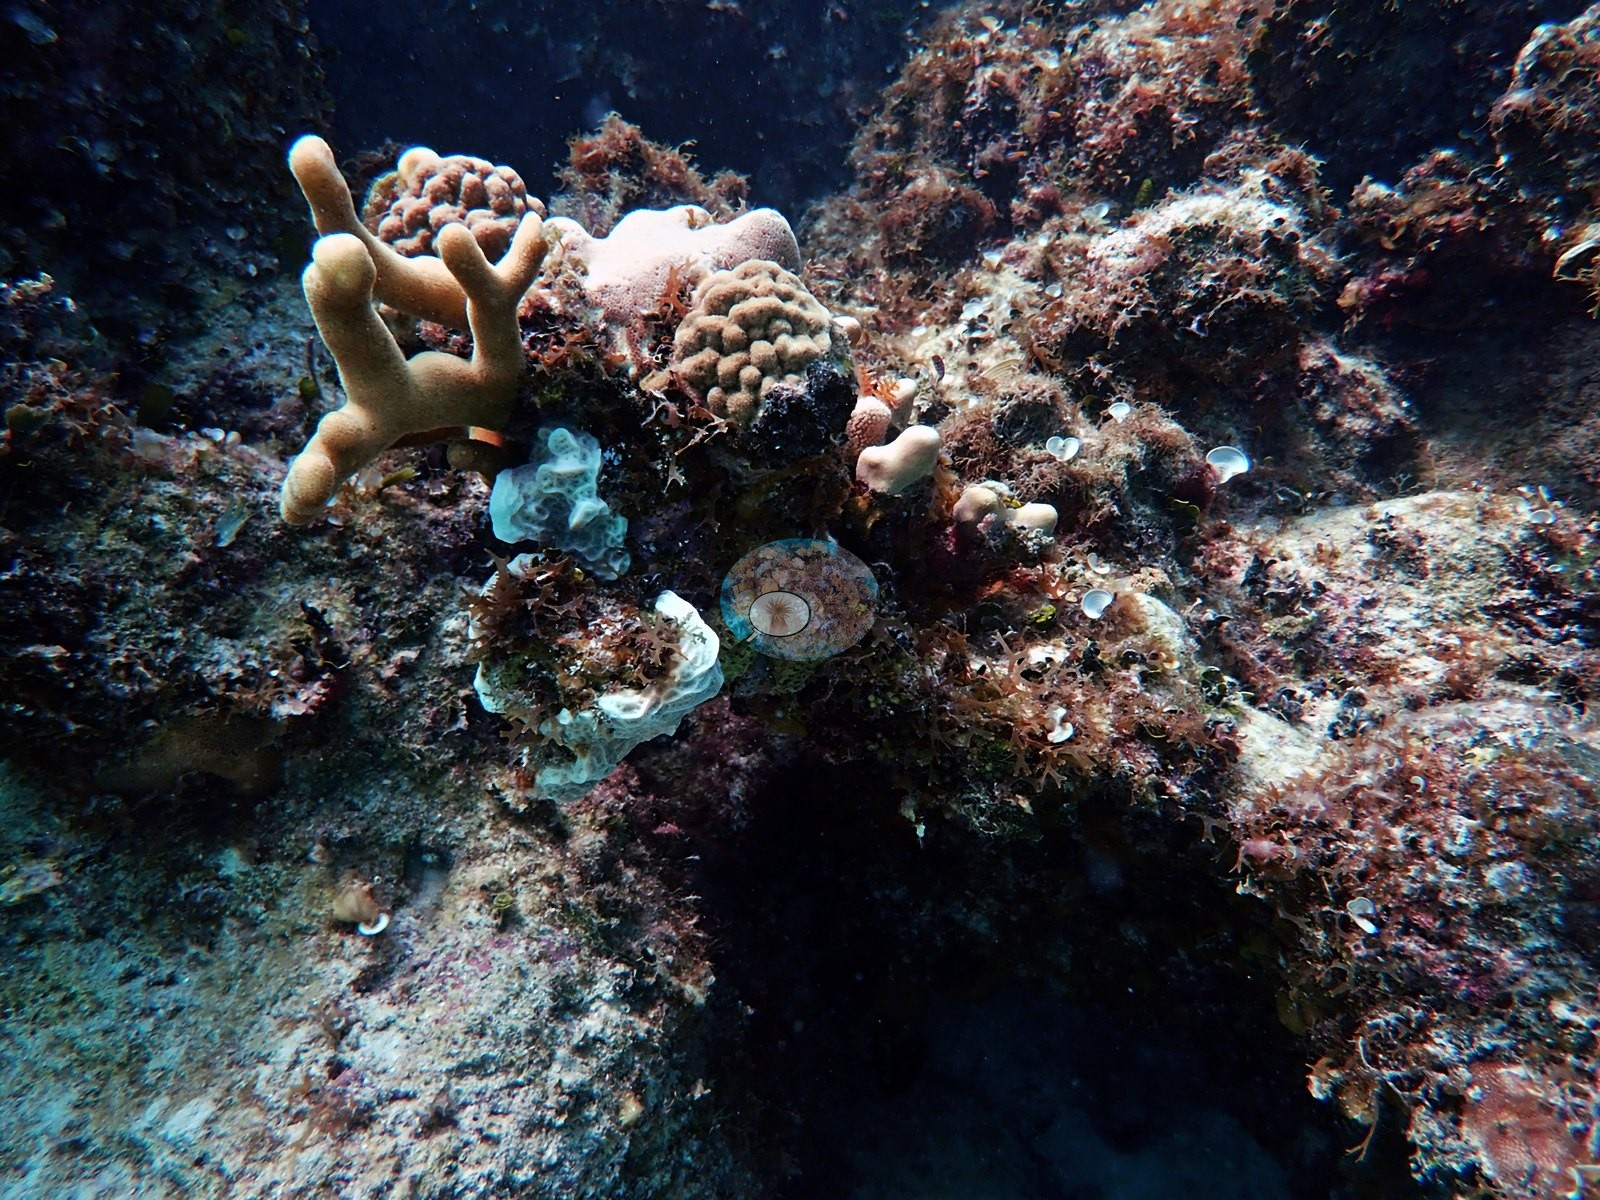
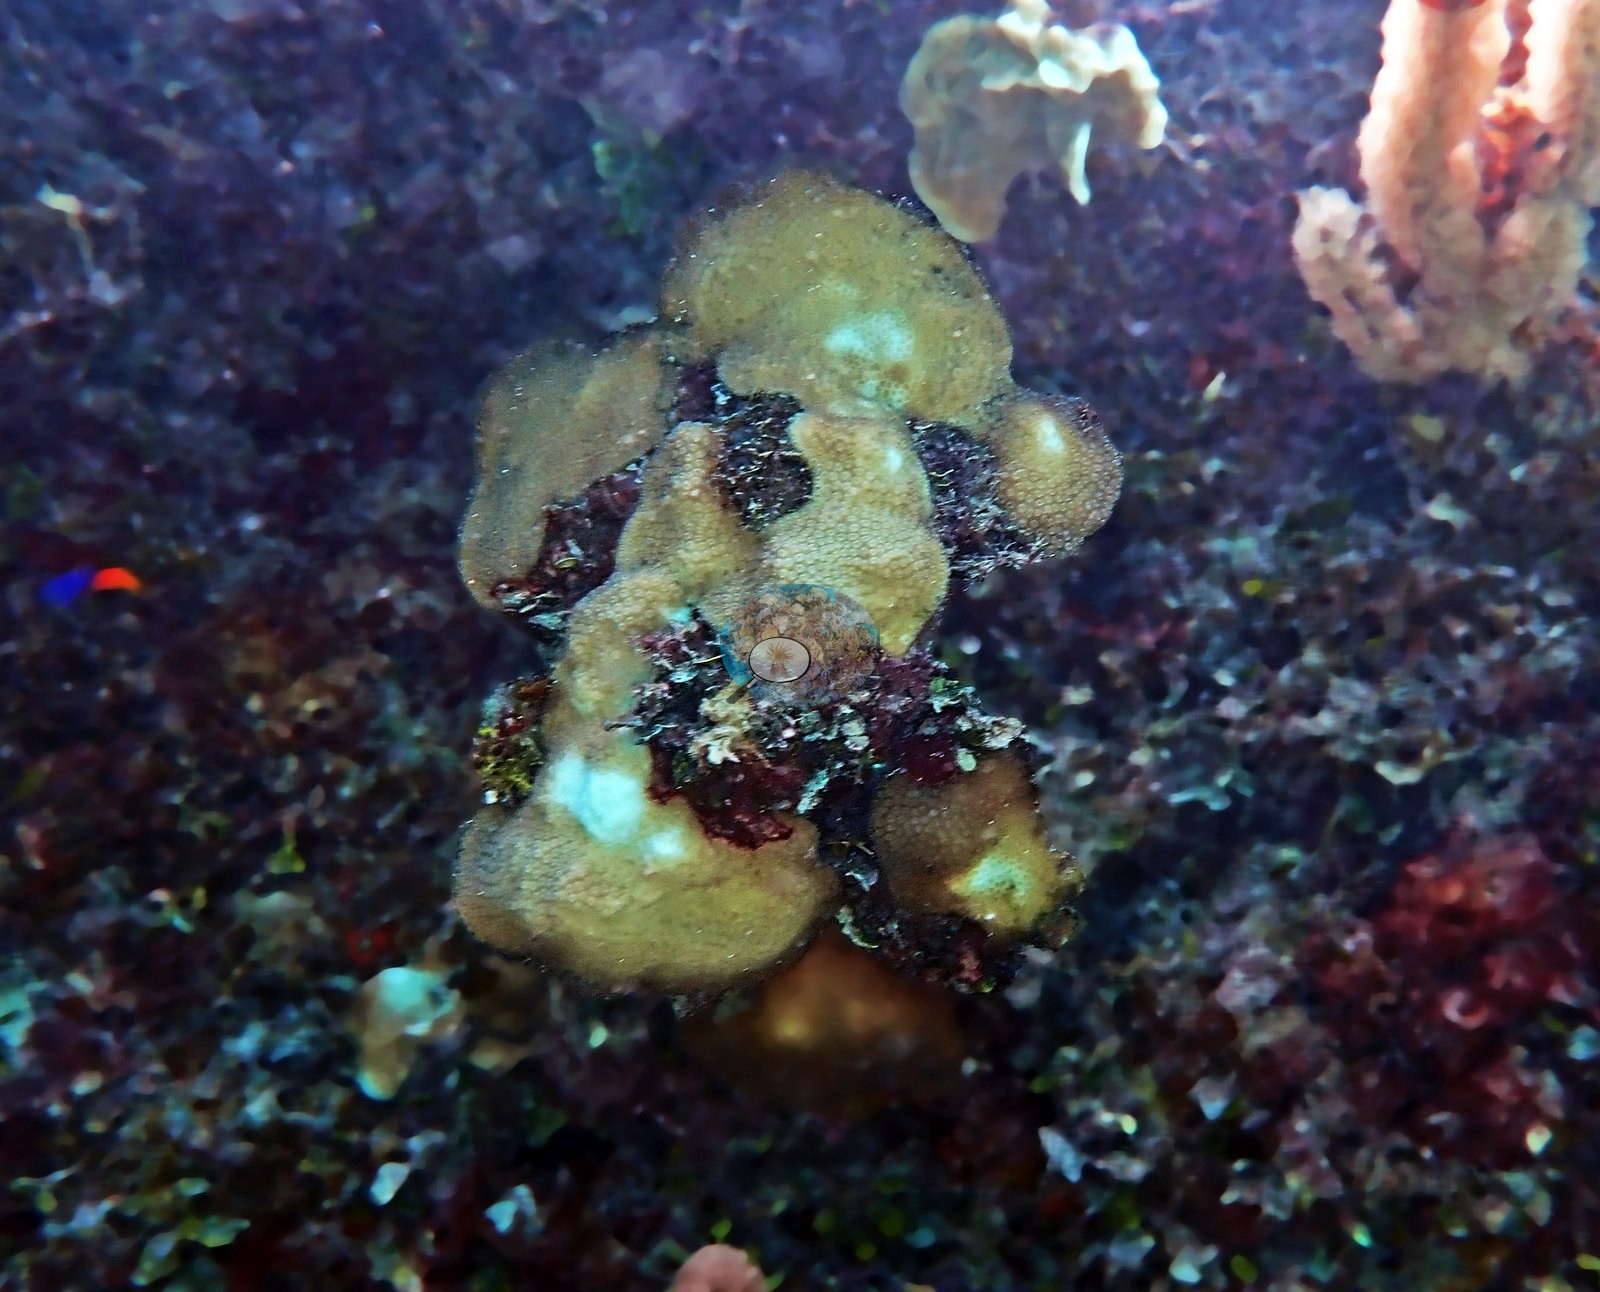
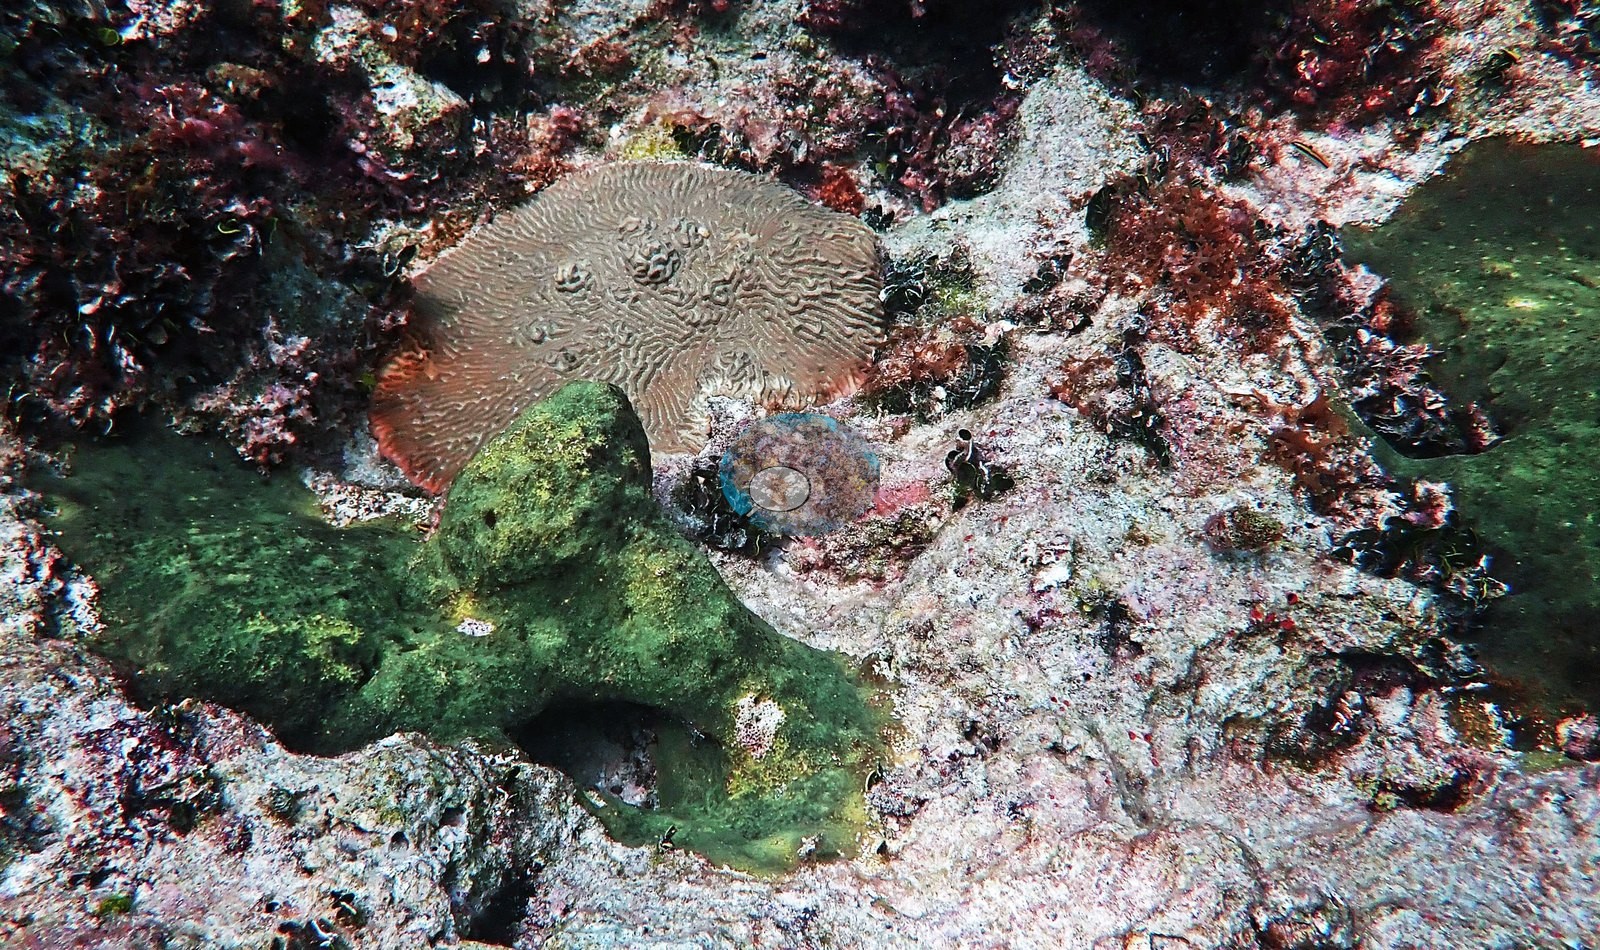
Gorgonians — sea fans, sea rods, and sea plumes — stand along the higher spurs (e.g., Image 58, Image 61, Image 68, Image 72).
Coral cover
- Reference: Claude CV point count (this site's photos)
- Coral cover: 9.1% — a blind Claude computer-vision point count of 60 of Anderson's edited photographs (20 points per photo; water, fish, and obstructions excluded). Other computer-vision methods are listed in the method table.
Stressors
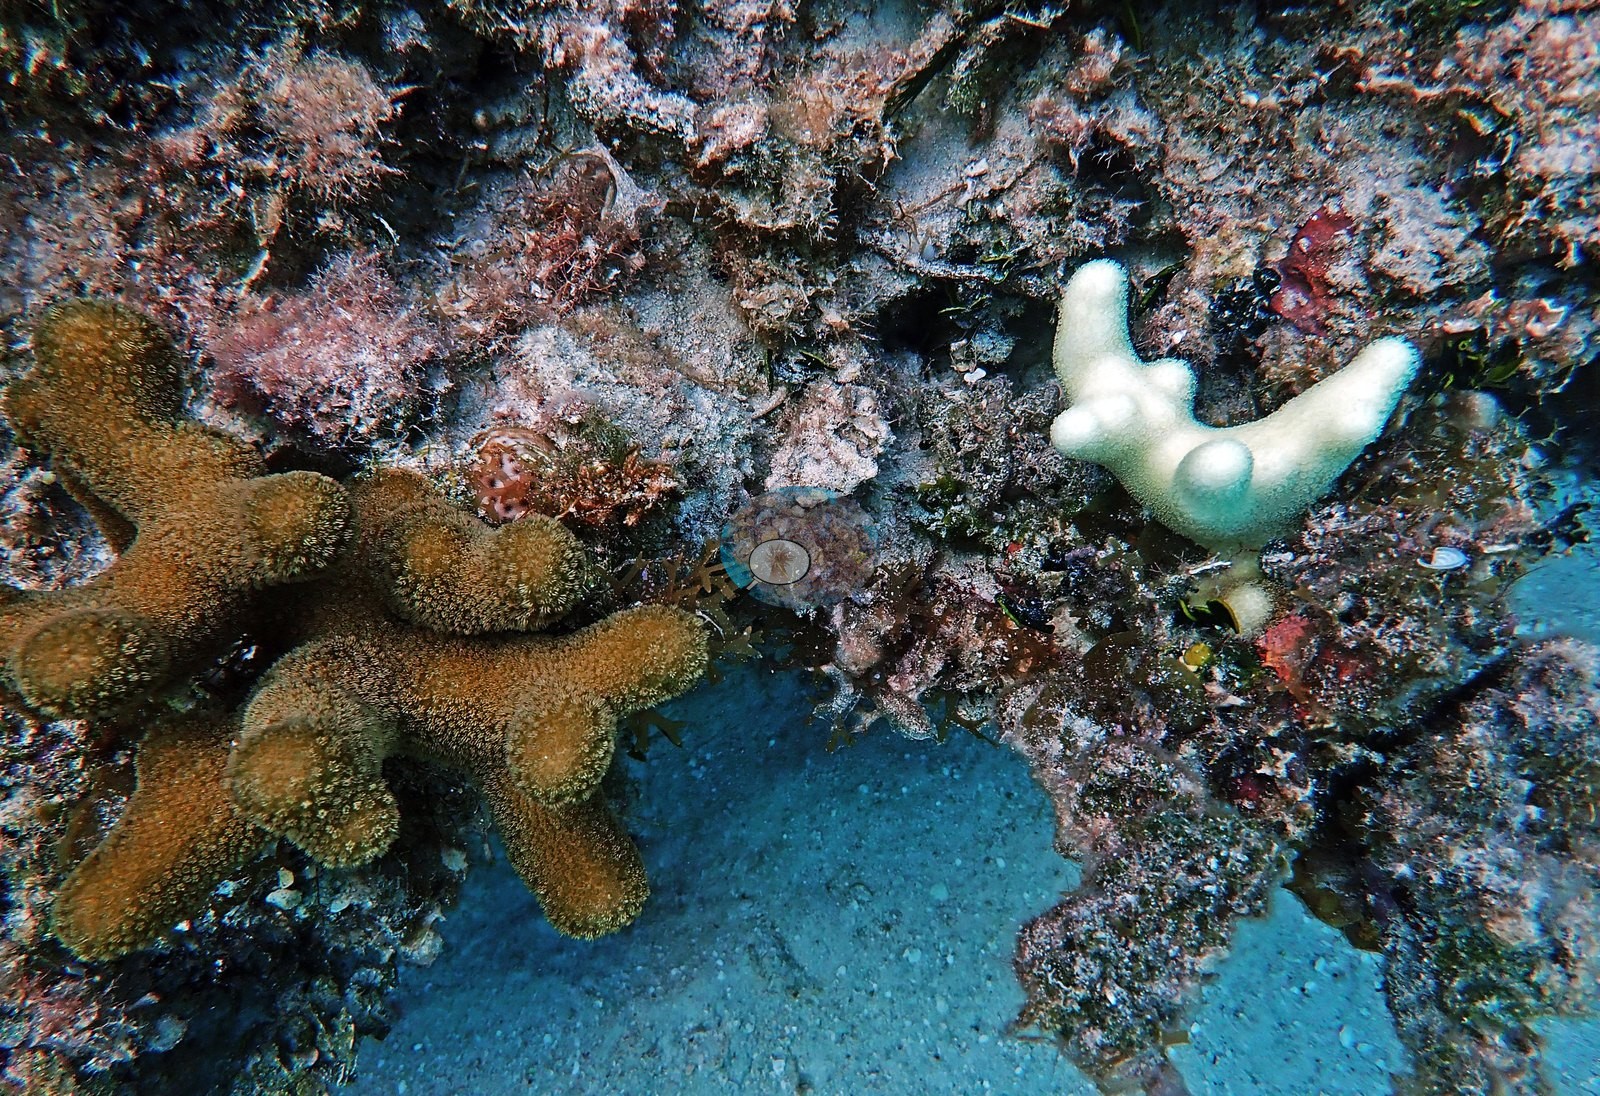
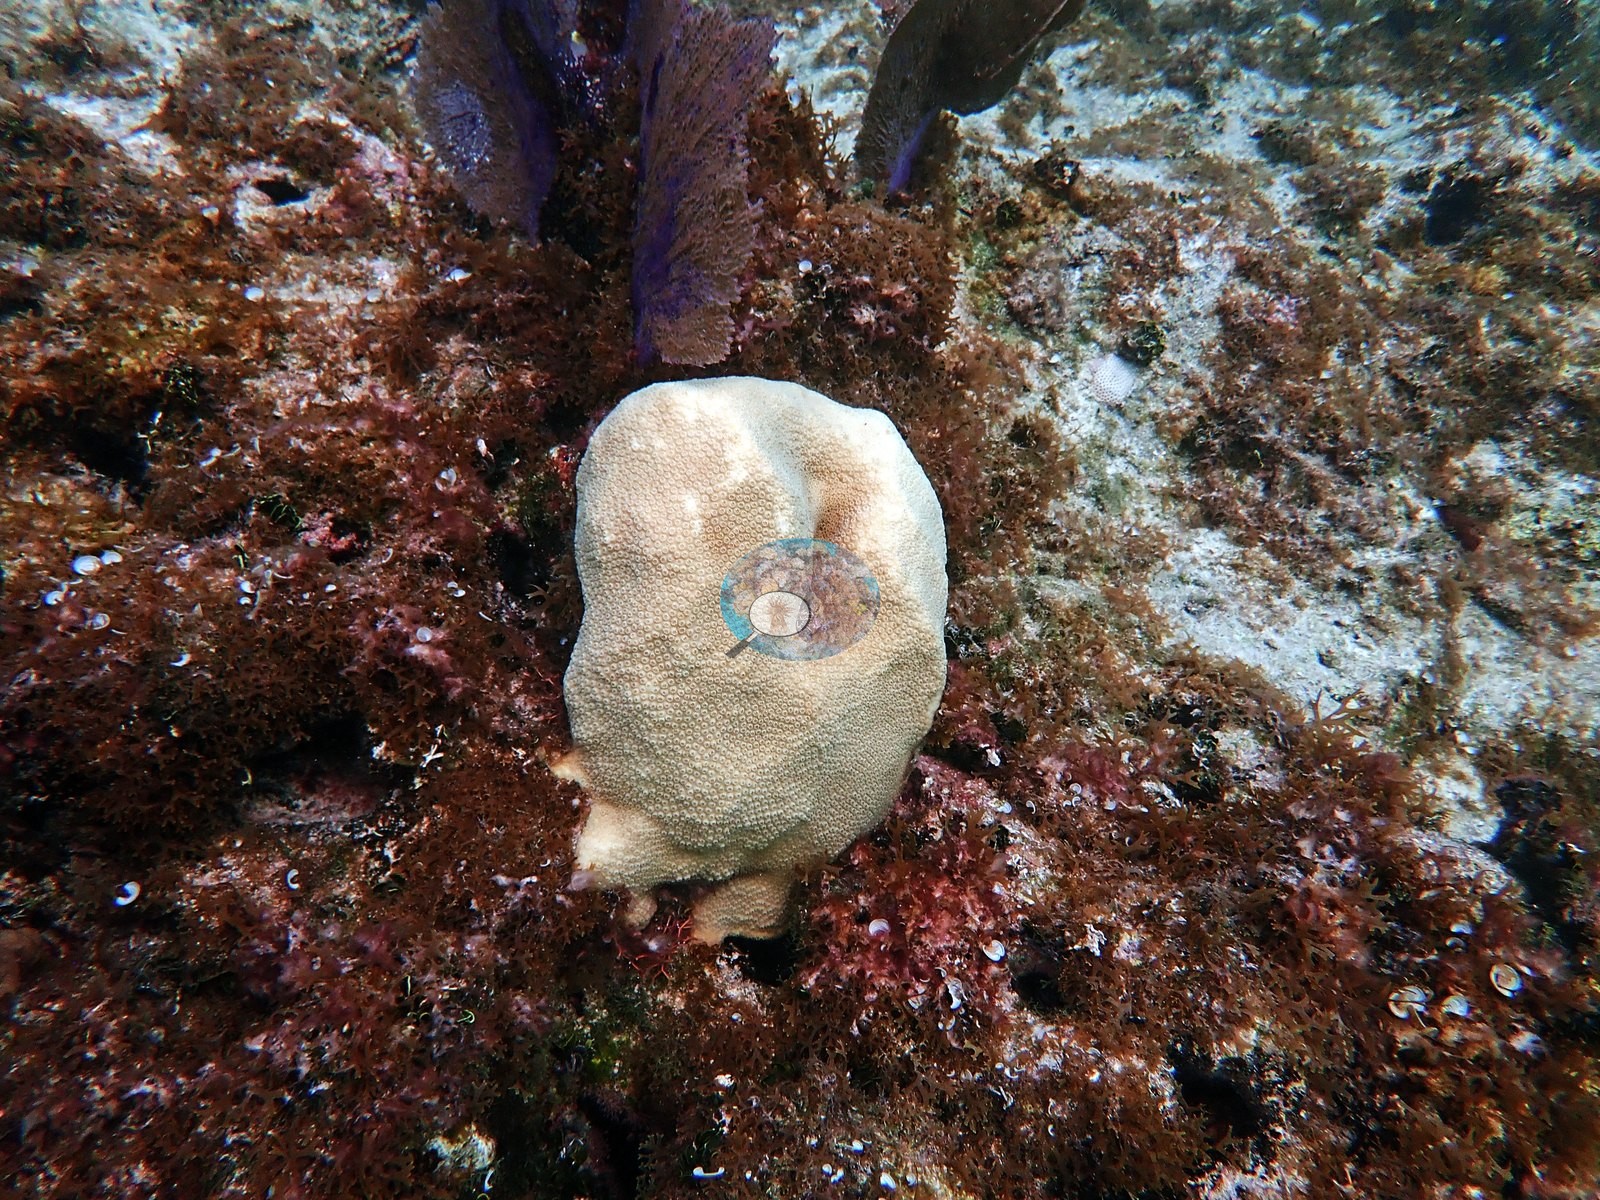
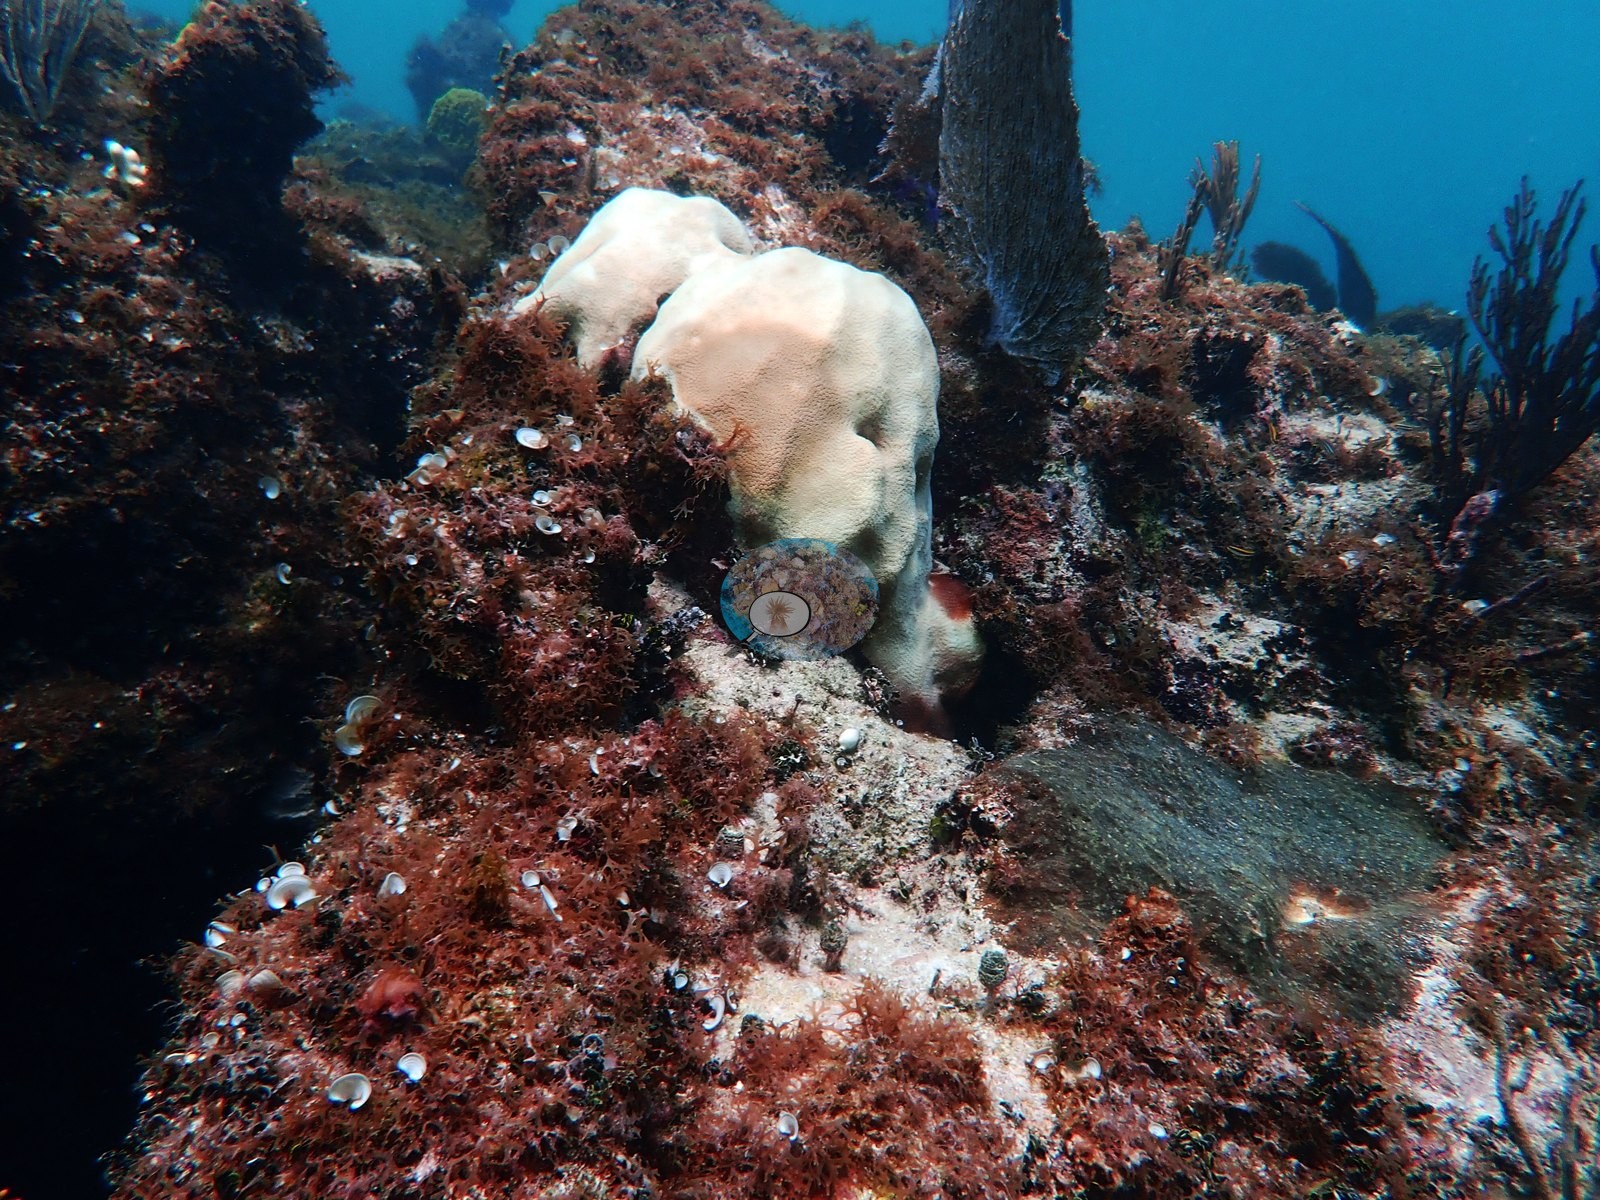
Health signals are reported qualitatively only. Some colonies are bleached: the Orbicella faveolata Anderson identified in Image 45 and a similar lobed colony in Image 10 are pale cream with their polyps intact, against otherwise pigmented surroundings, and a small finger-branching colony is stark white with live tissue beside a brown colony of the same form (e.g., Image 19). Image 70 Anderson recorded as diseased; Image 44 is explicitly recorded as not diseased, which is a useful pairing. Image 33 and Image 39 record complete mortality on a brain coral and on elkhorn framework respectively.
No percentage of bleaching, disease, or mortality is estimated from these frames. No corallivores were evident.
Fish and other fauna
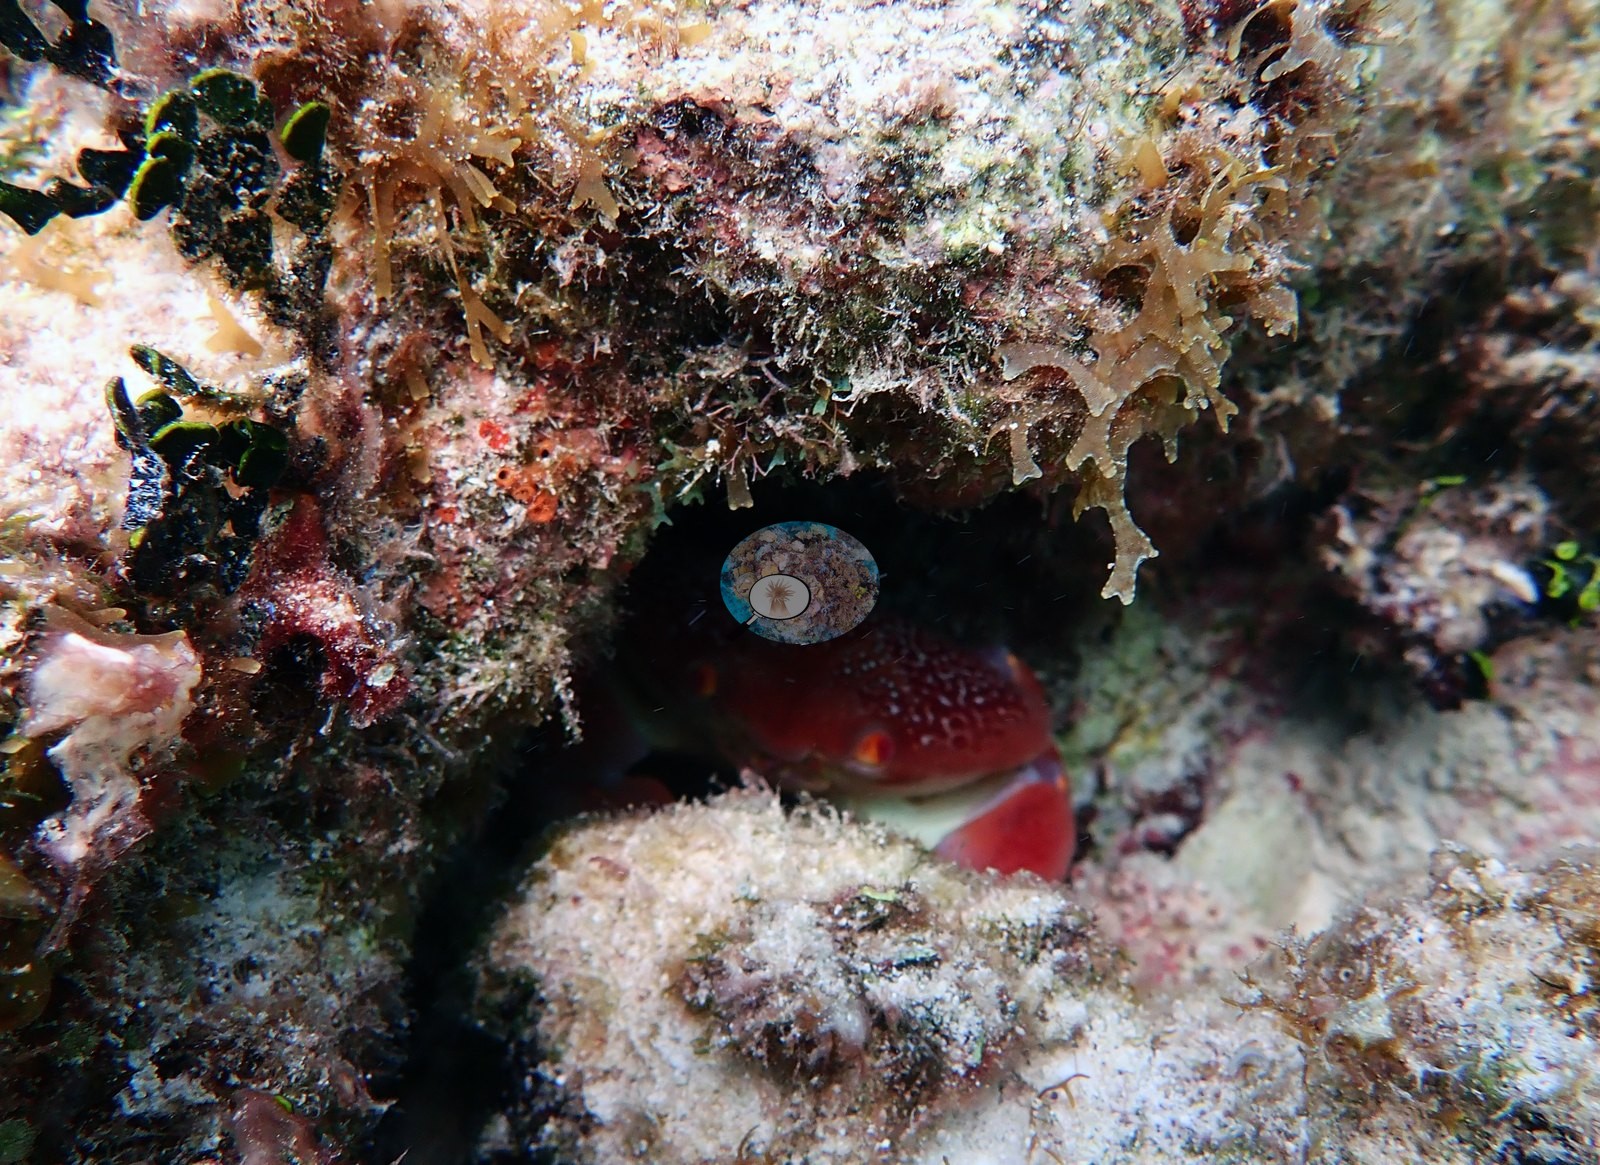
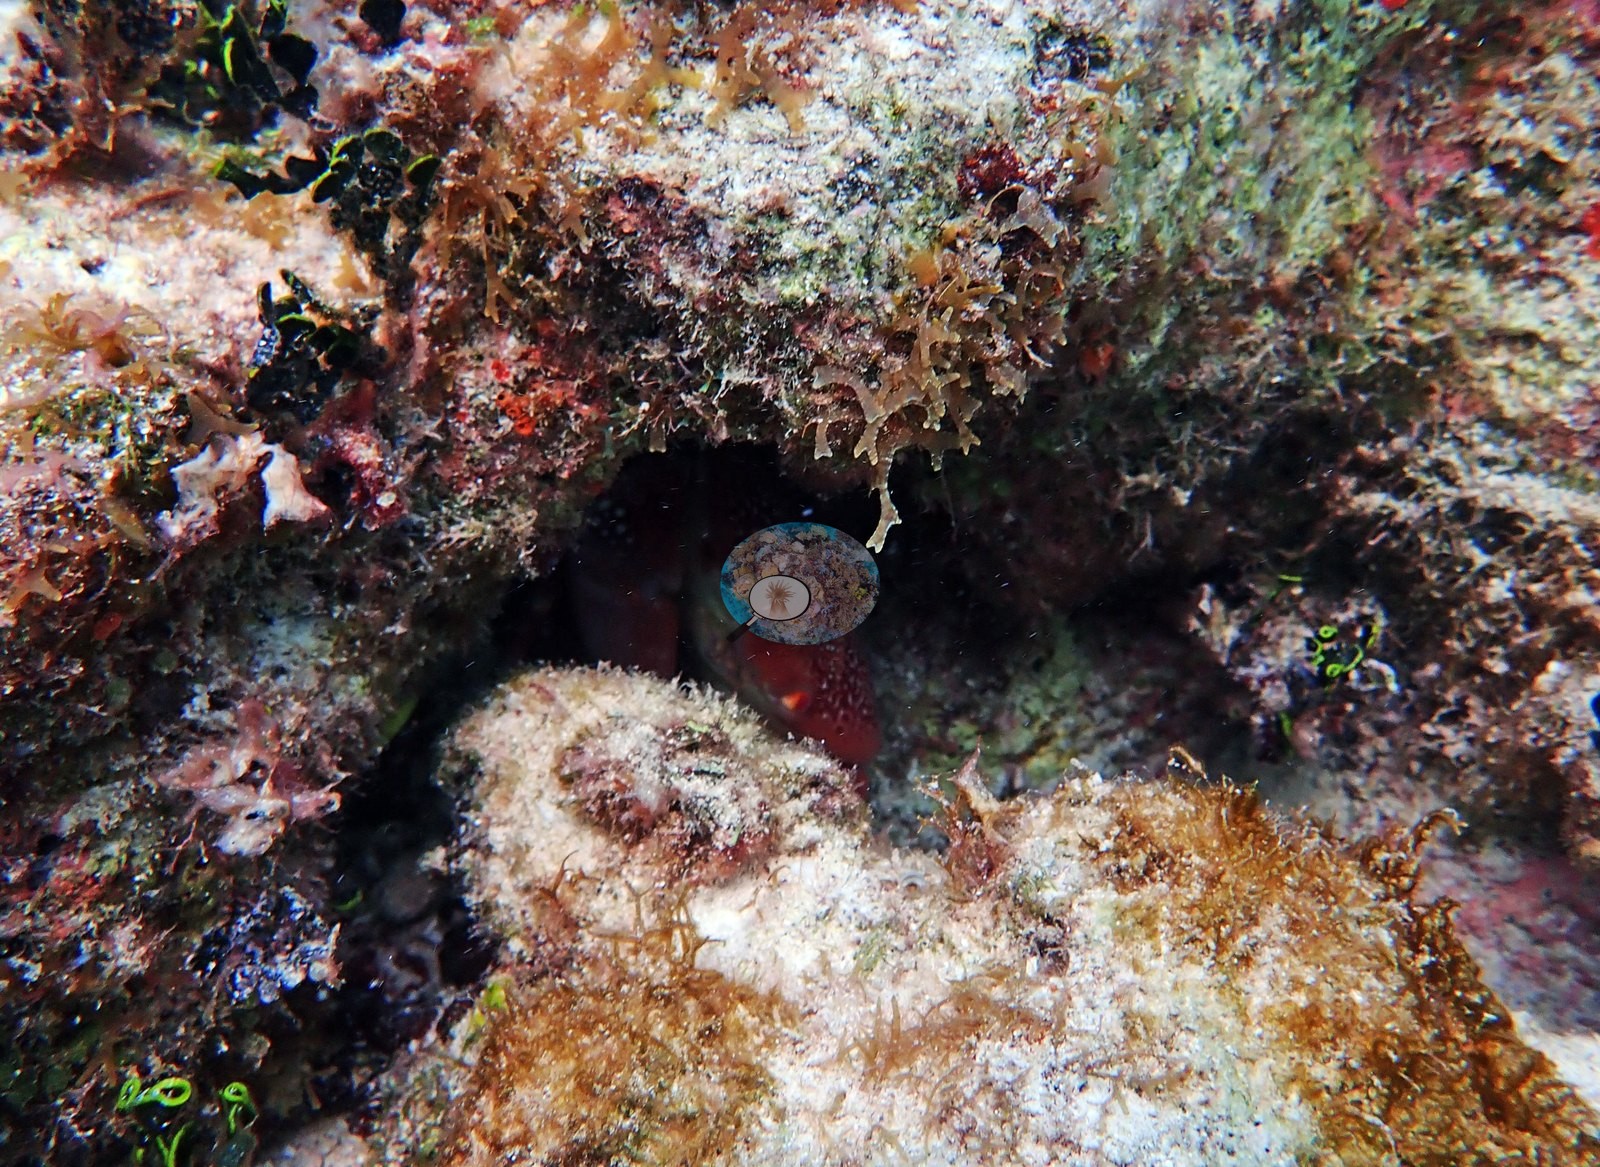
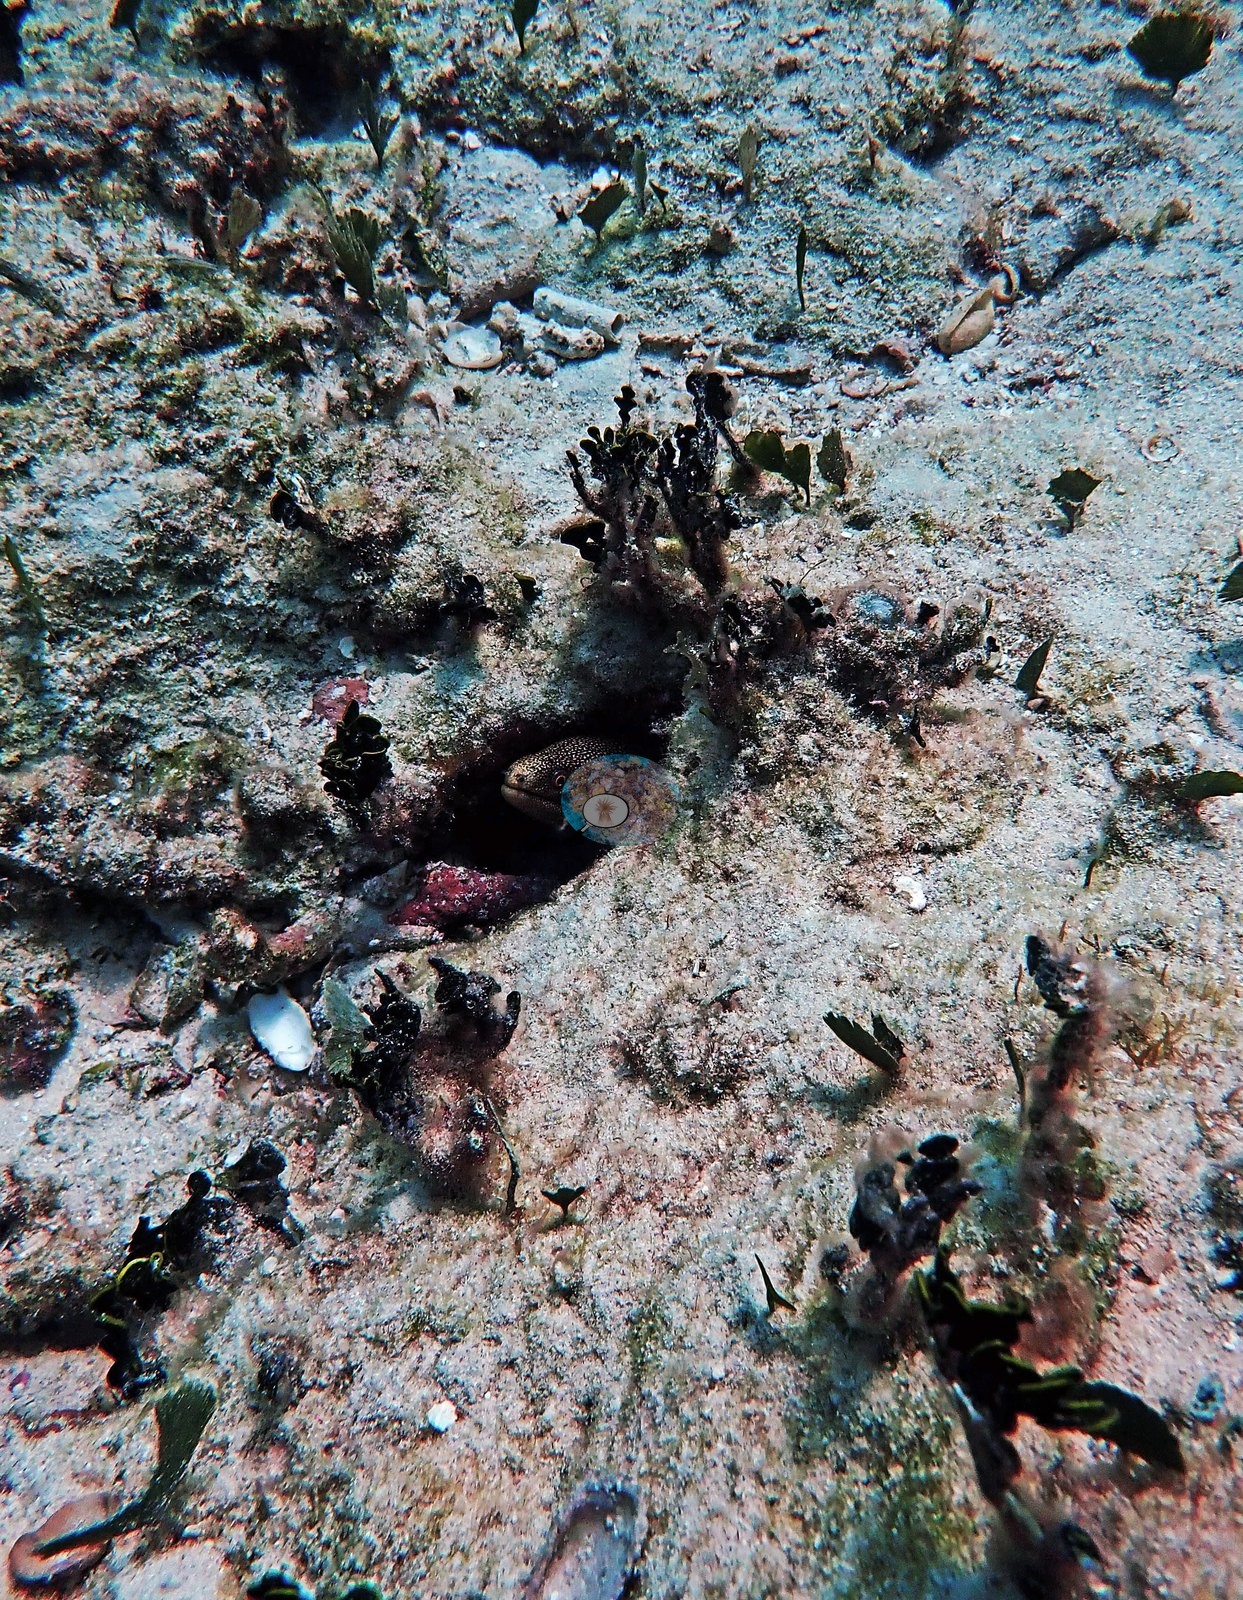
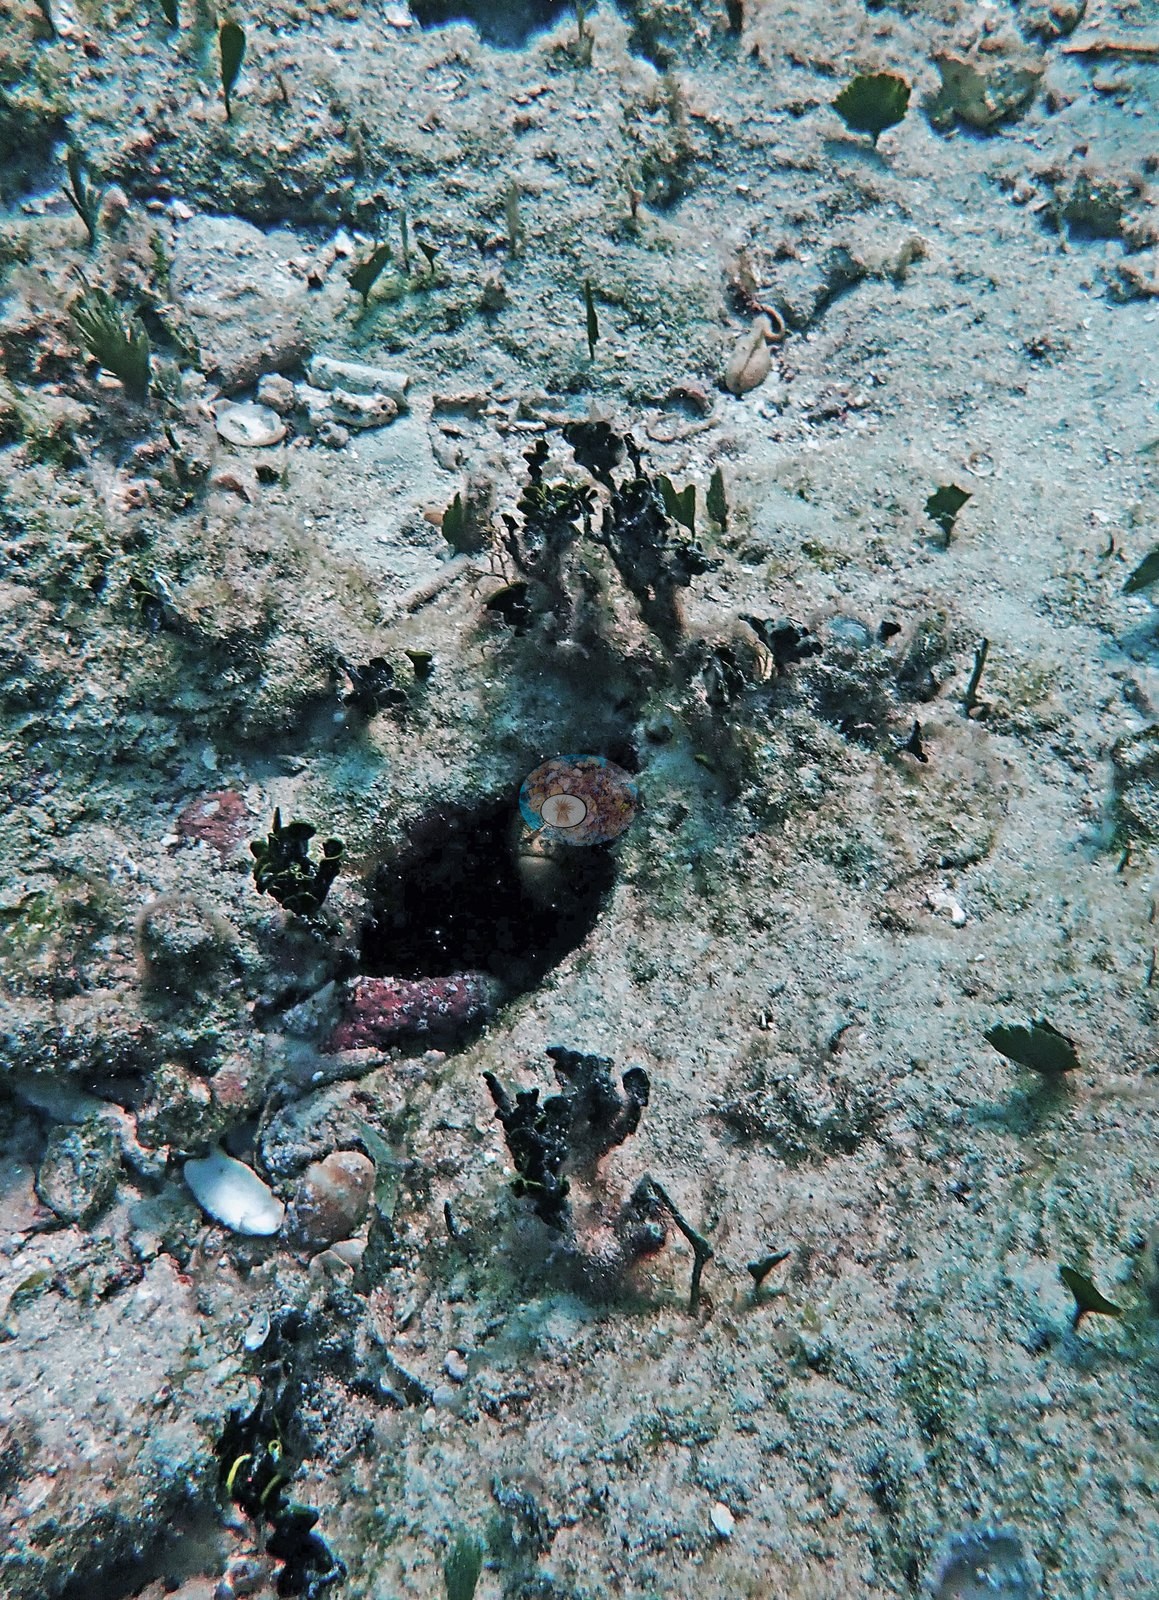
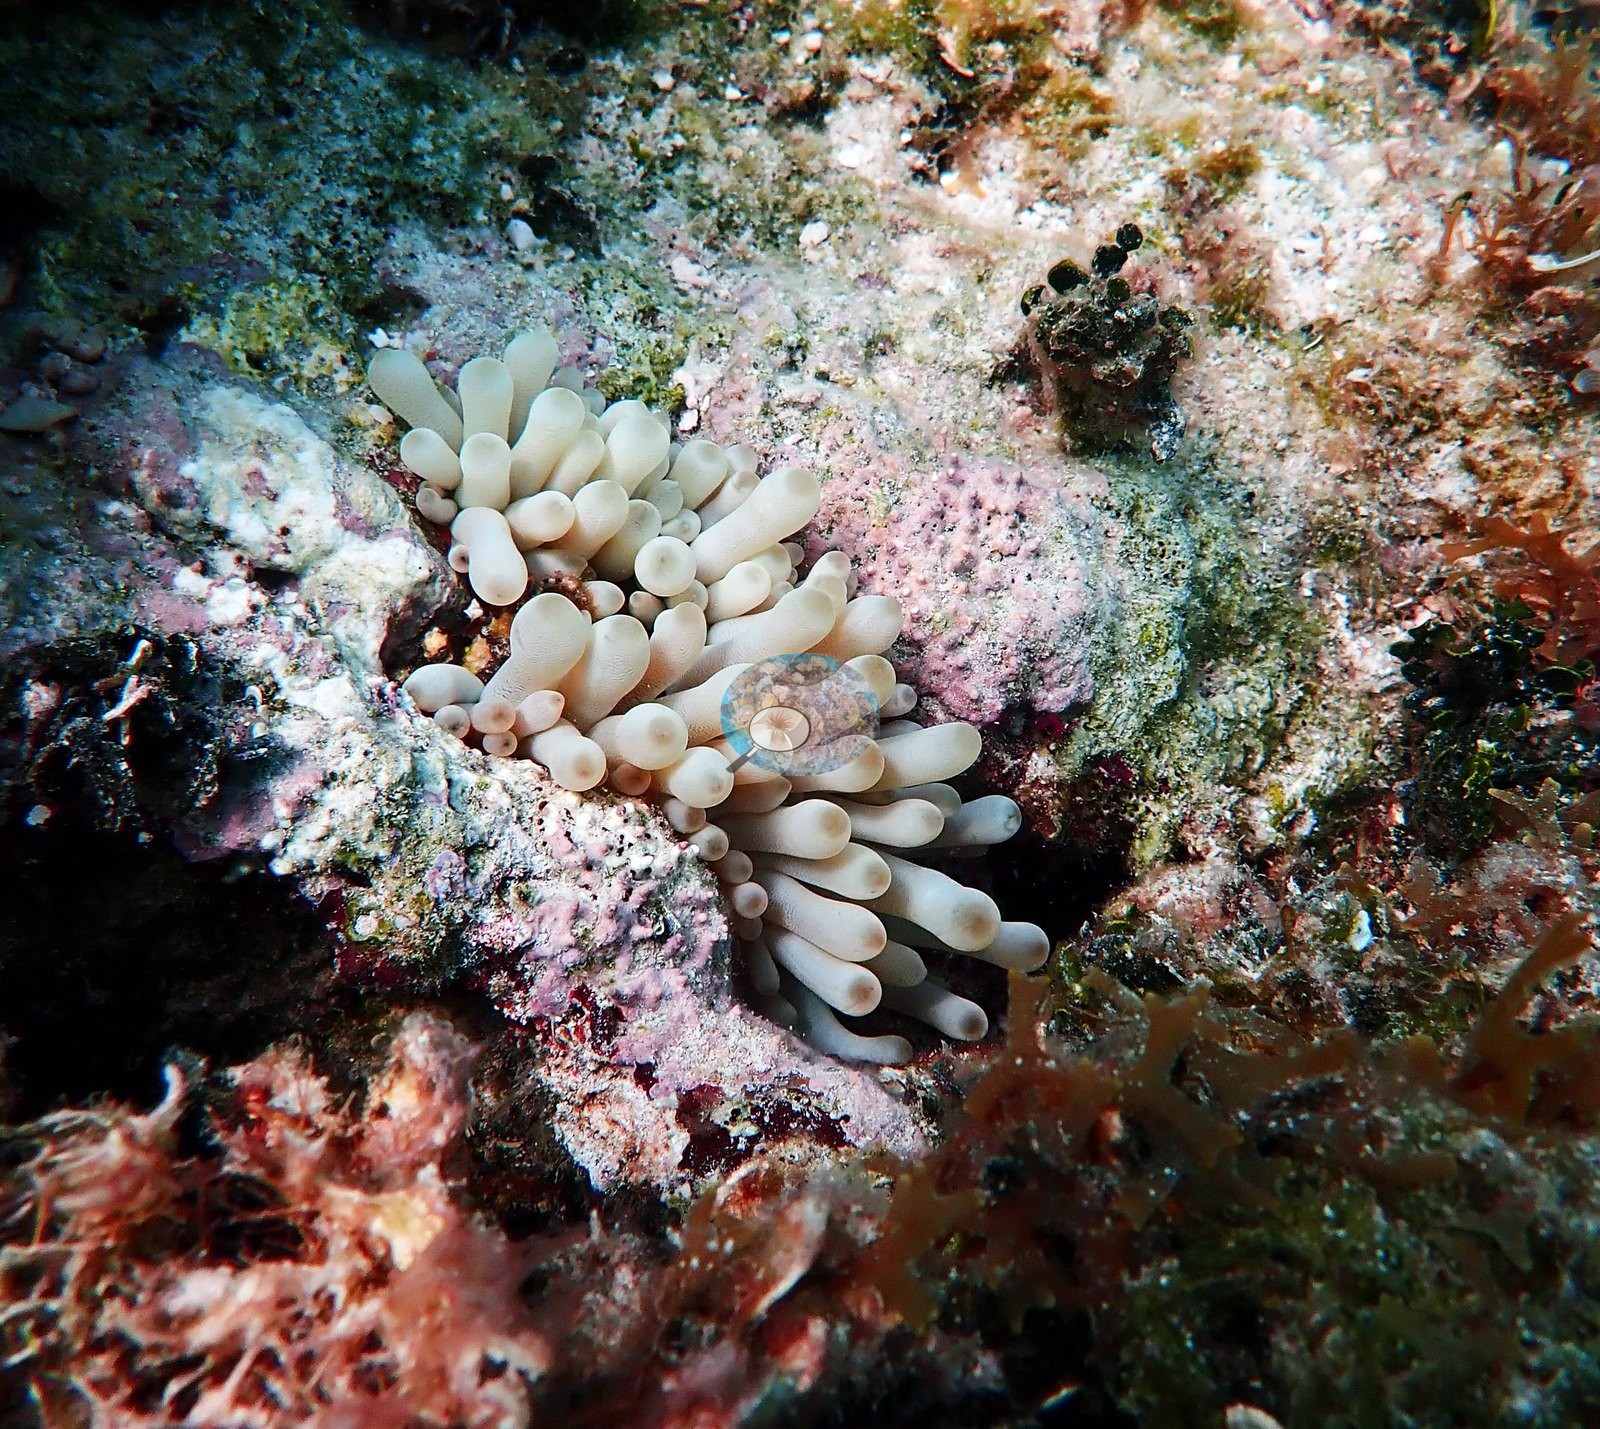
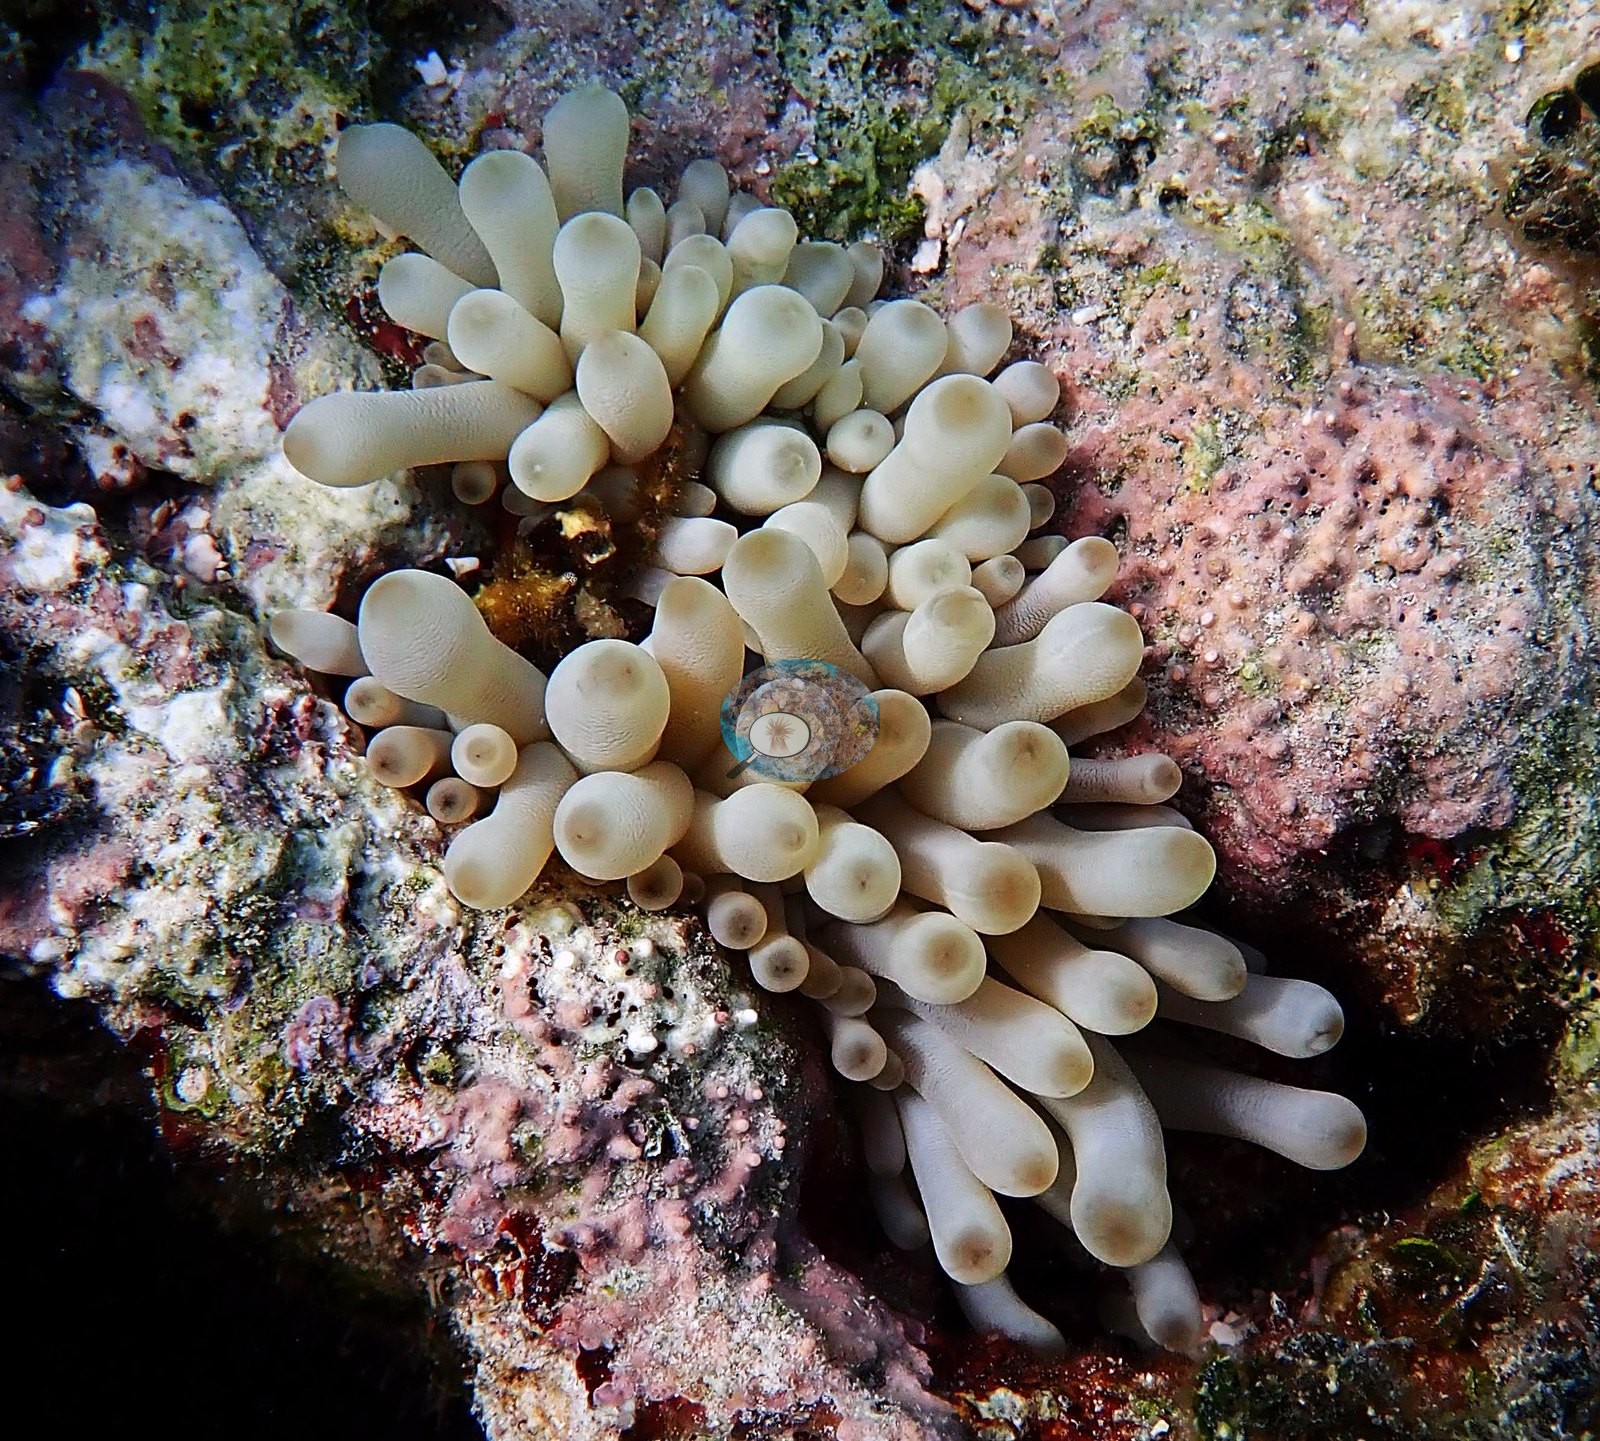
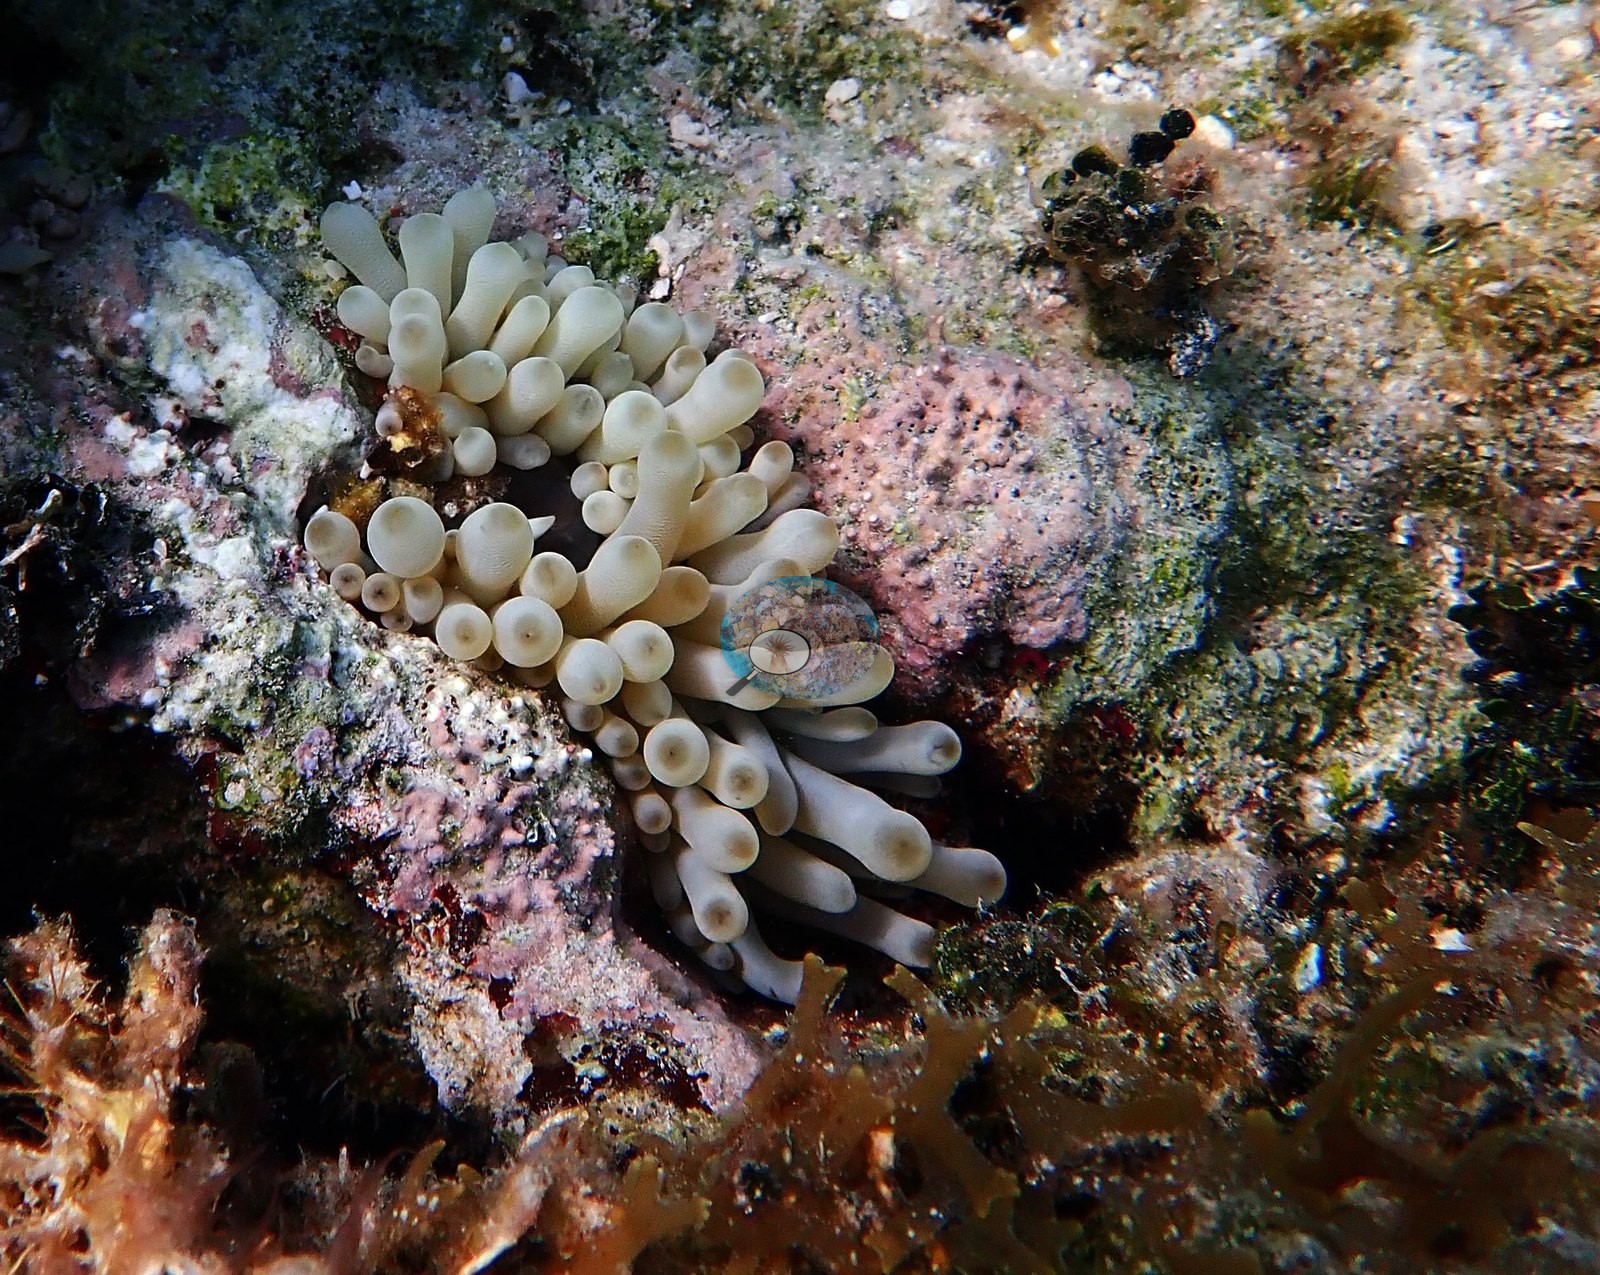
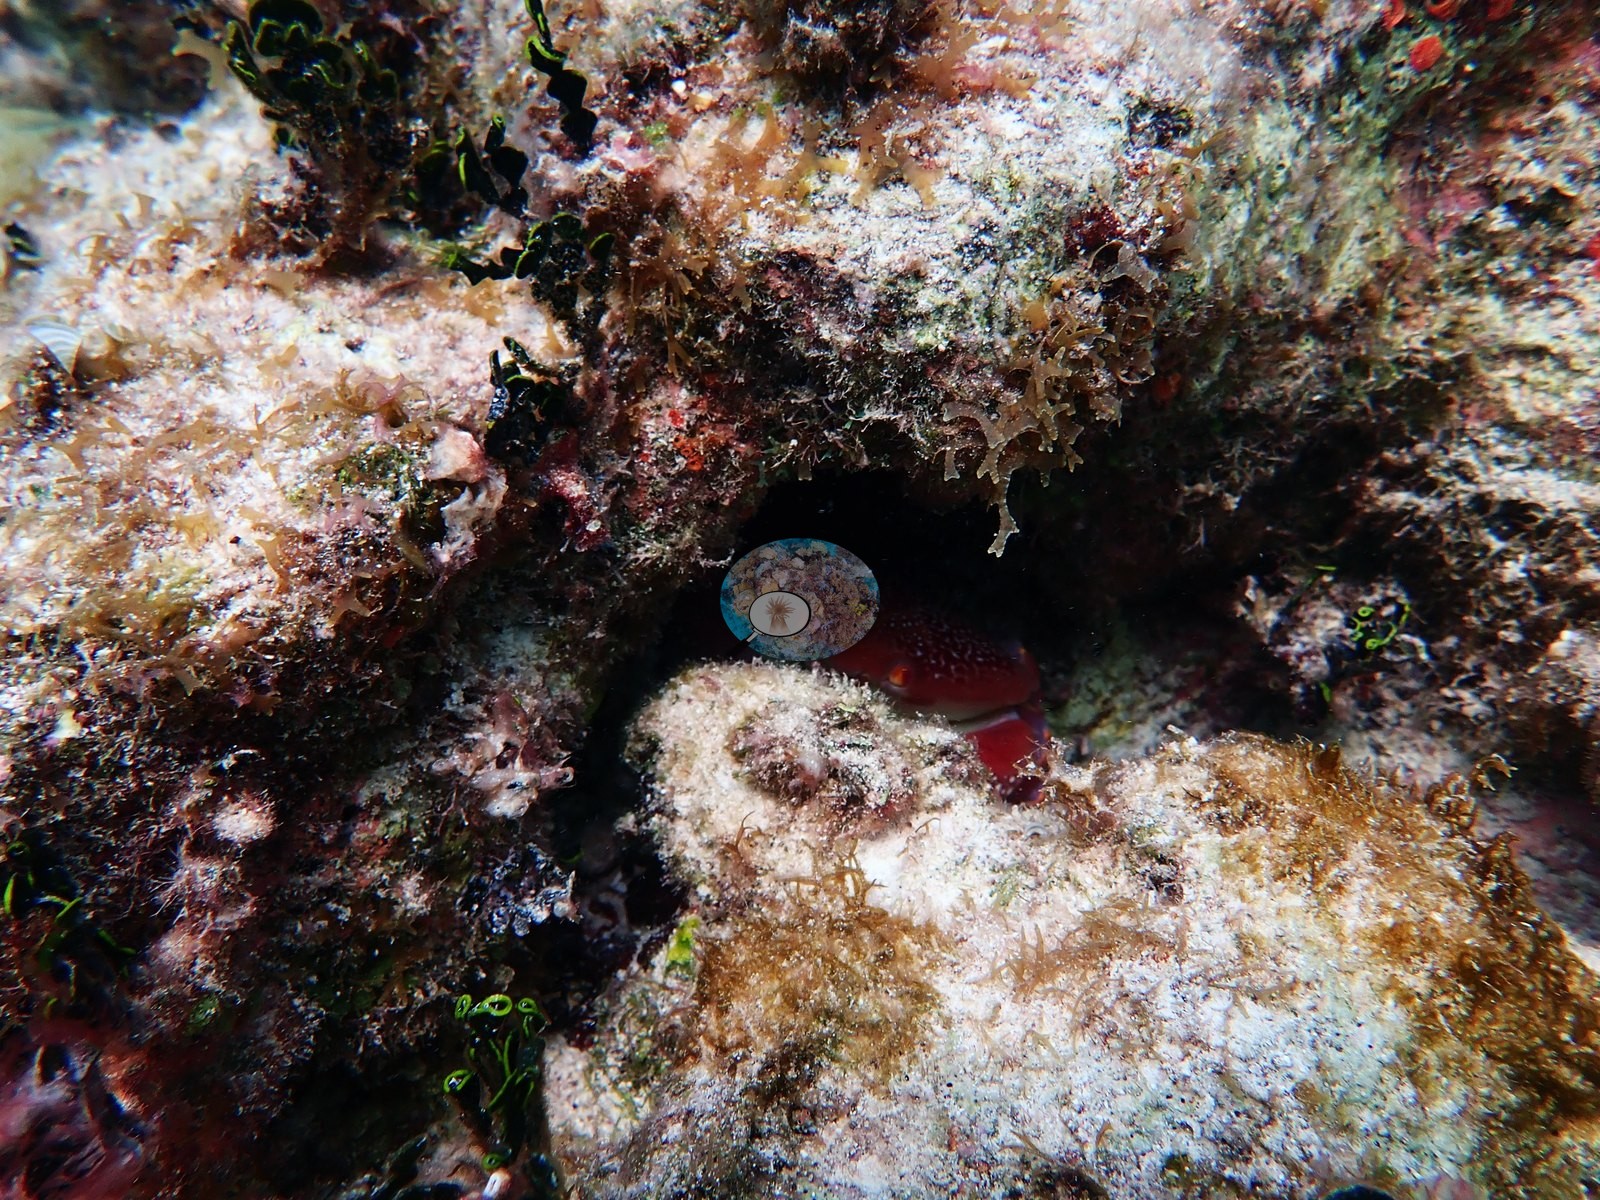
Big Caribbean giant anemones with fat, pale bulb-tipped tentacles are wedged into coralline rock in Image 29, Image 30, and Image 28, and Image 54 is a crab tucked into a crevice.
Comparisons with other data
We found no other surveys at this site as of 2026. Within 5 km, seventeen independent stations (AGRRA, Reef Check, and XL Catlin Seaview Survey) recorded station-year means of 0.7–23% hard coral cover between 2004 and 2019; the nearest, AGRRA at Tunnel Wall, 0.76 km away, read 4.3–7.0% between 2011 and 2019.
Other notes
Frame-level account from Anderson's photographs of the second Bahamas dive (73 edited frames); the dive log names that dive, at 11:35 on 13 October 2022, King Reef.
CV model comparison
More info
A few colony-focused photos raise the mean; the median is the typical photo. No computer-vision method yet estimates coral cover accurately on new images, so treat this as indicative rather than a measurement; it is revised as the methods improve.More info
CoralSCOP was run on the same photos and is listed for comparison. No diver transect exists for this trip, so agreement between the rows is not accuracy, and no computer-vision method yet estimates coral cover accurately on new images; treat every row as indicative.| Method | Hard coral cover (%) | Photos (n) ± SE |
|---|---|---|
| CoralSCOP edited | 15.5 | n = 60 · SE 1.8 |
| Claude (edited photos) | 9.1 | n = 60 · SE 1.6 |
CoralSCOP (edited photos) reads 15.5%, within 6.4 pp of Claude's blind point count (9.1%).
See a more detailed, stand-alone version of this table.
Independent surveys nearby
| Agency / program | Year(s) | Stations / distance | Link |
|---|---|---|---|
| AGRRA | 2008–2019 | 14 stations, 0.76–3.17 km | Records ↓ |
| Reef Check | 2004–2010 | 2 stations, 2.44–2.54 km | Records ↓ |
| XL Catlin Seaview Survey | 2013 | 1 station, 2.93 km | Records ↓ |
 Coral Reef DiagnosticsYear-average (illustrative only, programs differ)
Within 5 km, 17 independent survey stations recorded hard coral cover in 29 surveys between 2004 and 2019. Of the 6 stations surveyed in more than one year, 3 declined (by 2.0–9.0 points) and 3 increased (by 2.0–8.0 points) between their first and latest surveys. 6 stations share the longest span (2011–2019); one, Nari Nari (AGRRA, 2.95 km away), went from 10% in 2011 to 5.8% in 2019. The most recent nearby survey is from 2019, so these values predate recent heat stress. This site's own estimate (9.1%) sits within the range of these station-year means up to 2 km away (4.3–11%); the methods differ, so the comparison is context, not a like-for-like test.
Collected by other programs using different methods (Reef Check uses point-intercept transects; AGRRA uses benthic point-intercept transects, reported here as live coral cover; the XL Catlin Seaview Survey uses photo-transects with automated image annotation), so these are context for the figures above, not a like-for-like comparison. Where a station was surveyed more than once, the cell shows either the range of its values or, as a single value, the mean of surveys made in one year. Station names are not dive-site names.
Show all 29 independent surveys
| Agency | Site / location | Date | Hard coral cover (%) | Distance | Link |
|---|---|---|---|---|---|
| Reef Check | Goulding Cay Reef | 2004 | 8.8% | 2.54 km | — |
| AGRRA | — | 2008 | 11% | 1.60 km | — |
| AGRRA | — | 2008 | 7.3% | 2.45 km | — |
| AGRRA | — | 2008 | 9.9% | 2.84 km | — |
| AGRRA | — | 2008 | 19% | 2.85 km | — |
| AGRRA | — | 2008 | 7.0% | 2.89 km | — |
| Reef Check | Goulding Cay | 2010 | 5.6% | 2.44 km | — |
| AGRRA | Tunnel Wall | 2011–2019 | 4.3–7.0% (2 surveys) | 0.76 km | — |
| AGRRA | Elkhorn Garden | 2011–2019 | 10–14% (3 surveys) | 2.37 km | — |
| AGRRA | BBC | 2011–2019 | 14–16% (2 surveys) | 2.78 km | — |
| AGRRA | Willaurie | 2011–2019 | 13–21% (range of yearly means; 4 surveys) | 2.88 km | — |
| AGRRA | Nari Nari | 2011–2019 | 5.4–10% (range of yearly means; 4 surveys) | 2.95 km | — |
| AGRRA | Clifton Wall | 2011–2019 | 9.4–23% (3 surveys) | 3.17 km | — |
| XL Catlin Seaview Survey | transect 24013 | 2013 | 0.7% | 2.93 km | doi:10.14264/uql.2019.930 |
| AGRRA | Bond Reef | 2019 | 12% | 2.83 km | — |
| AGRRA | Sand Chute | 2019 | 13% | 2.87 km | — |
| AGRRA | Wreck on the Wall | 2019 | 17% | 2.97 km | — |
Data & links
All images from Coral Reef Diagnostics. Data are from Coral Reef Diagnostics and the organizations named in the data sources above.
© Coral Reef Diagnostics.