

Goulding Cay (New Providence)

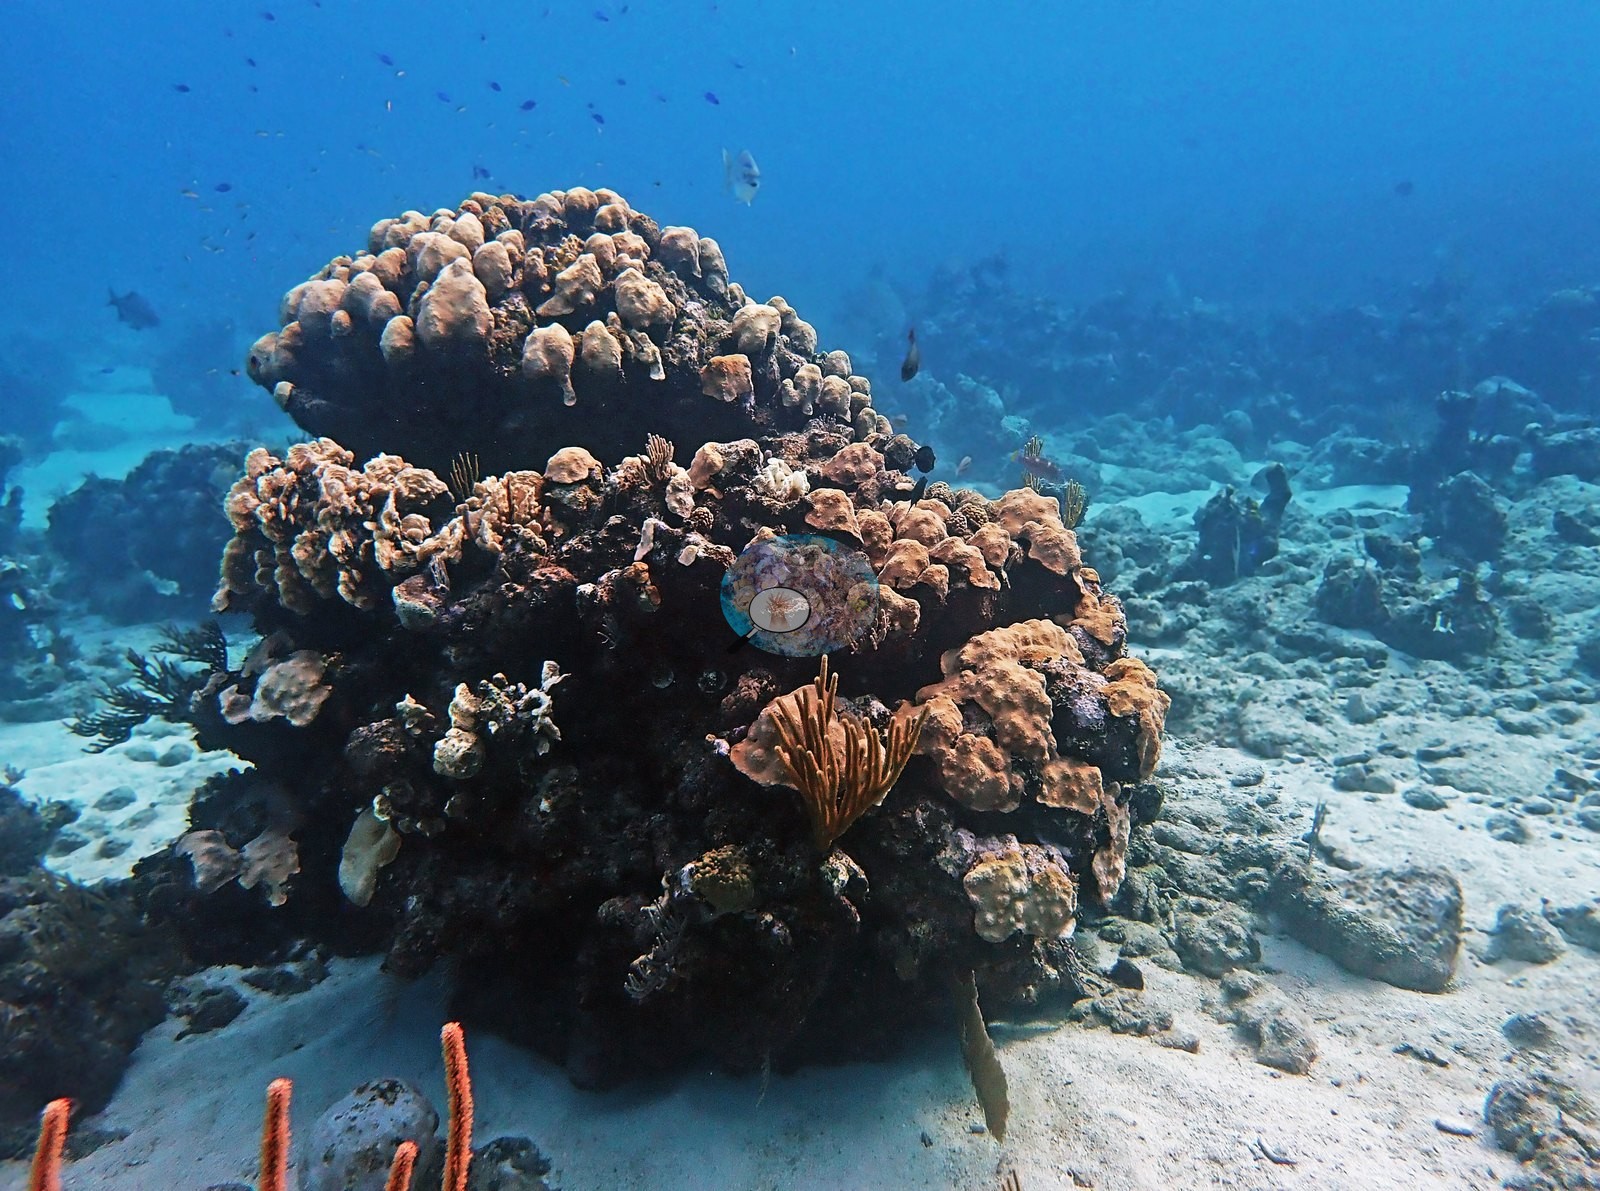
More info
Central Bahamas (NOAA CRW virtual station) · Bahamian ecoregion mean: 9.1 degree heating weeksGoulding Cay, off the western tip of New Providence, is a shallow spur-and-groove reef in bright white sand whose signature is a graveyard of dead elkhorn coral framework, now crusted in coralline algae and dotted with small new coral colonies. Brain corals, star corals, sea fans, and sponges make up the living reef, but bleached or partly white colonies turn up throughout the dive, including colonies Anderson himself labeled as bleached or diseased.
Fourteen independent survey stations shown with the program’s logo — click one to see how far it is from this site.
This page shows 80 of the 119 photographs from this site, including every one the text cites.
Site description
Setting
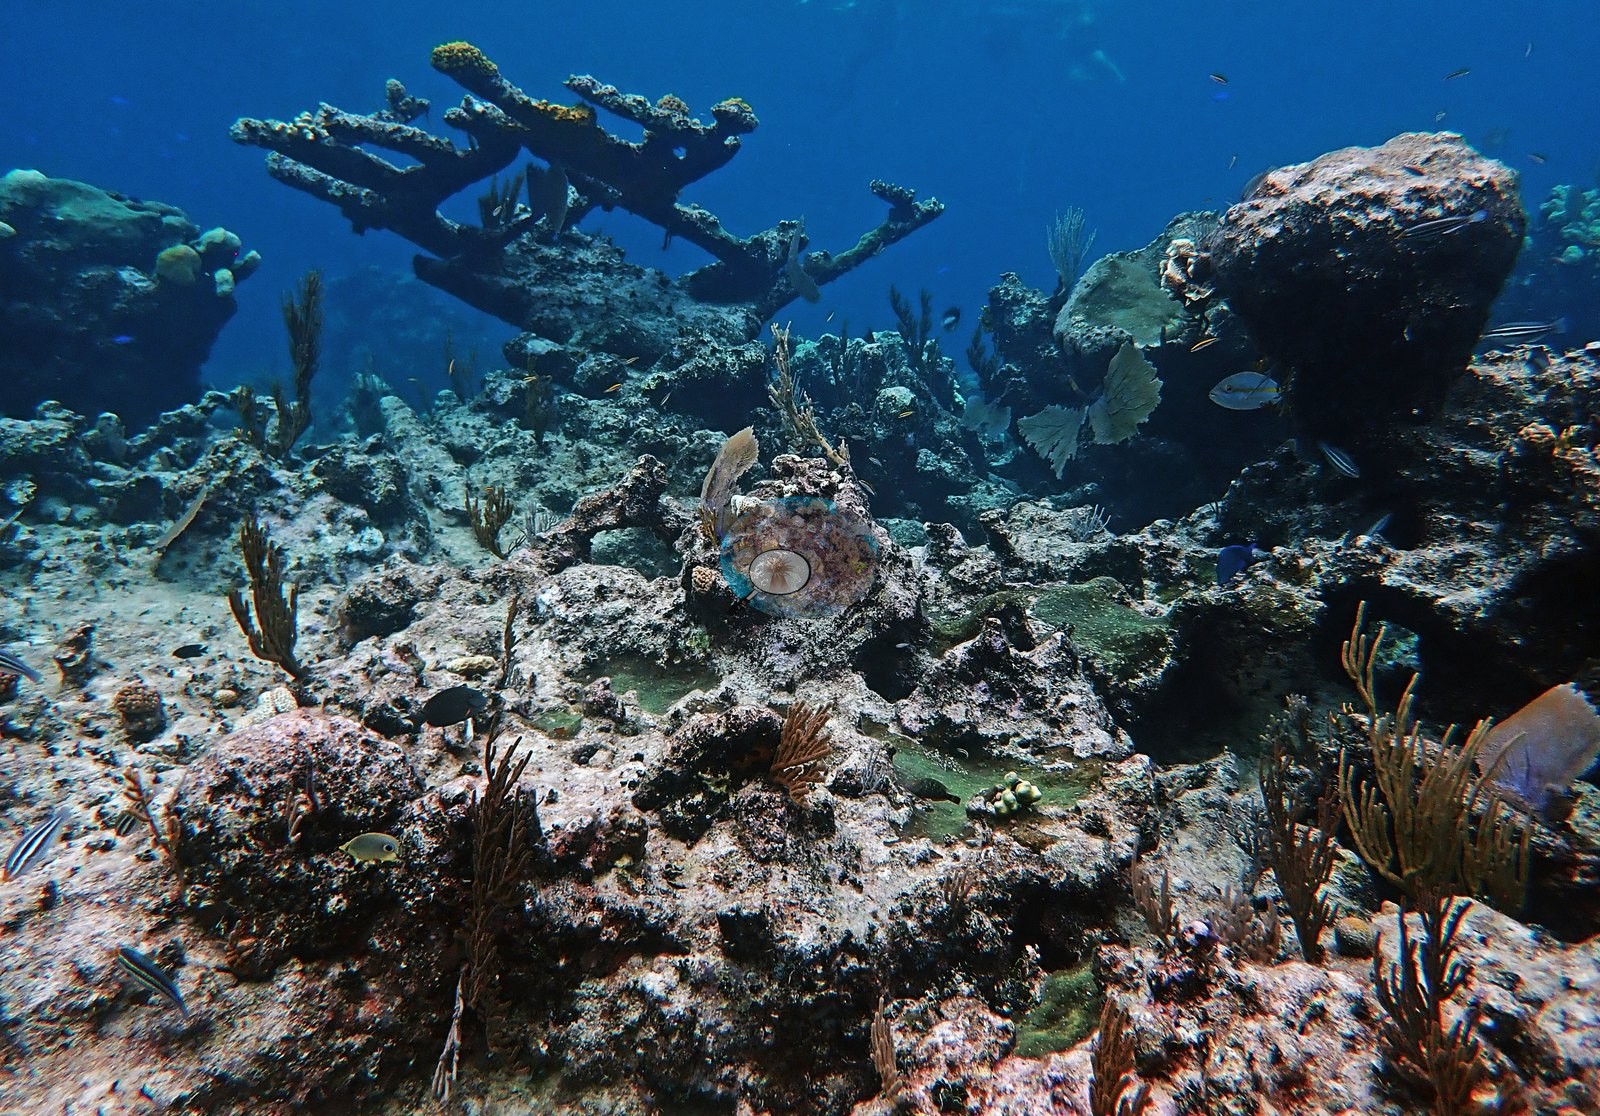
Goulding Cay lies off the western tip of New Providence near Nassau, dived 13 October 2022 to 11 m with an average depth of 6.4 m at 28.9 C. The reef is a shallow spur-and-groove and patch-reef complex set in bright white sand.
General benthic features
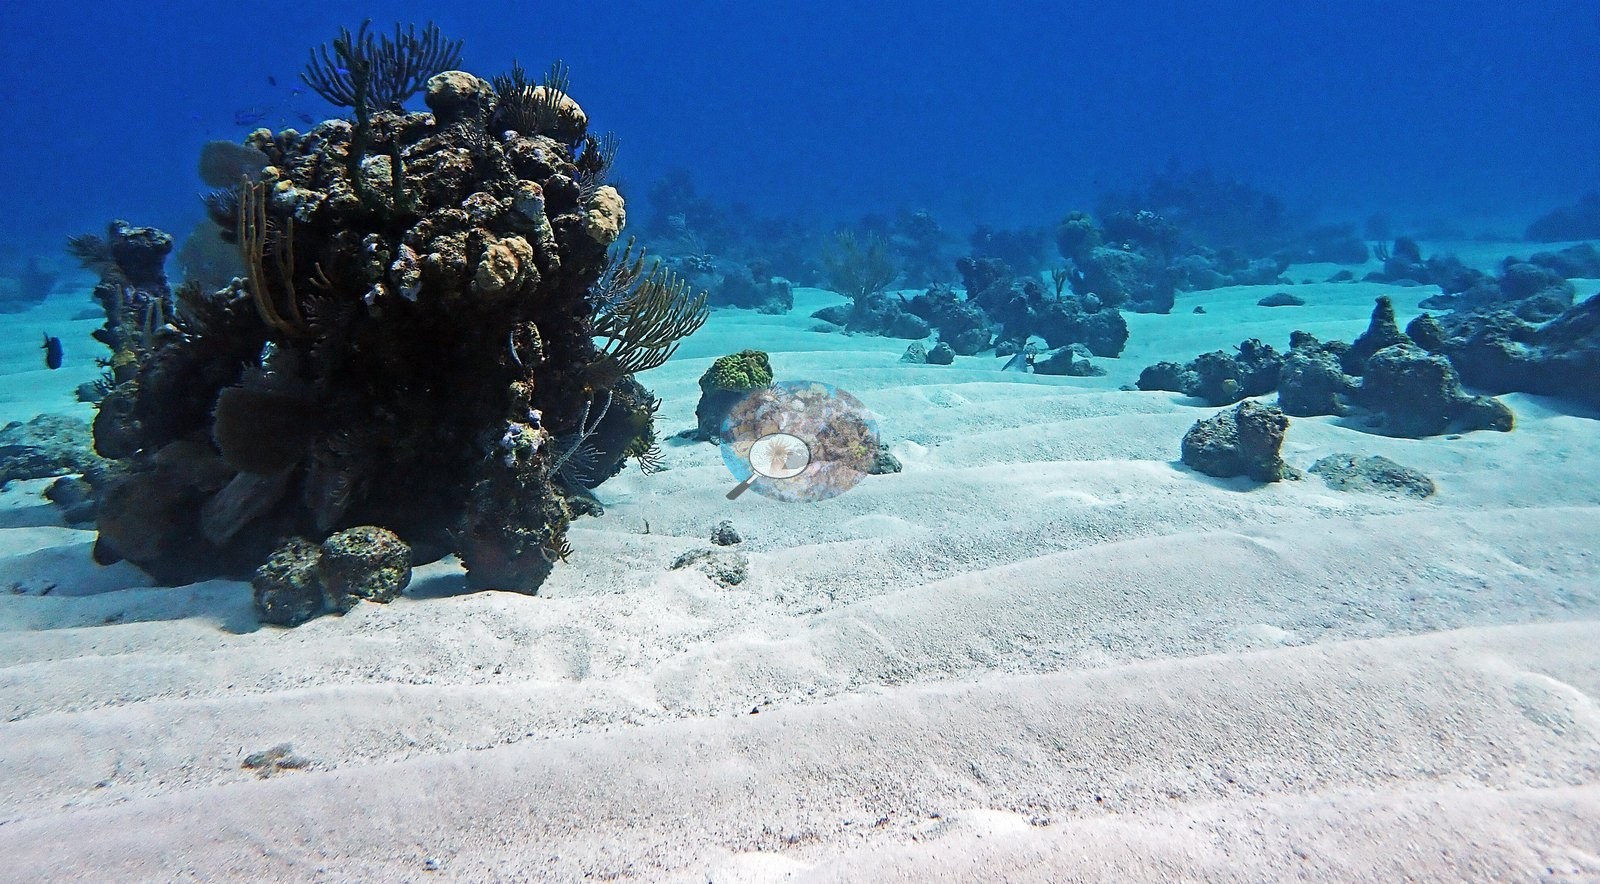
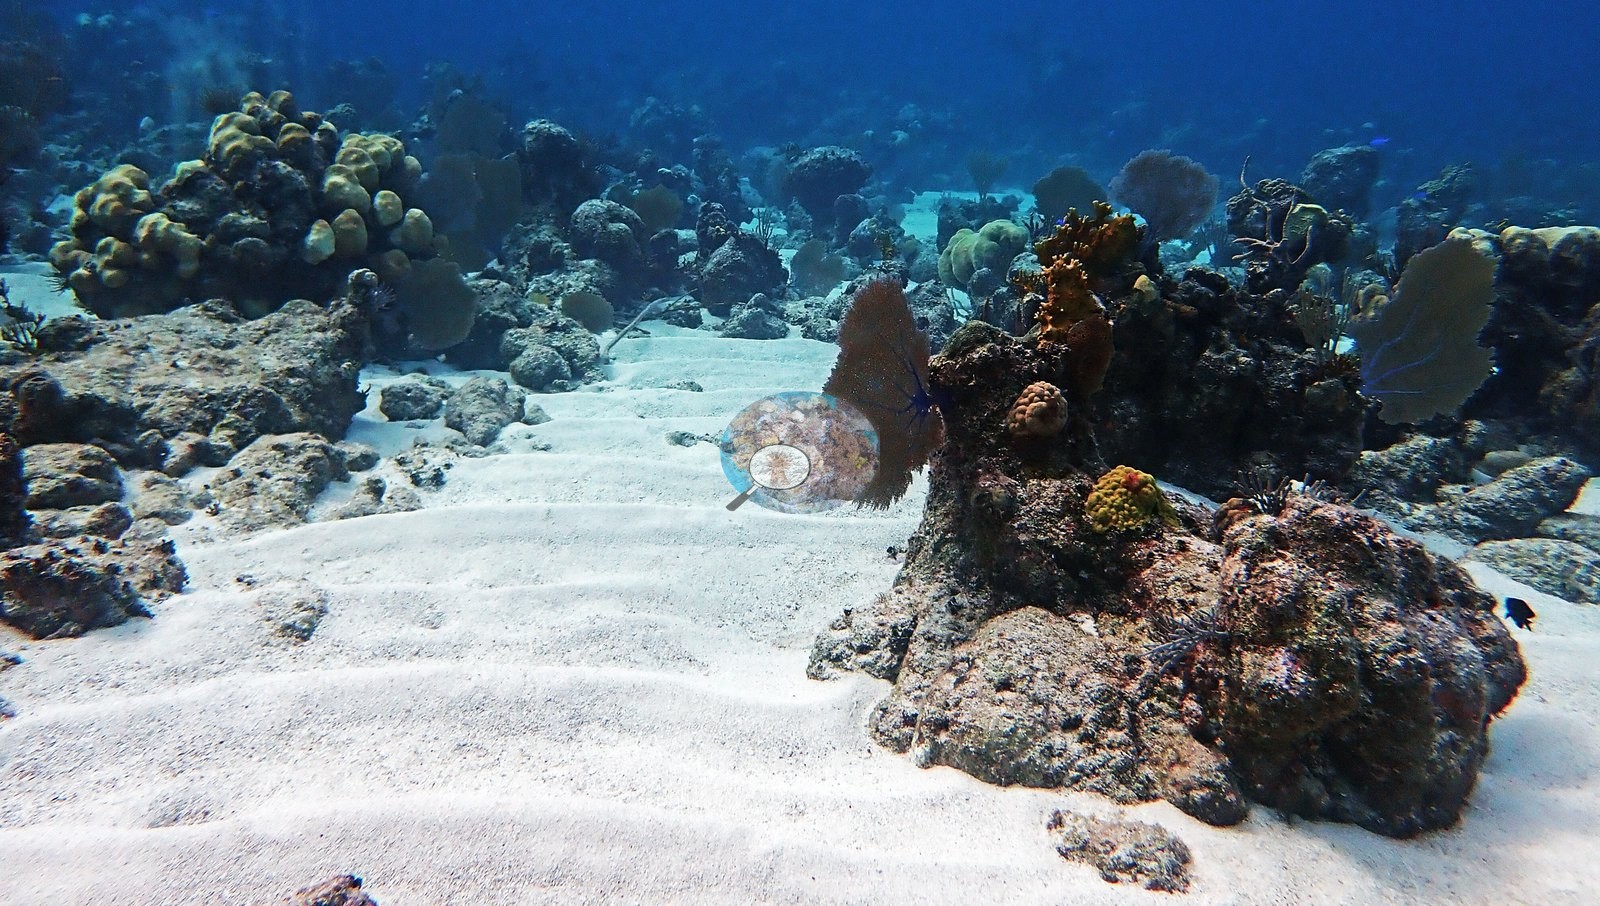
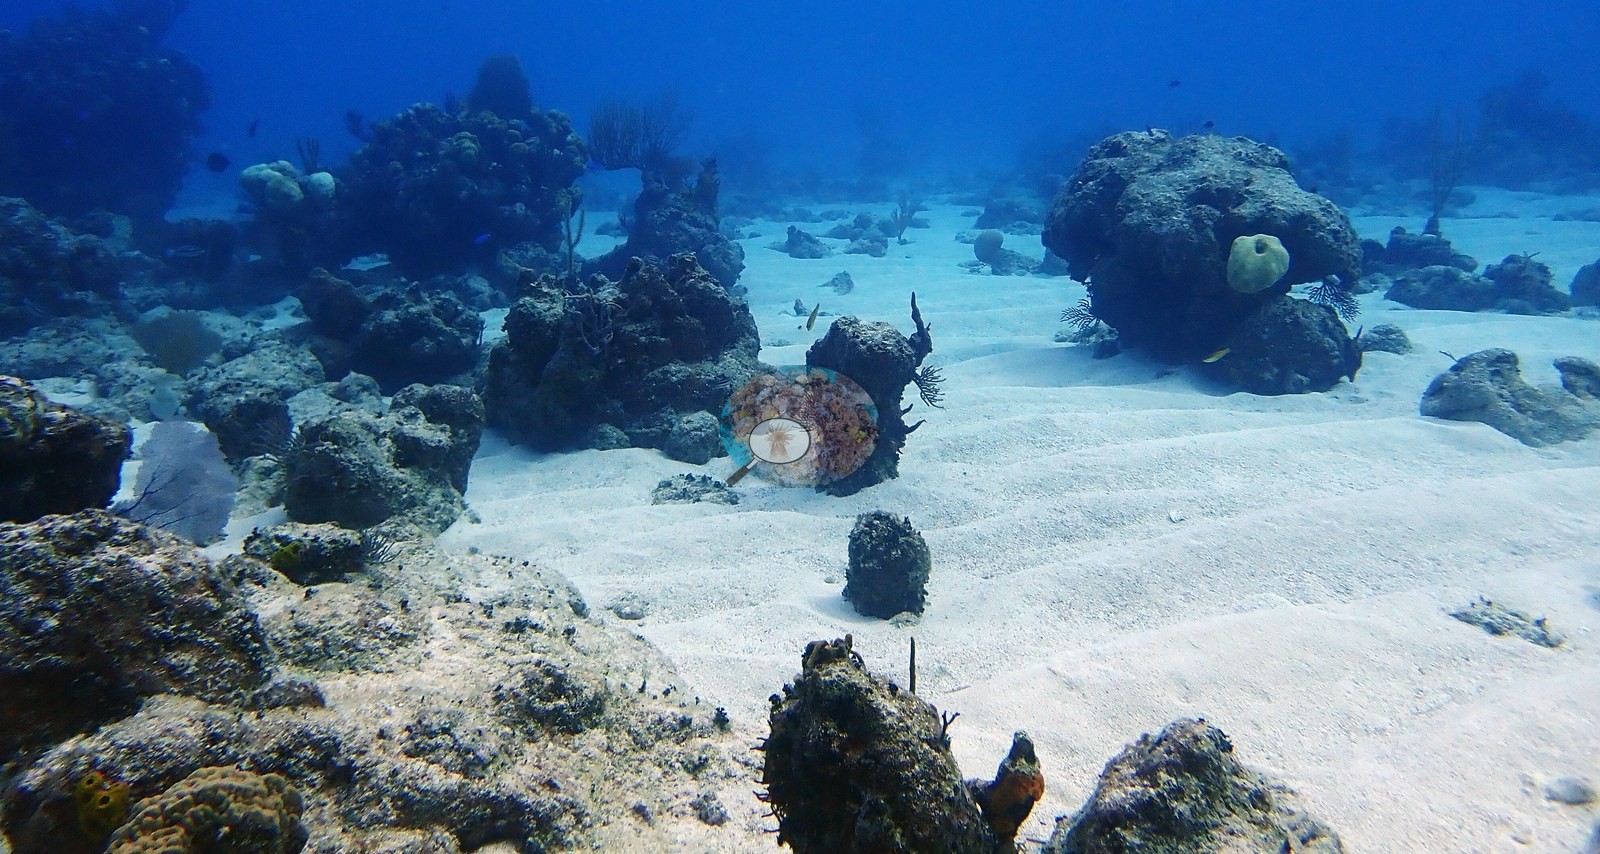
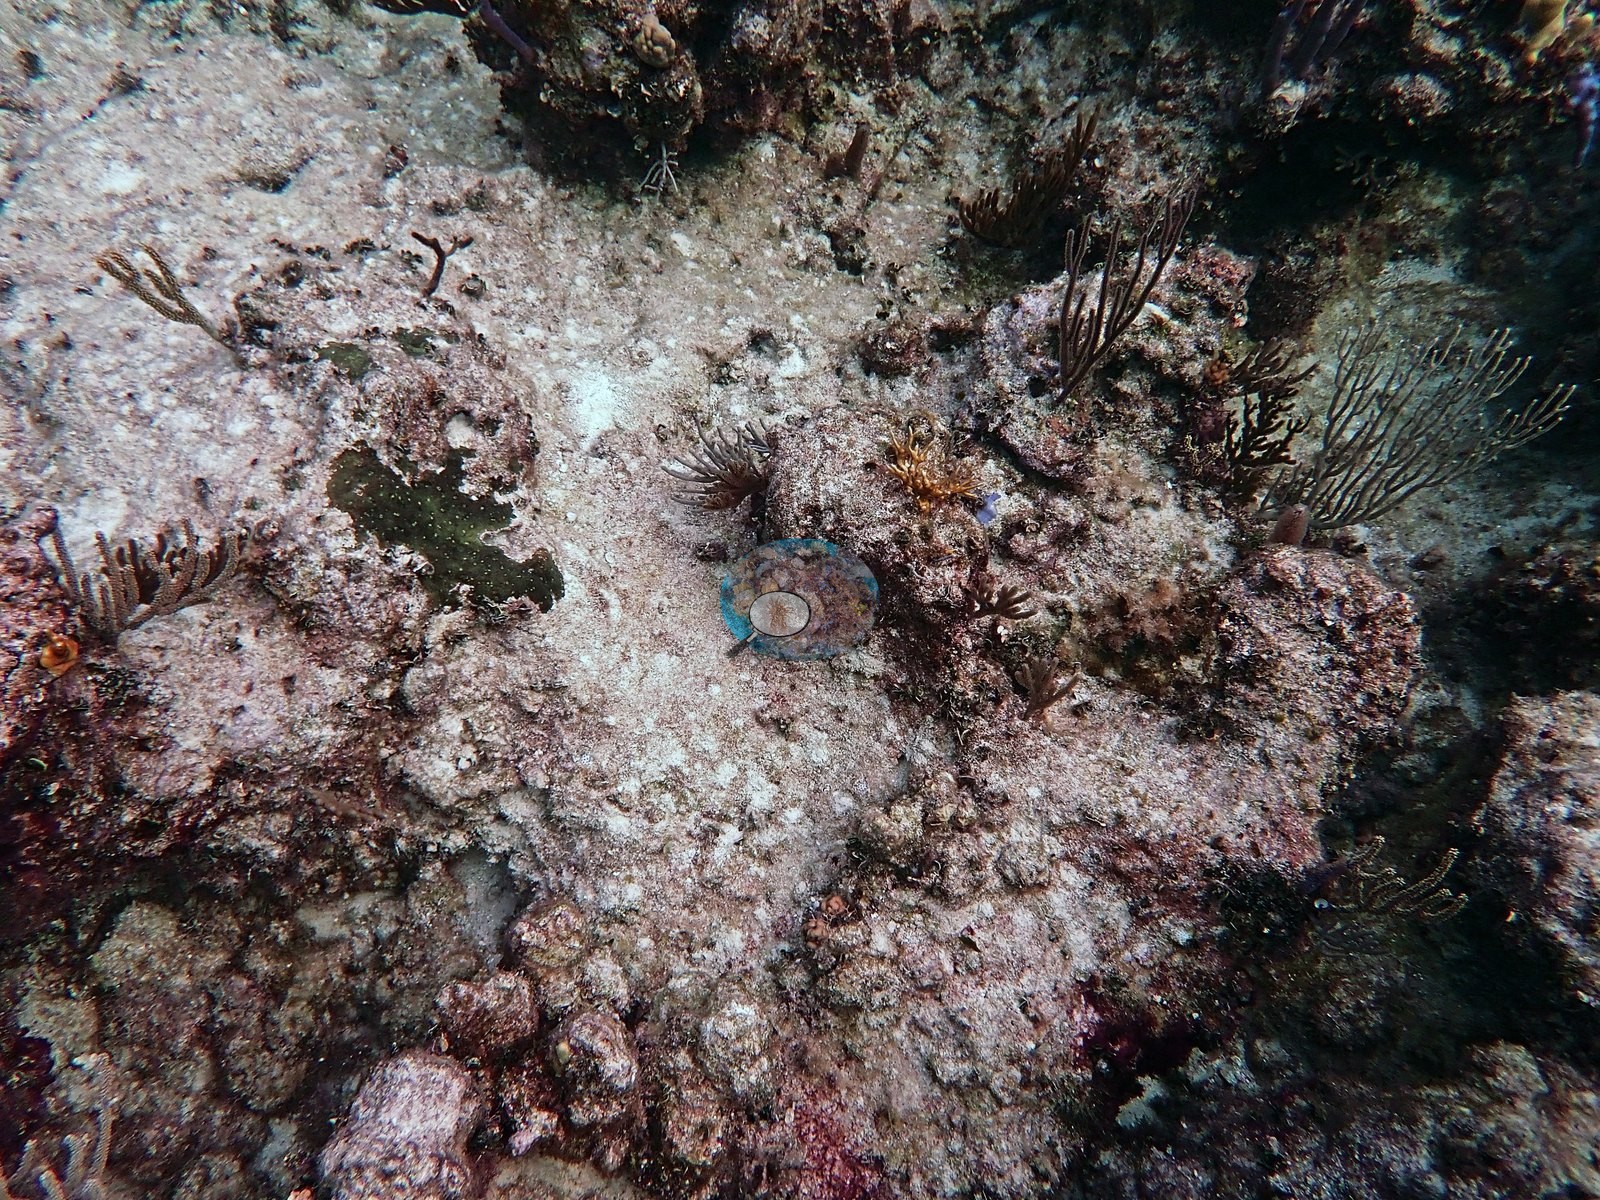
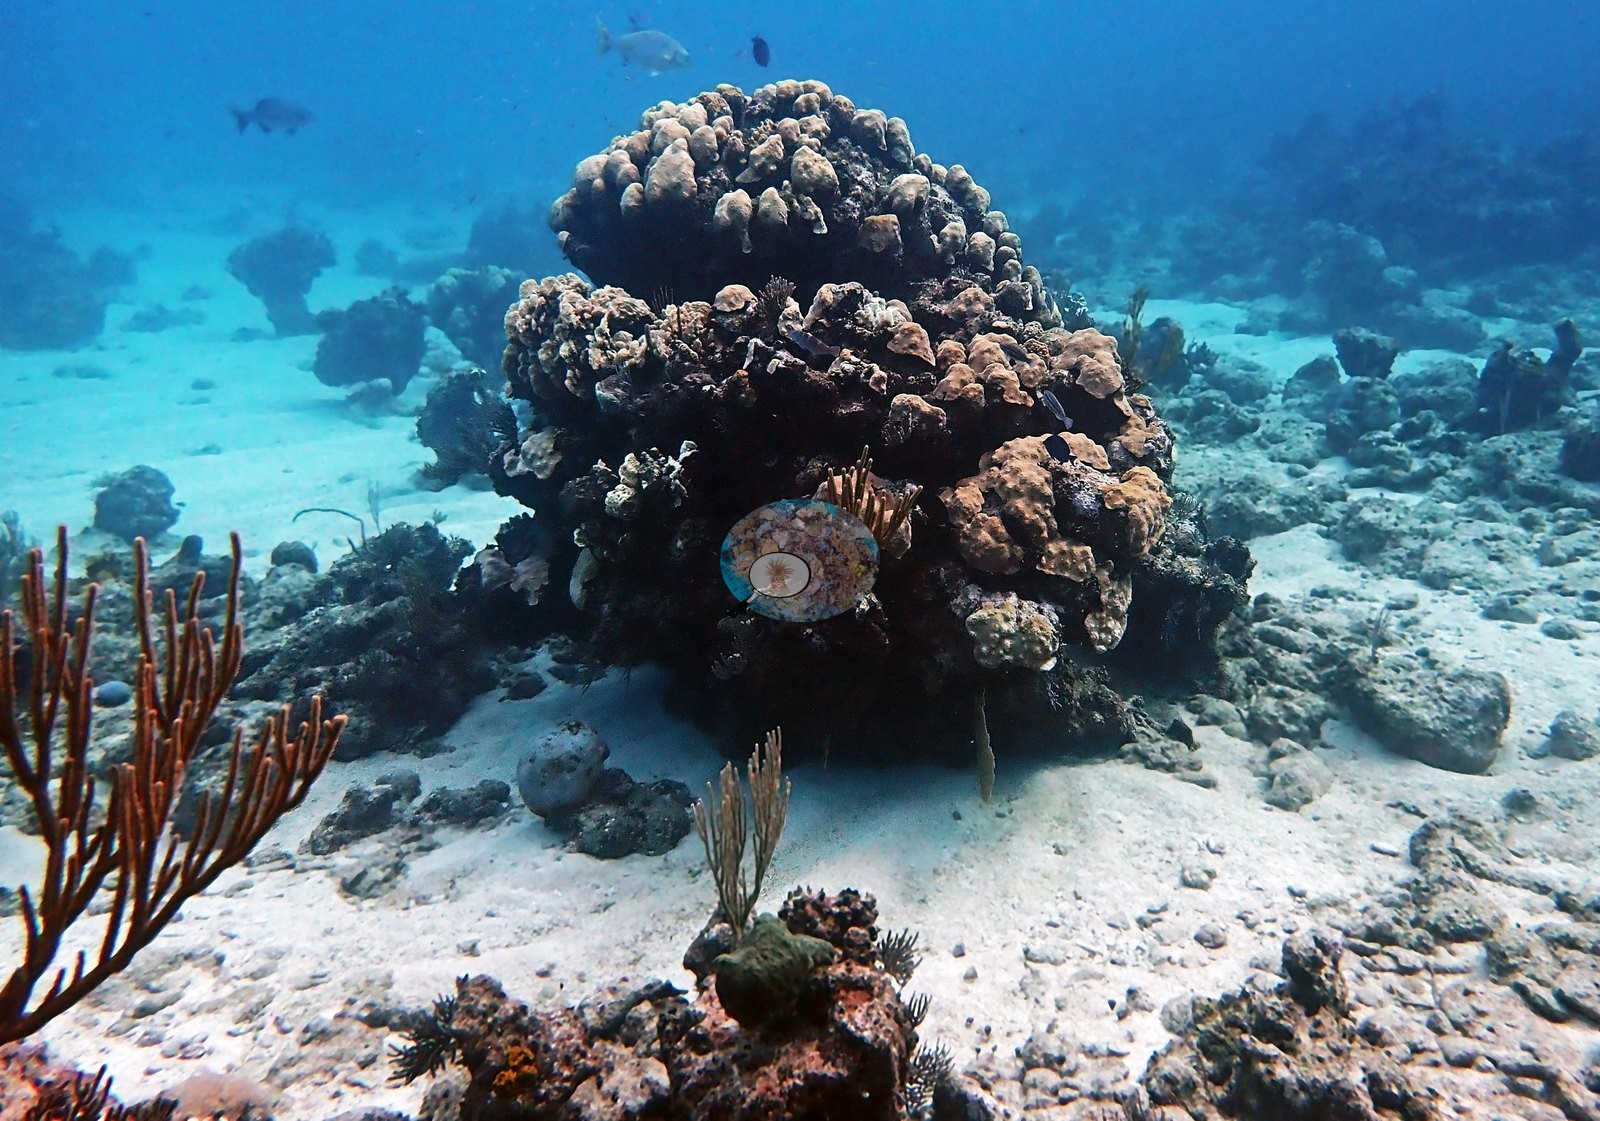
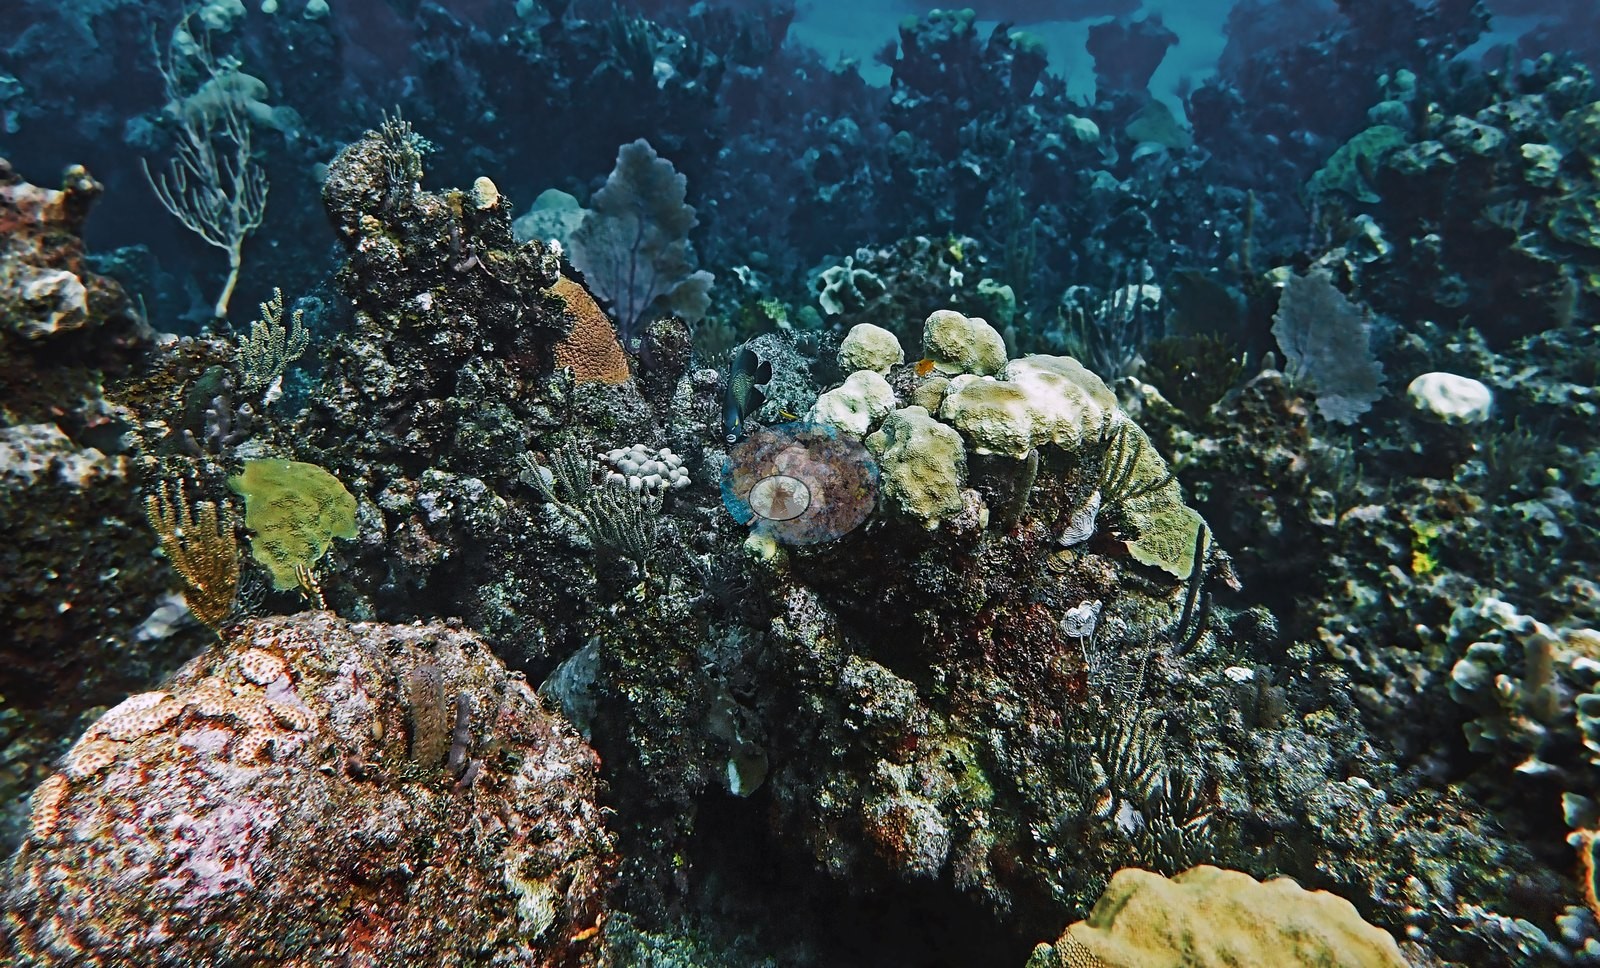
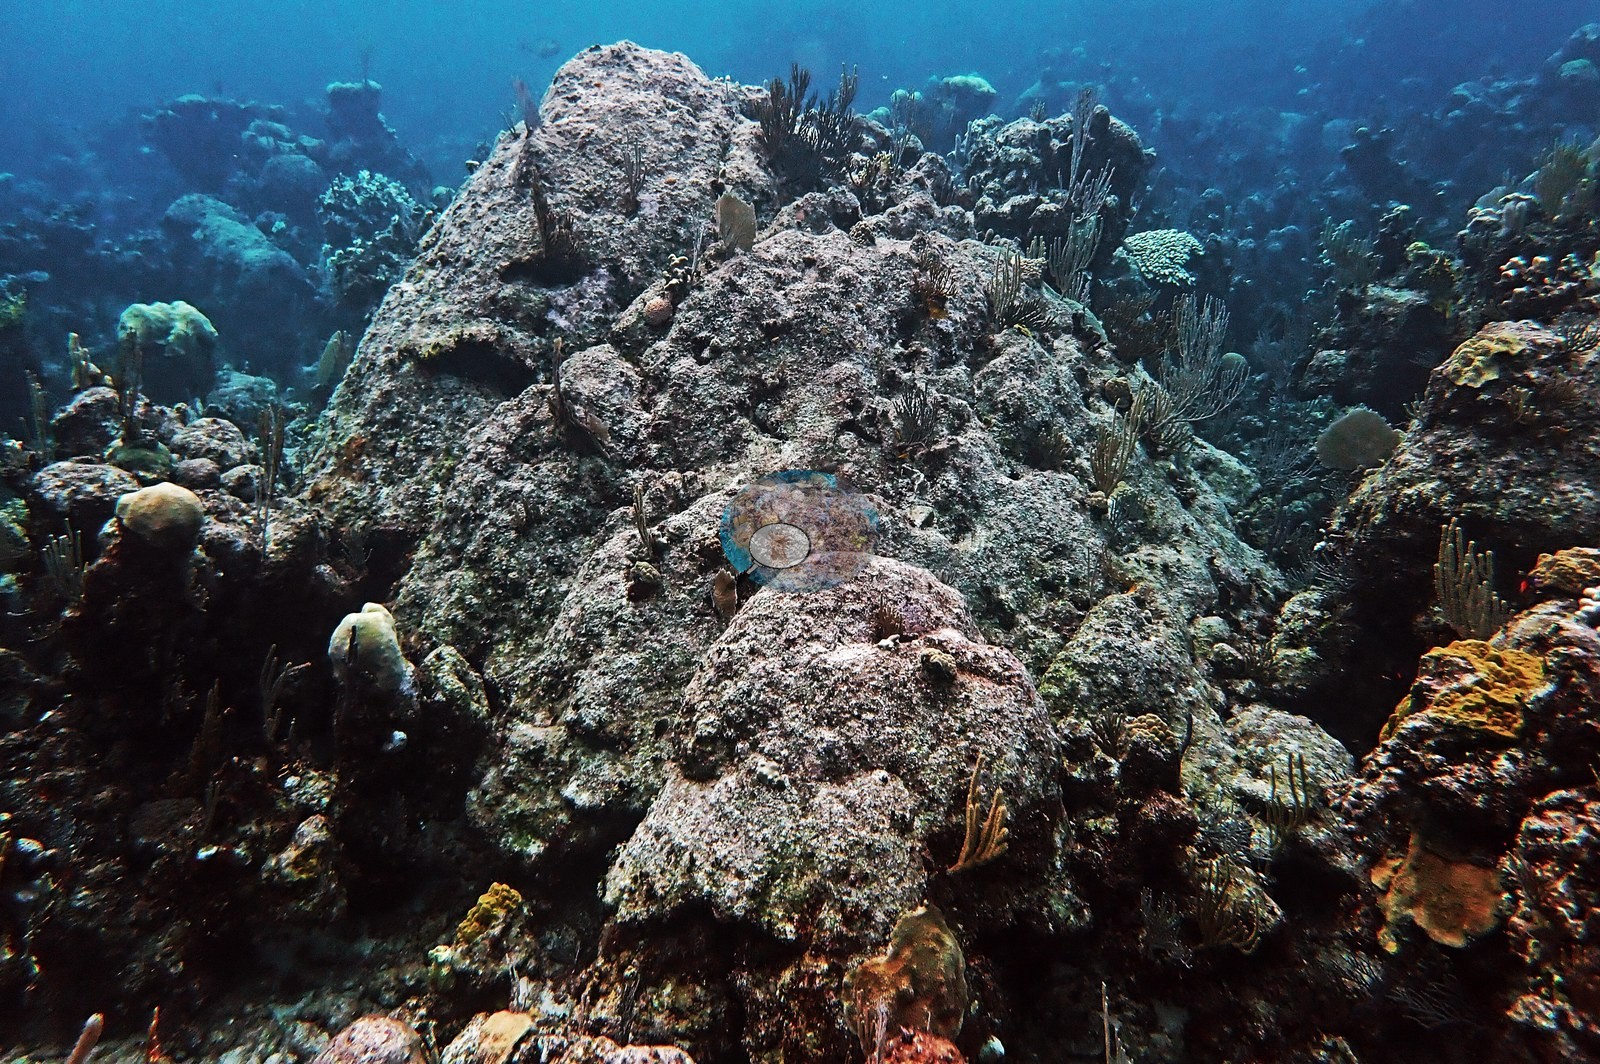
Broad rippled sand channels and open sand plains separate low coralline-crusted spurs and isolated bommies (e.g., Image 42, Image 45, Image 49, Image 54, Image 58, Image 63, Image 68), and in the shallowest stretches the spurs coalesce into continuous low-relief pavement (e.g., Image 76, Image 77, Image 78, Image 79, Image 80, Image 81, Image 82, Image 83, Image 94, Image 98).
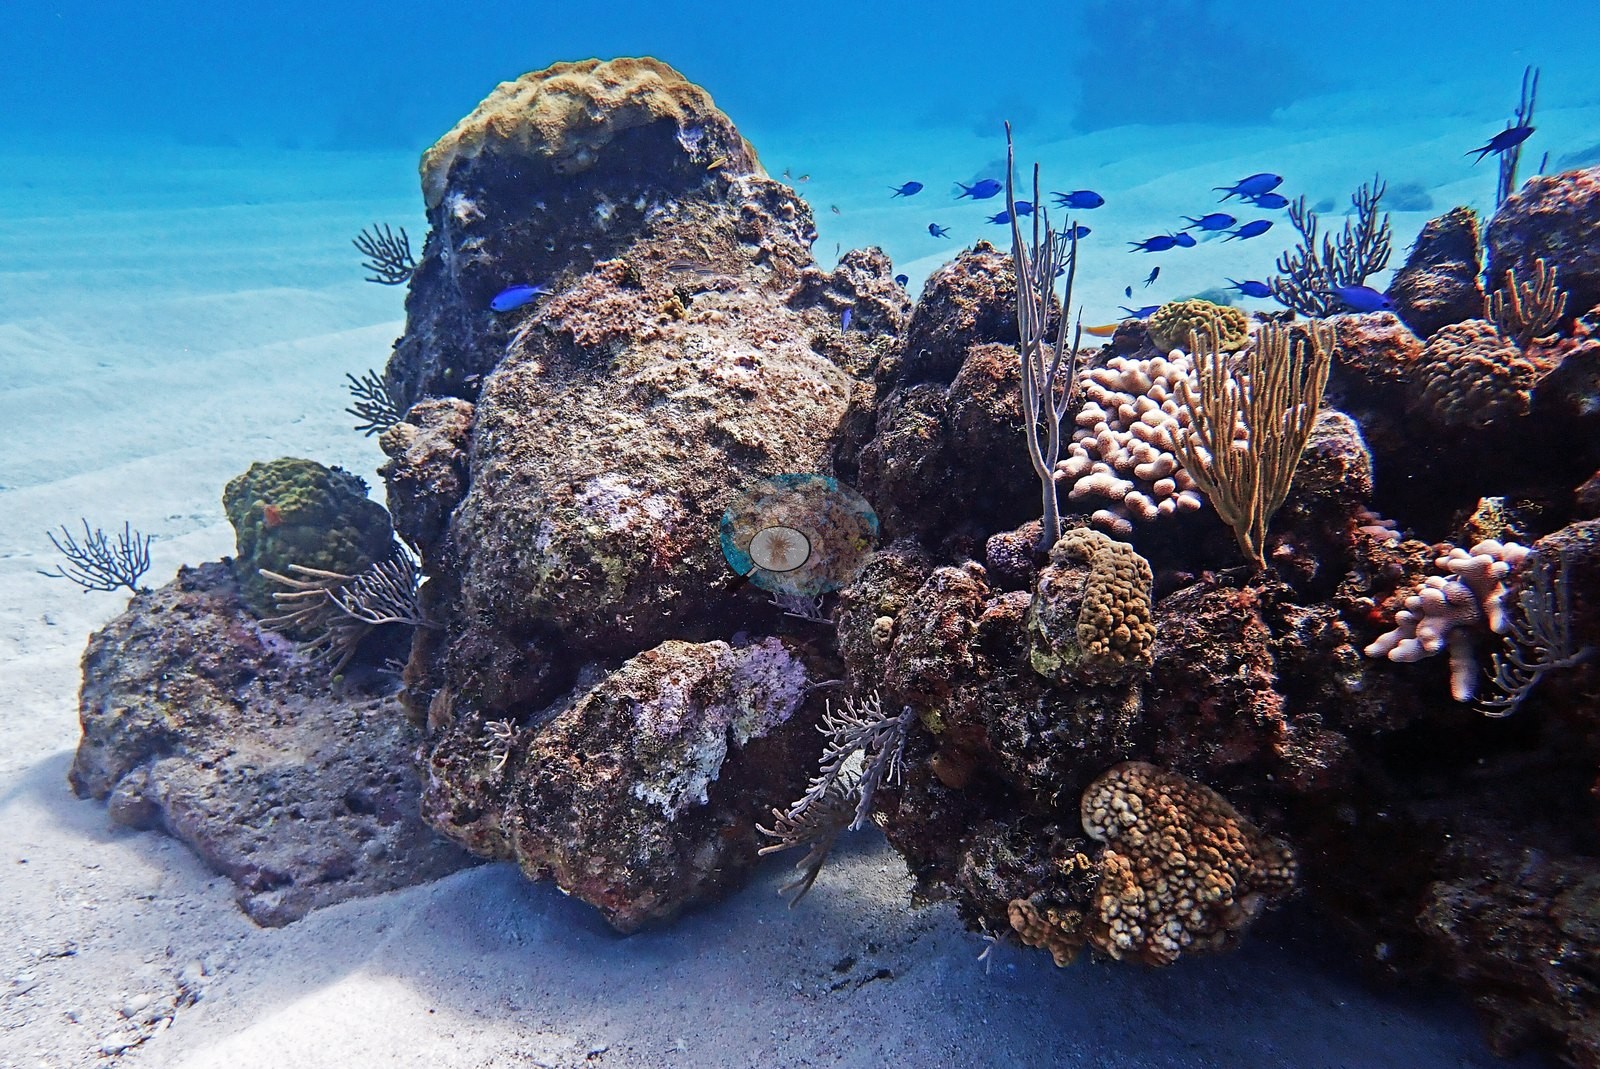
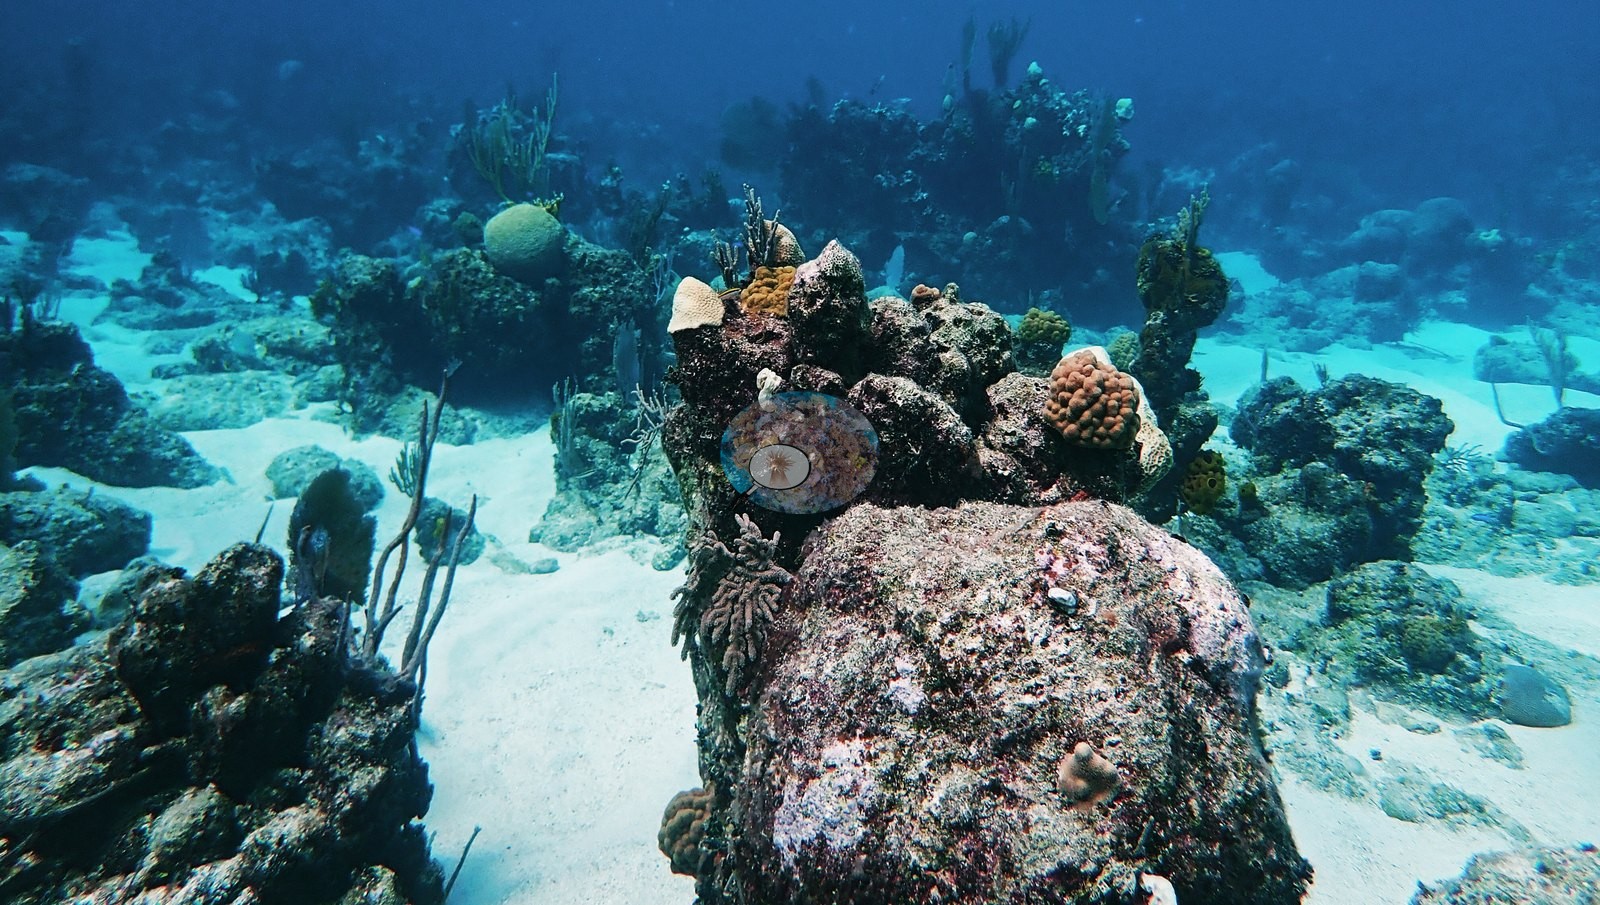
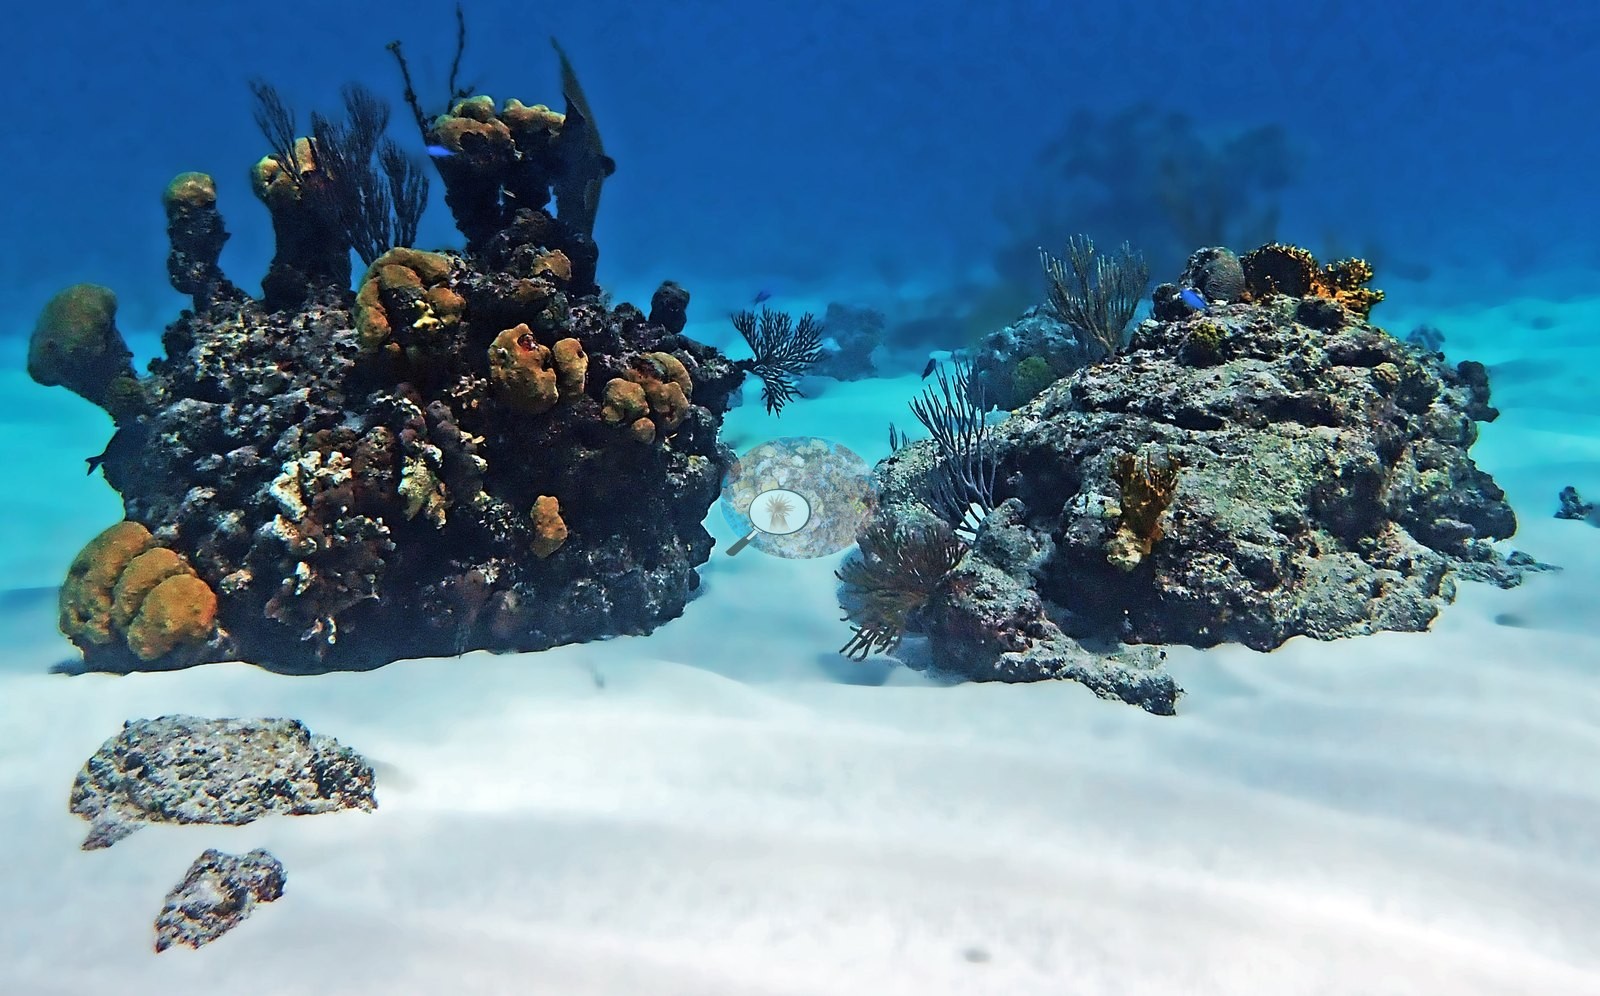
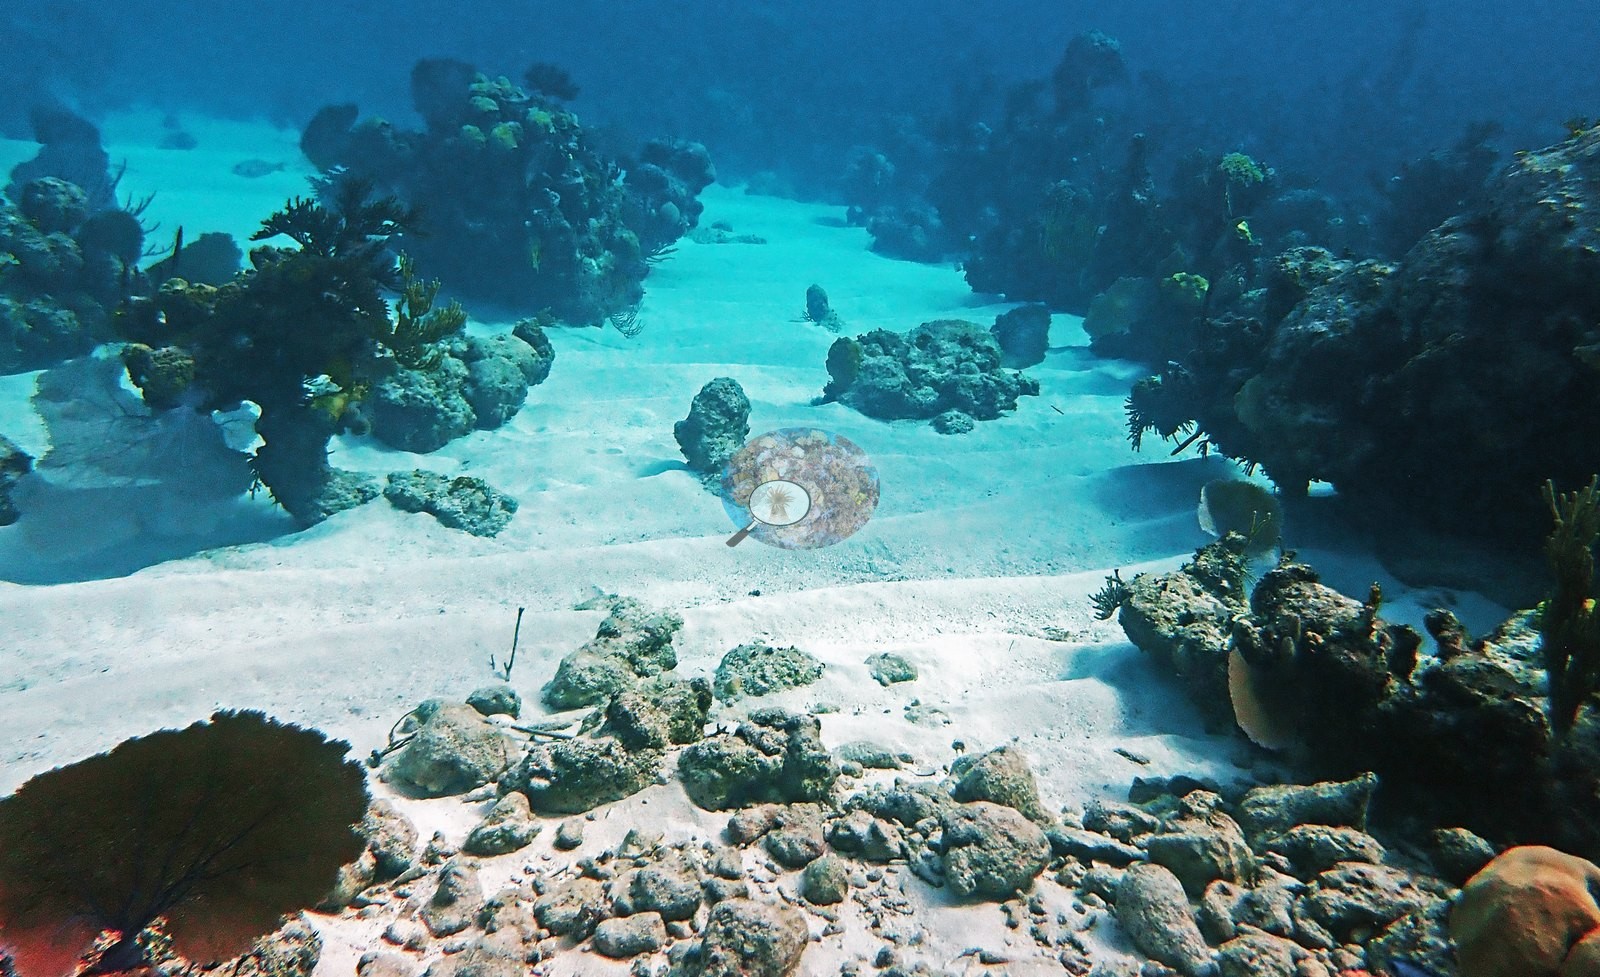
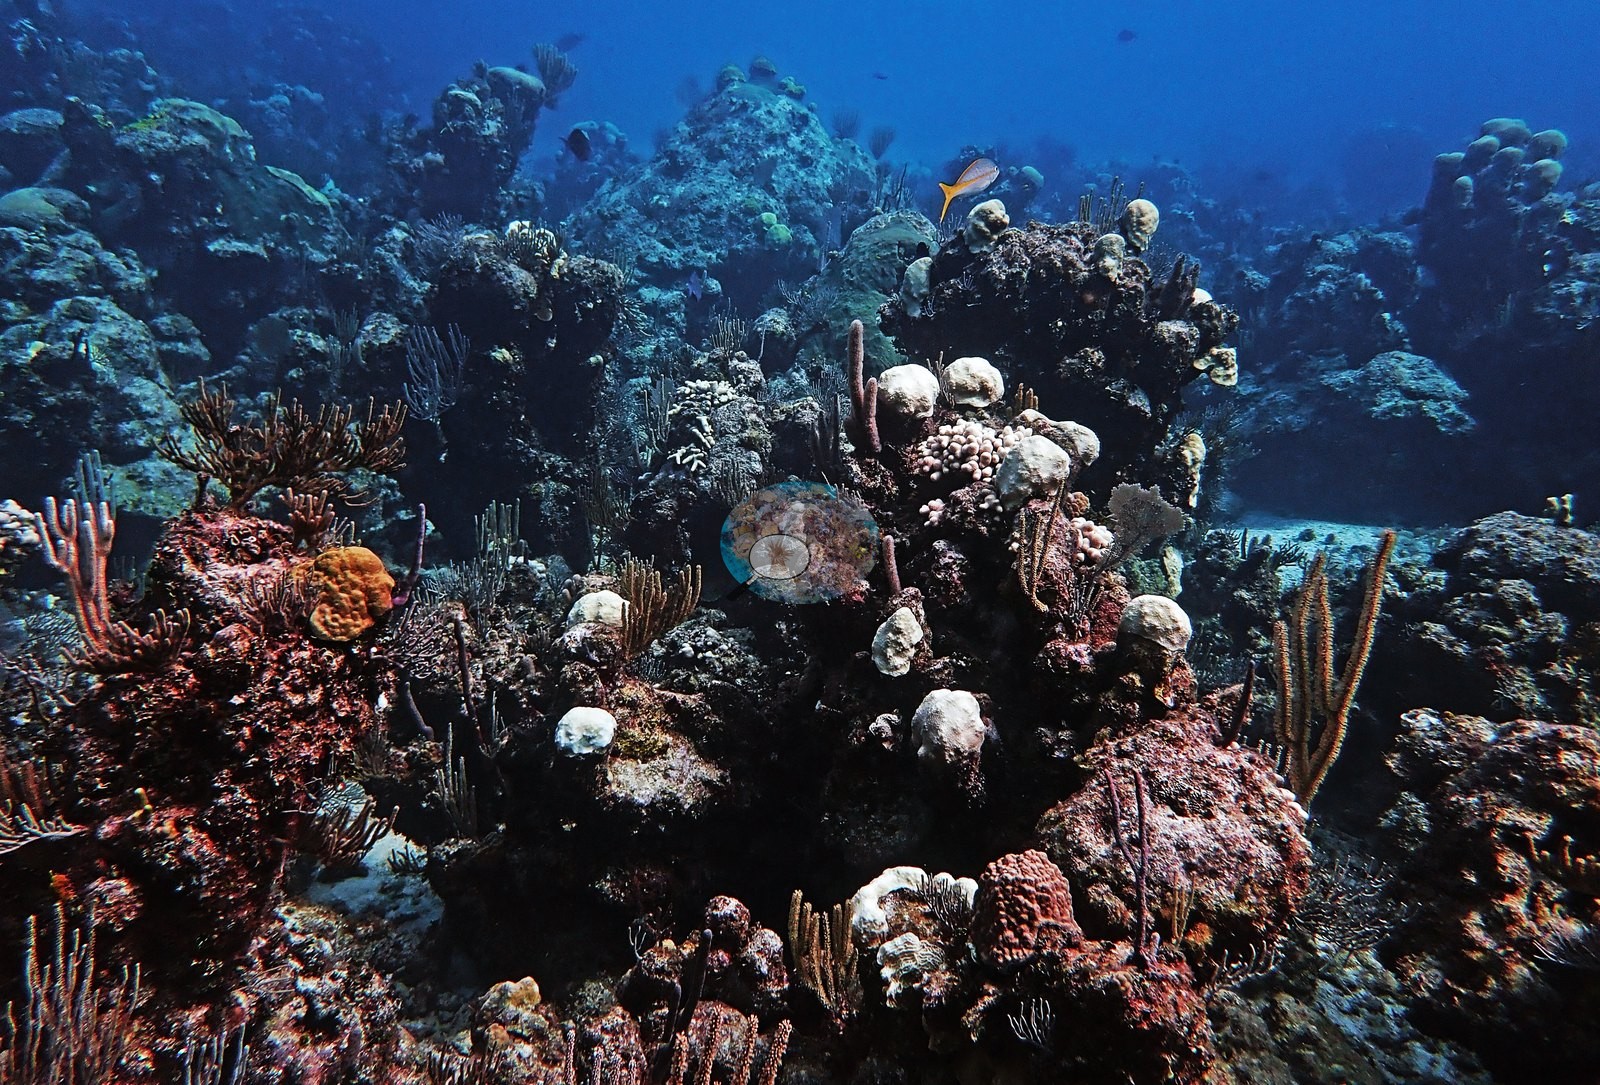
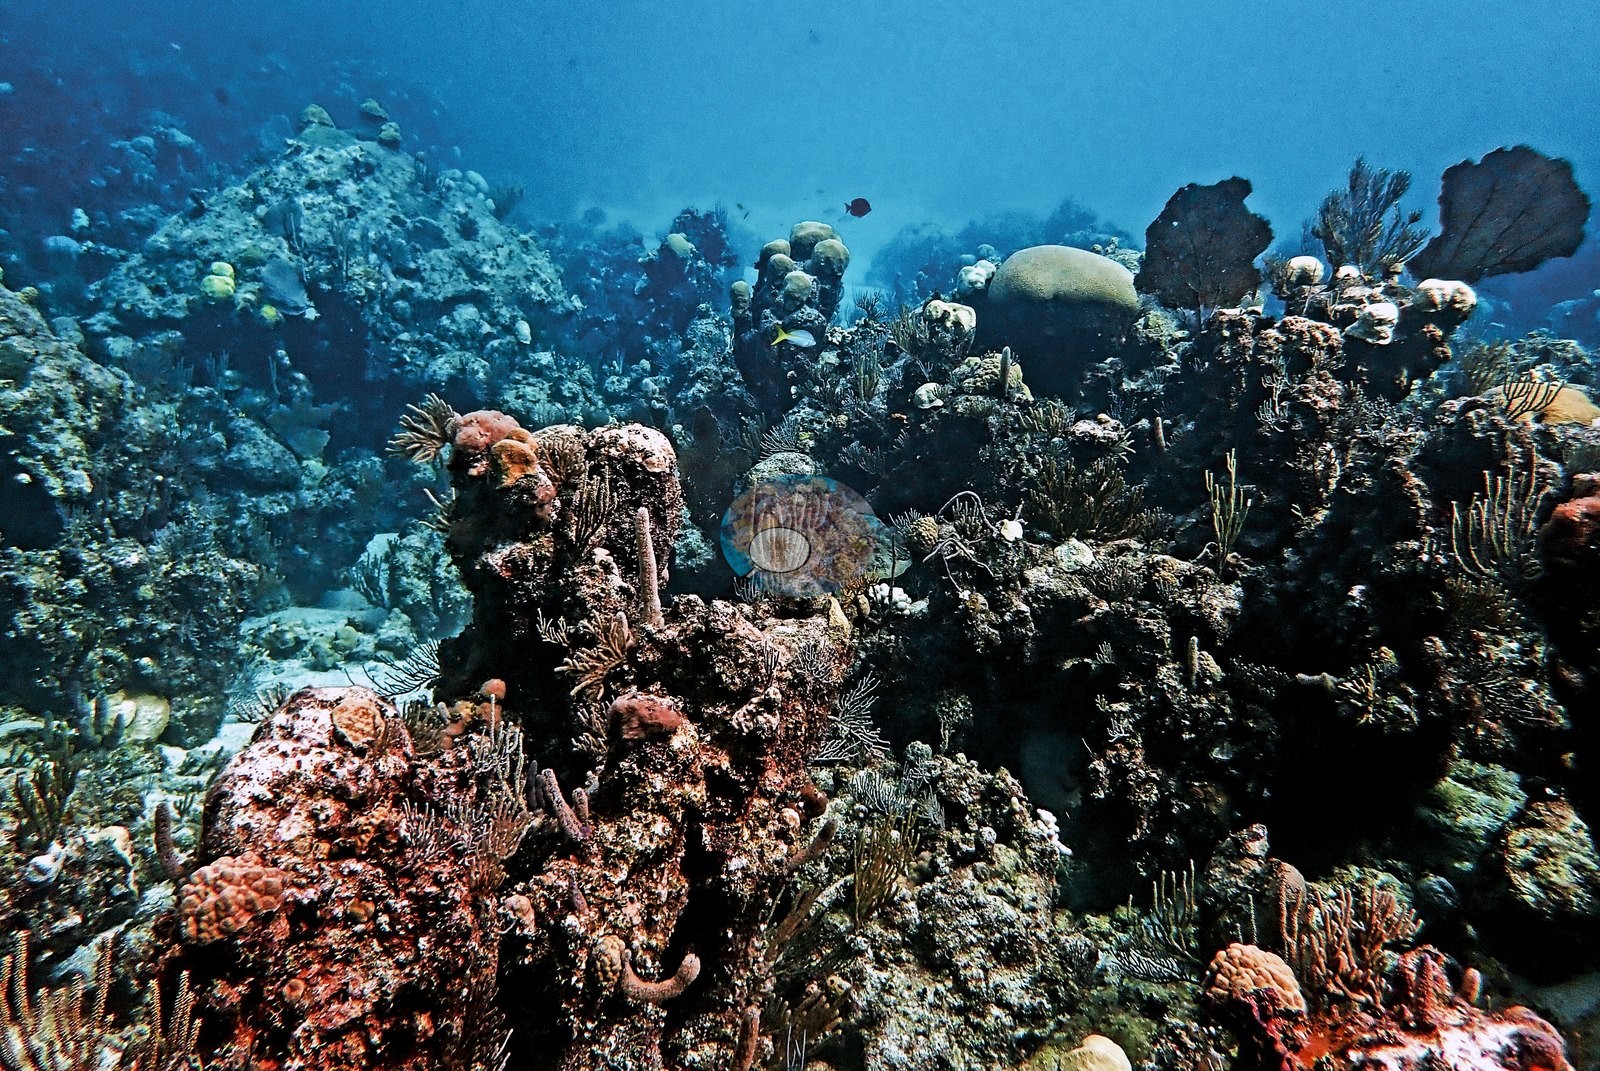
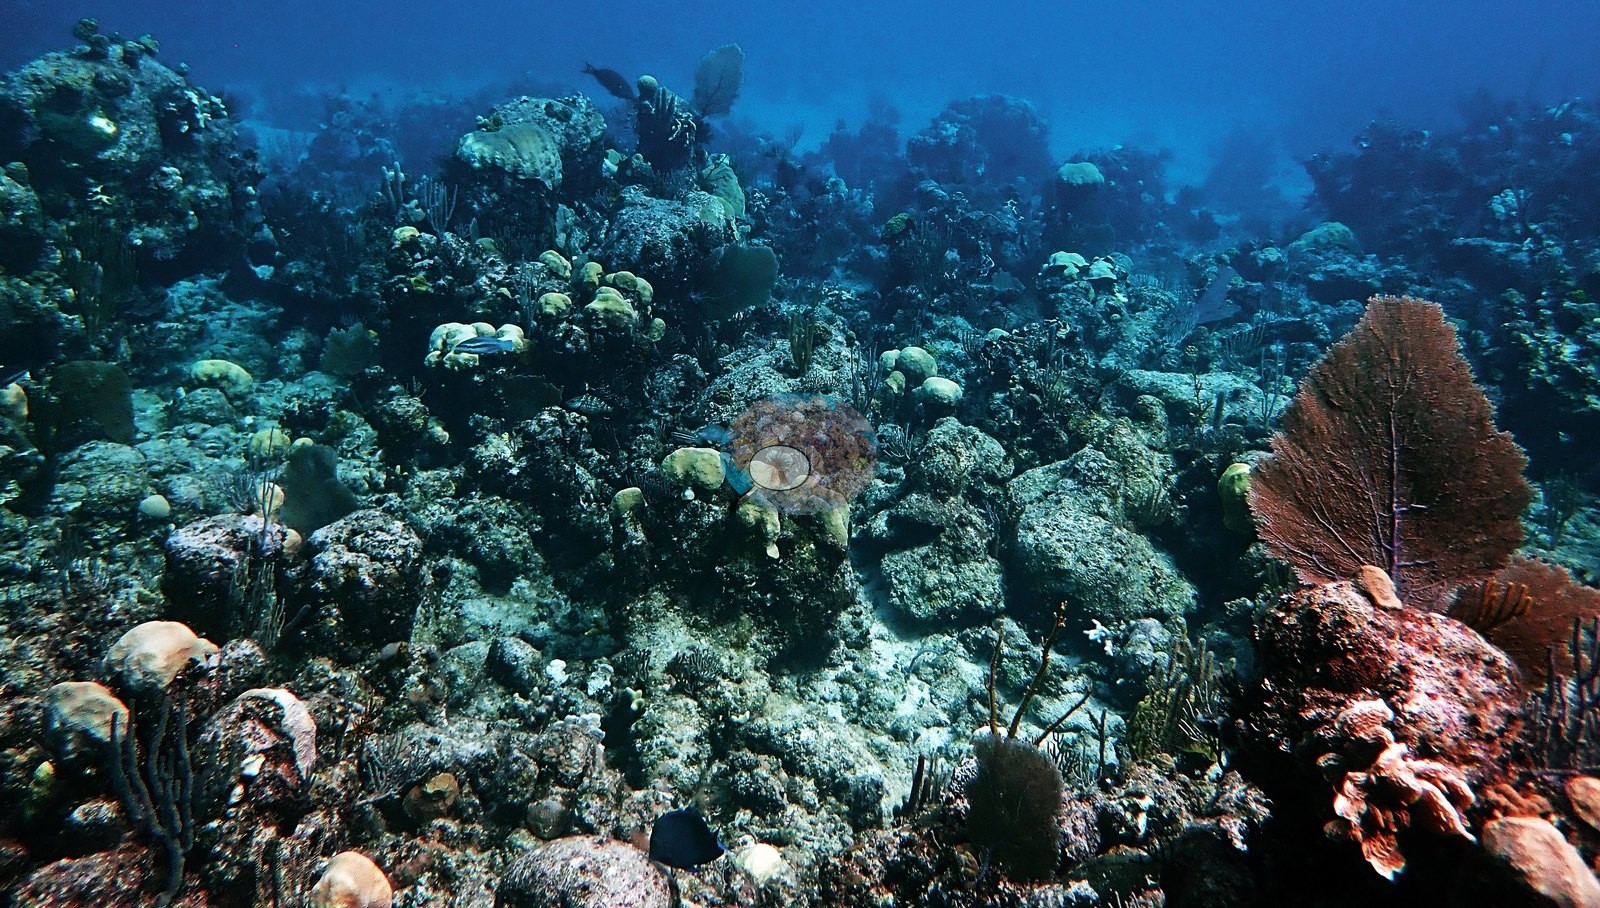
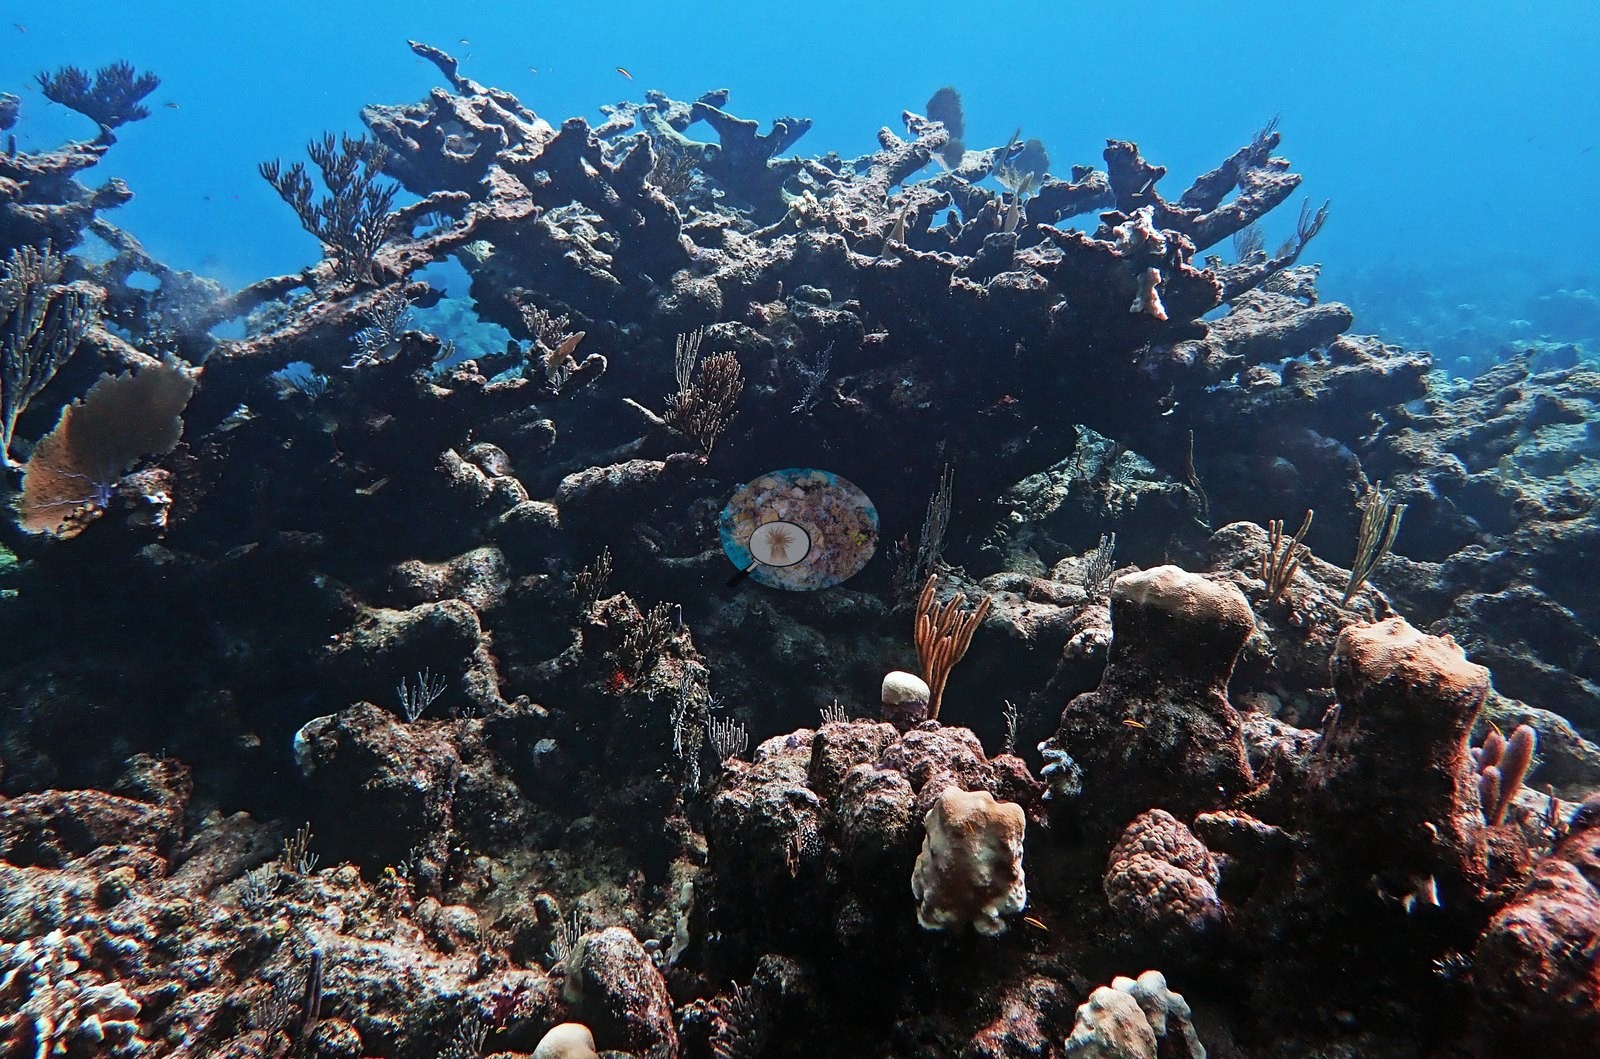
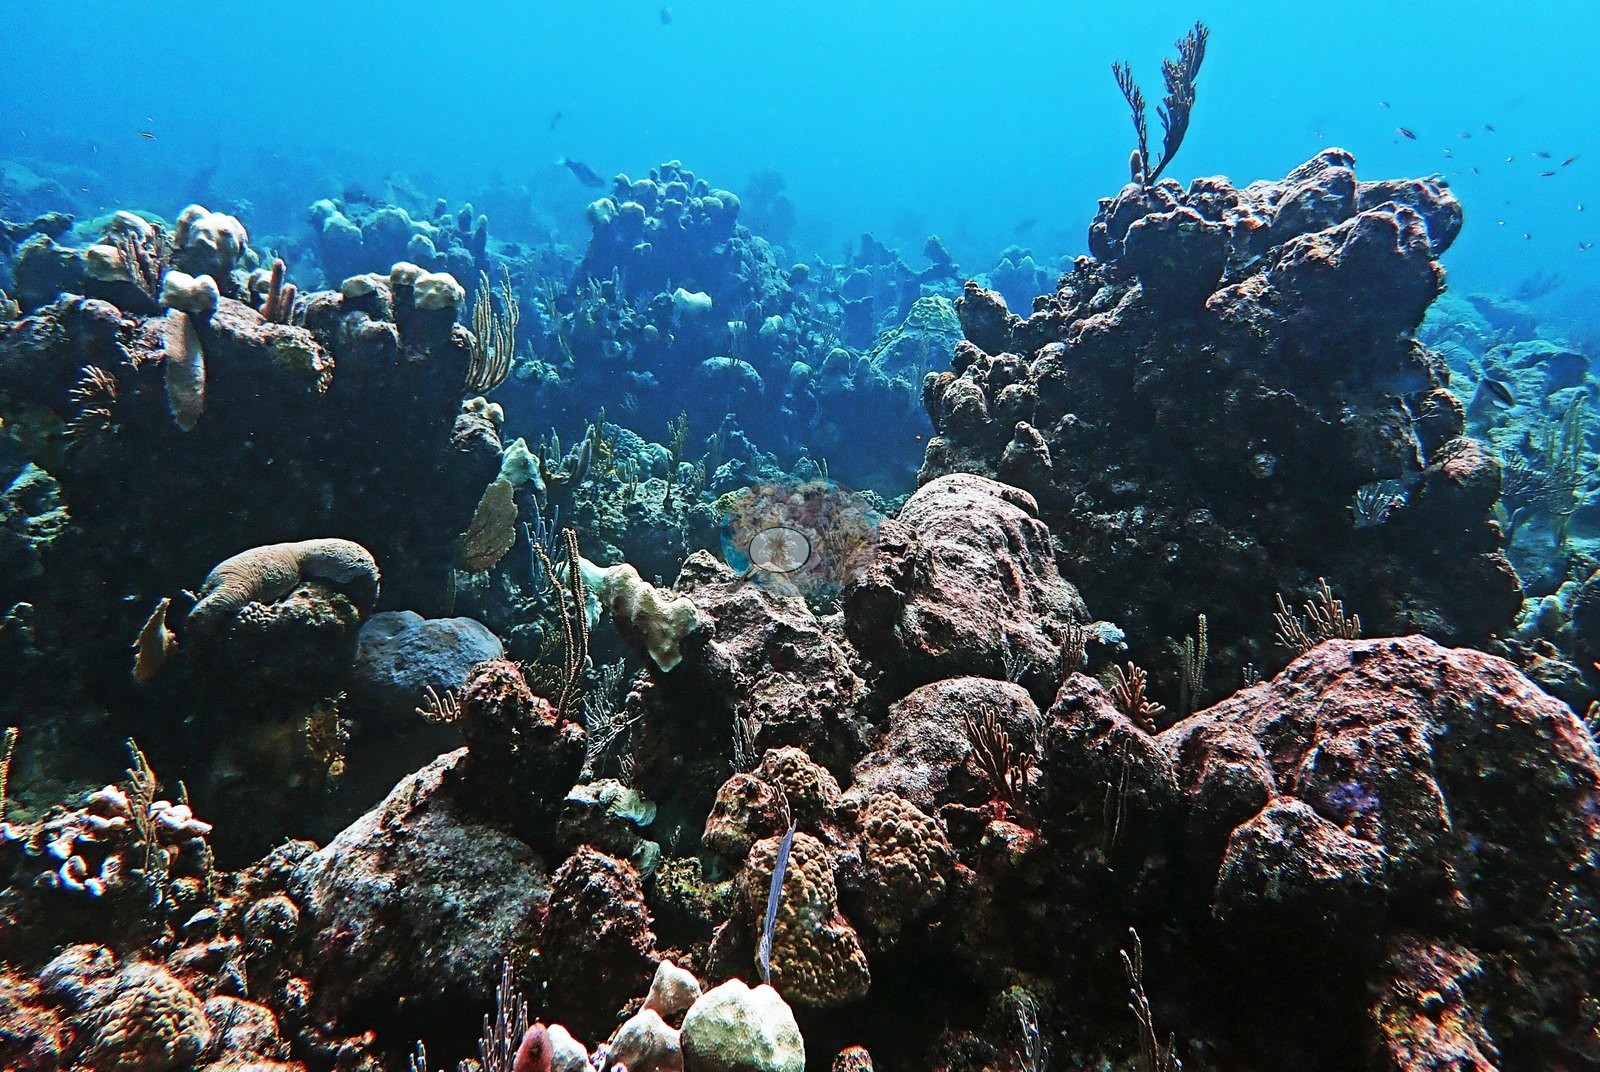
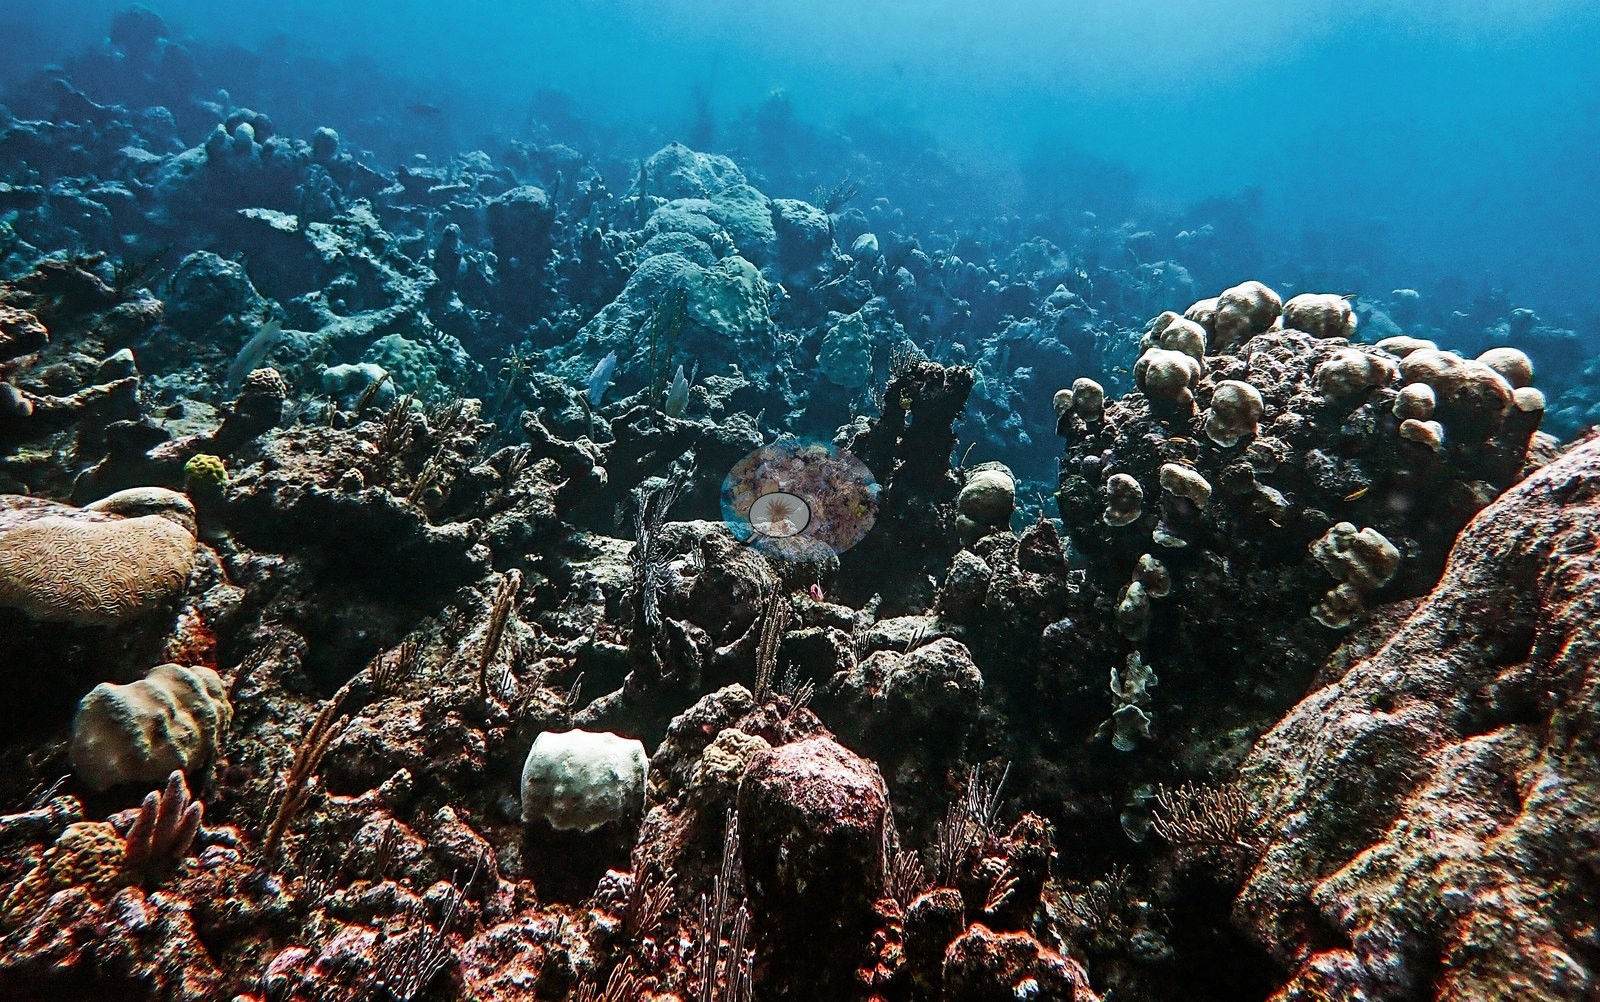
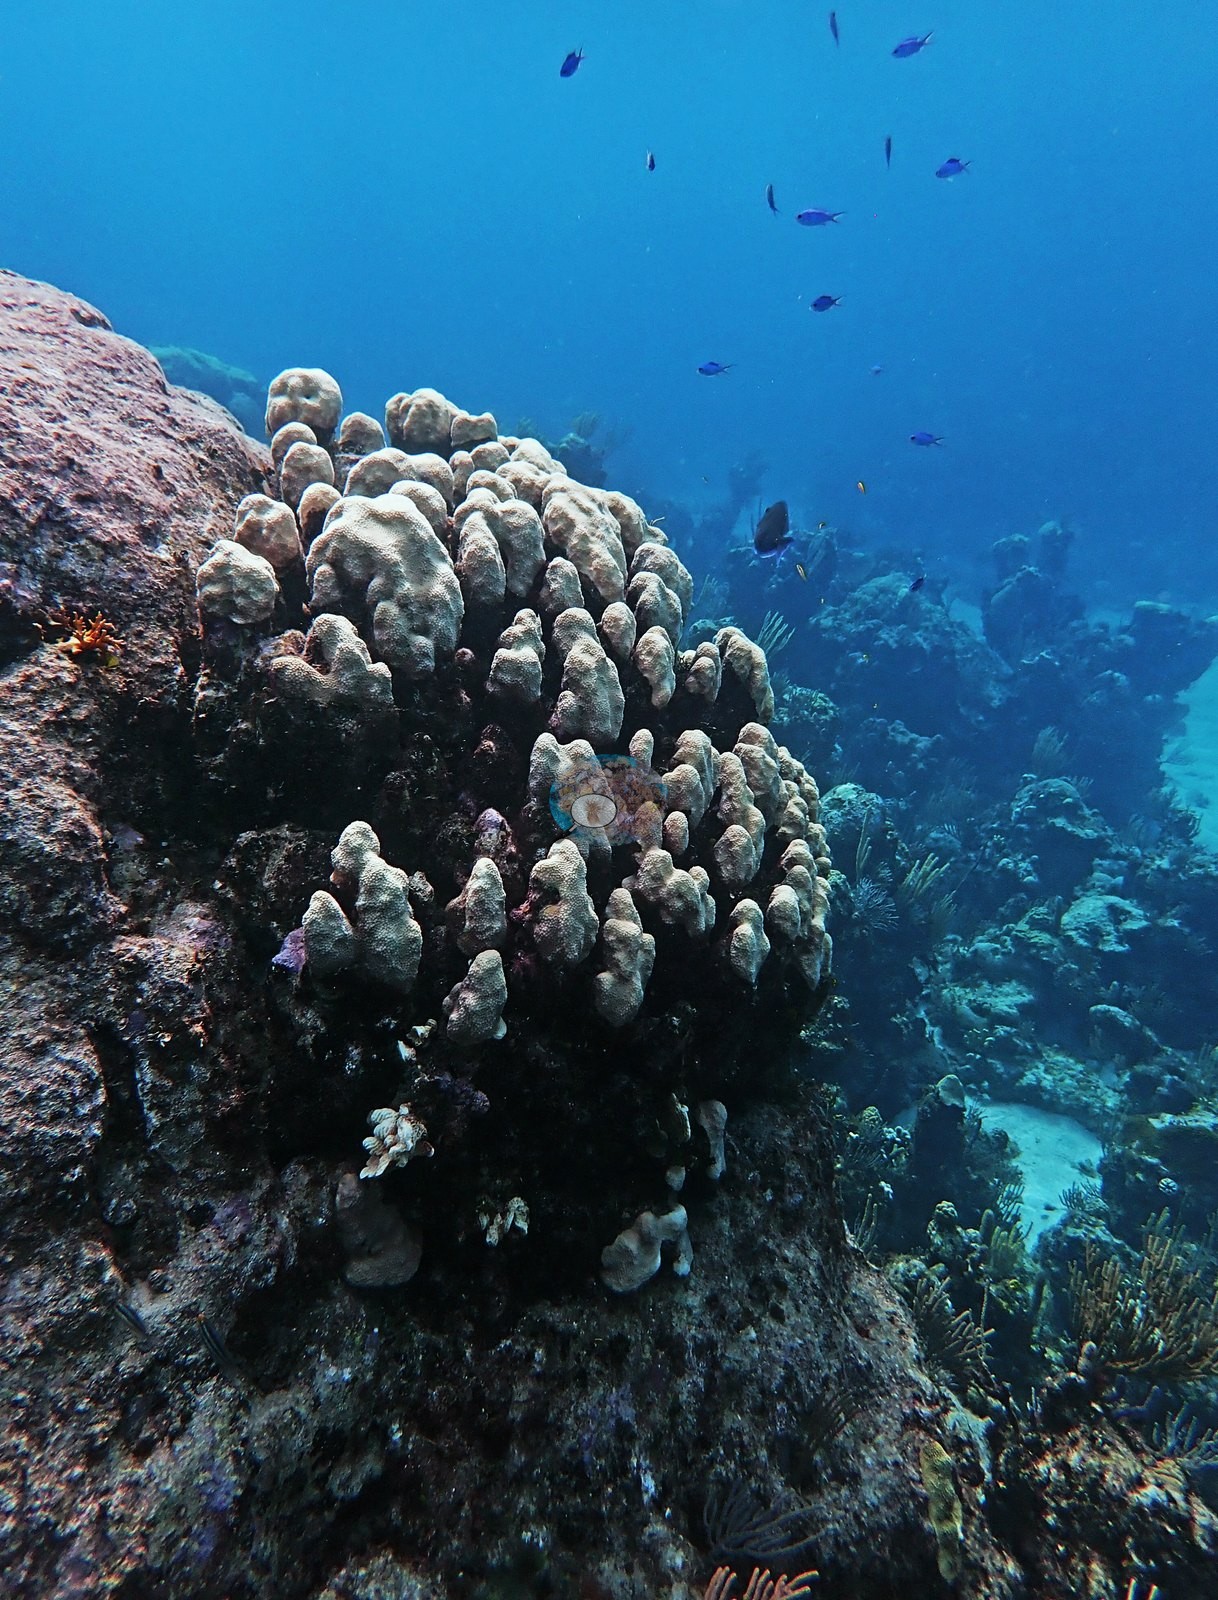
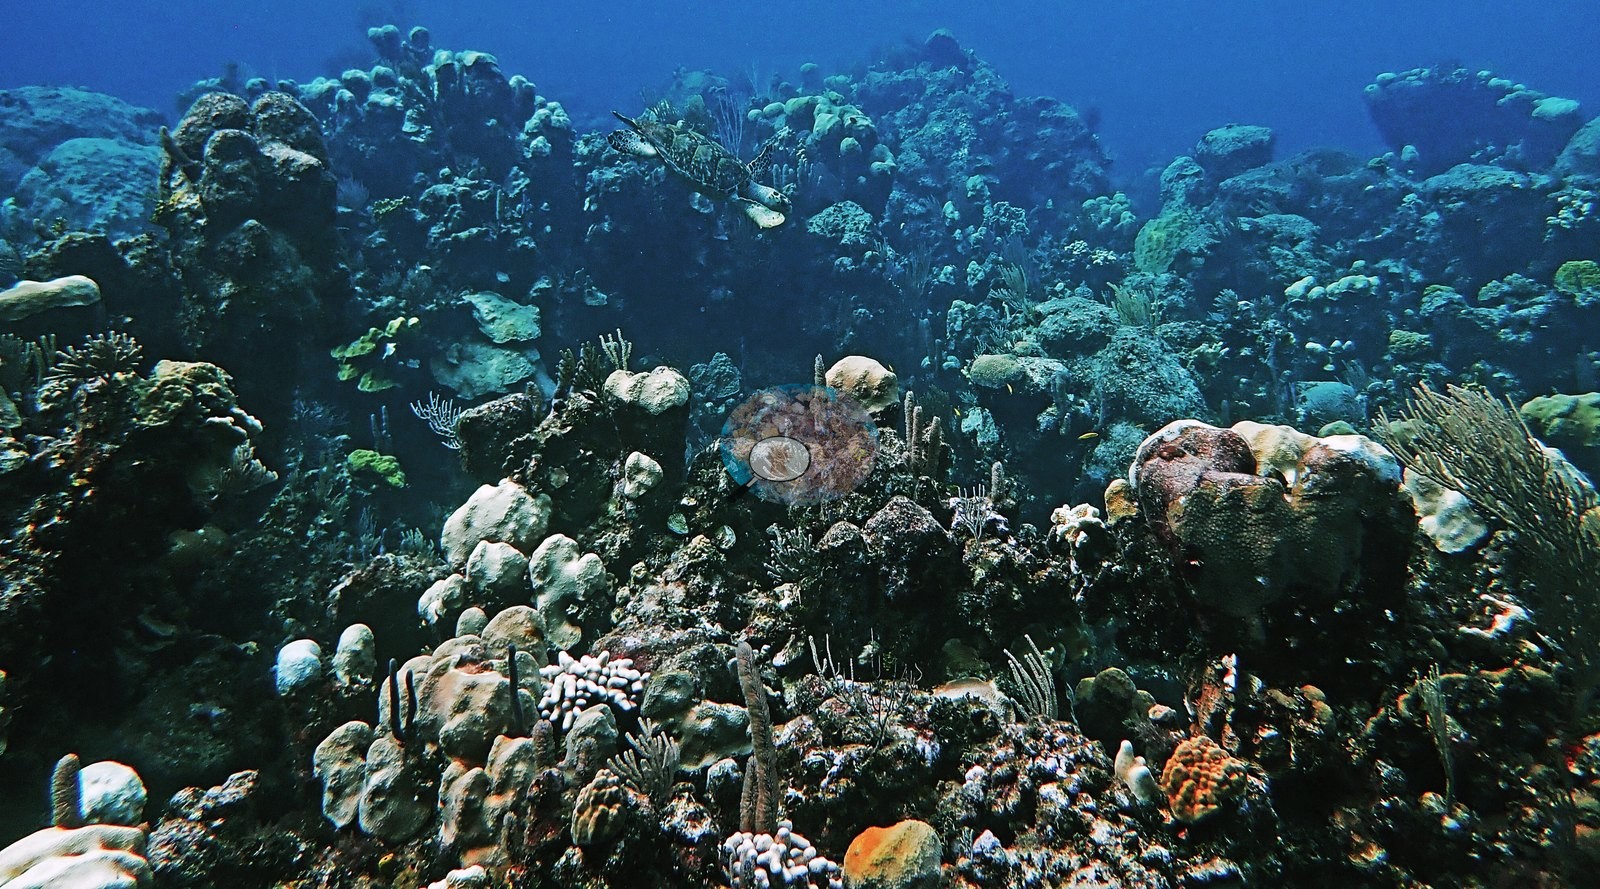
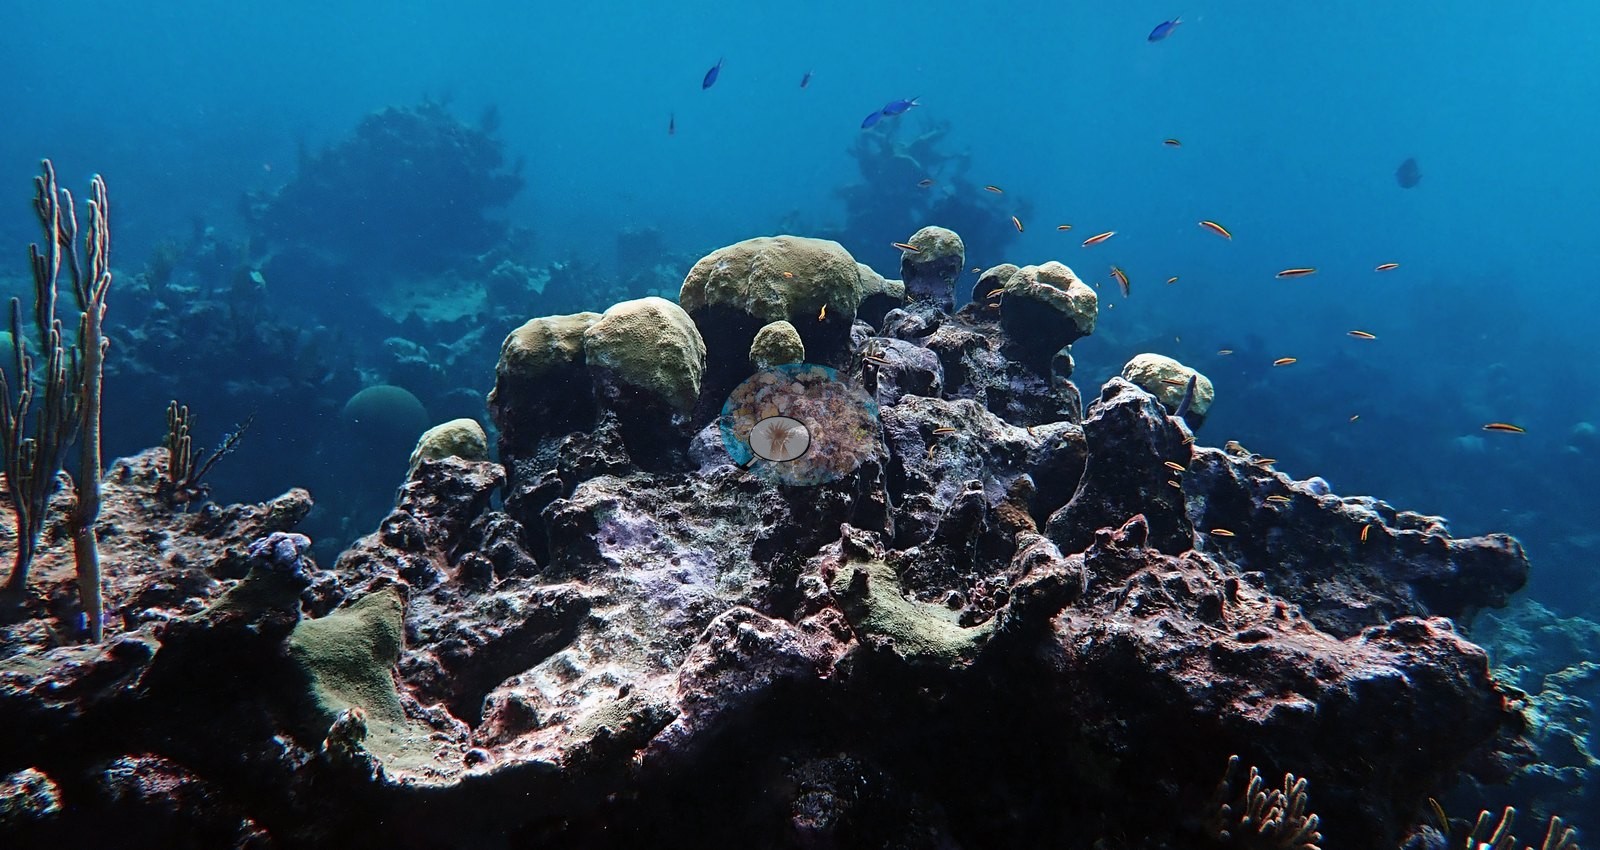
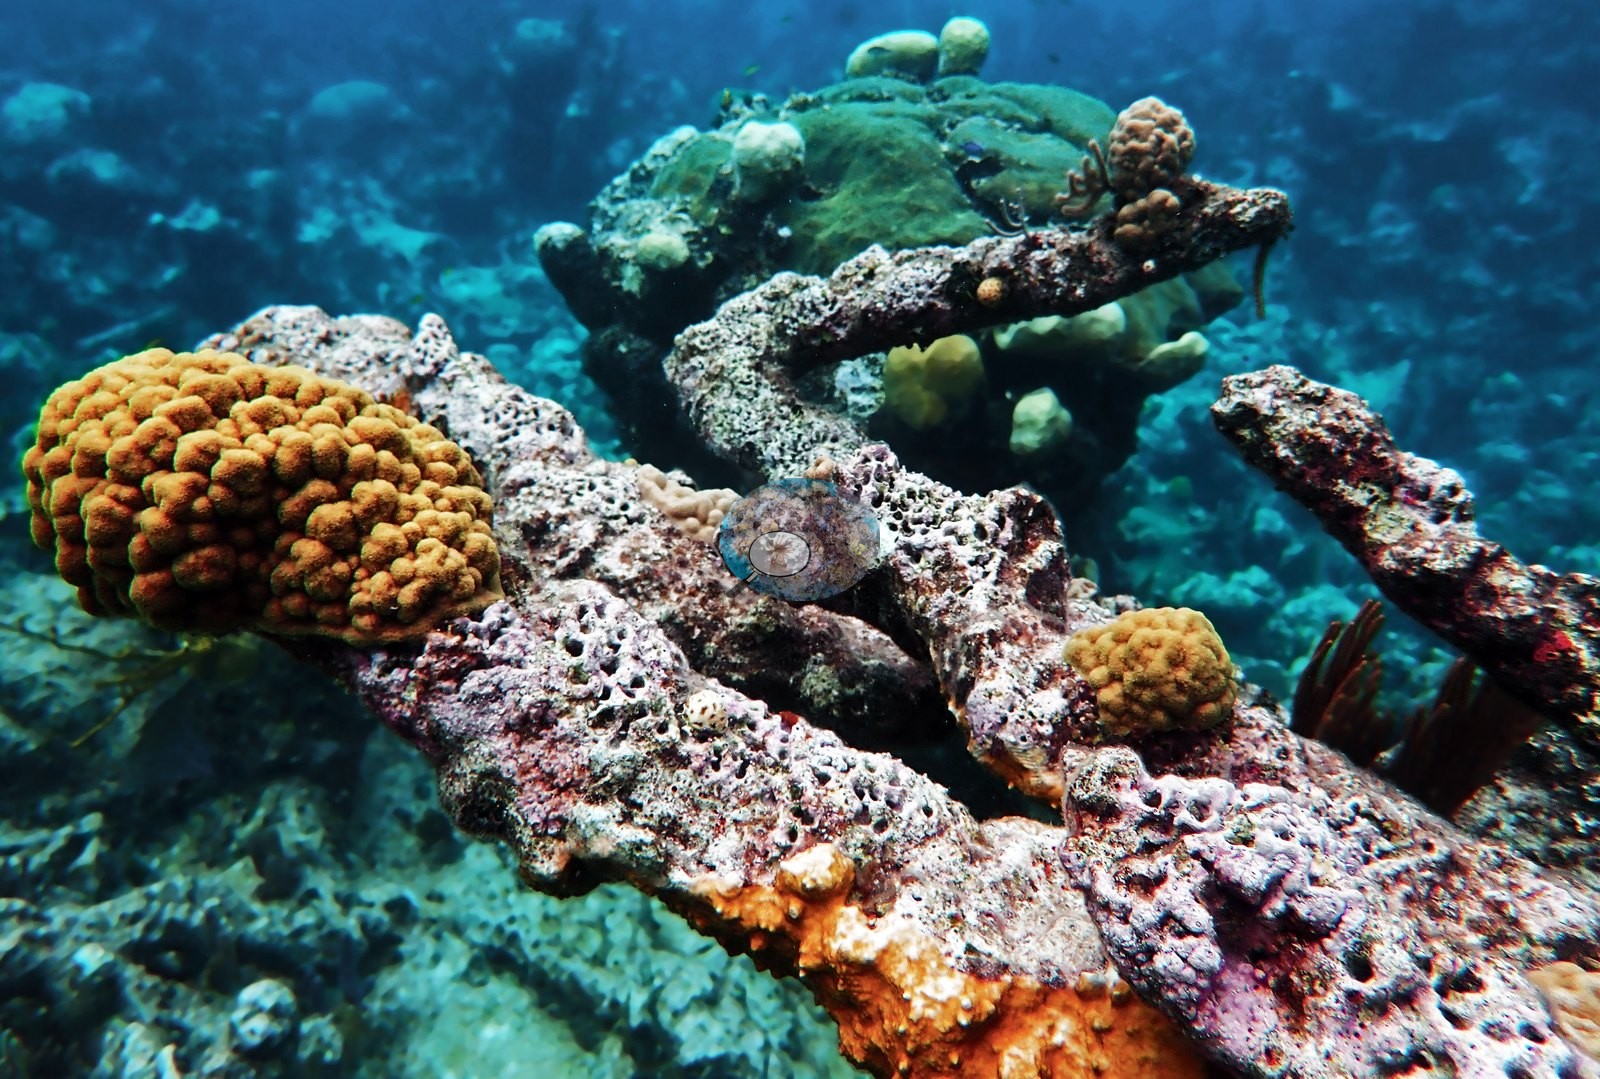
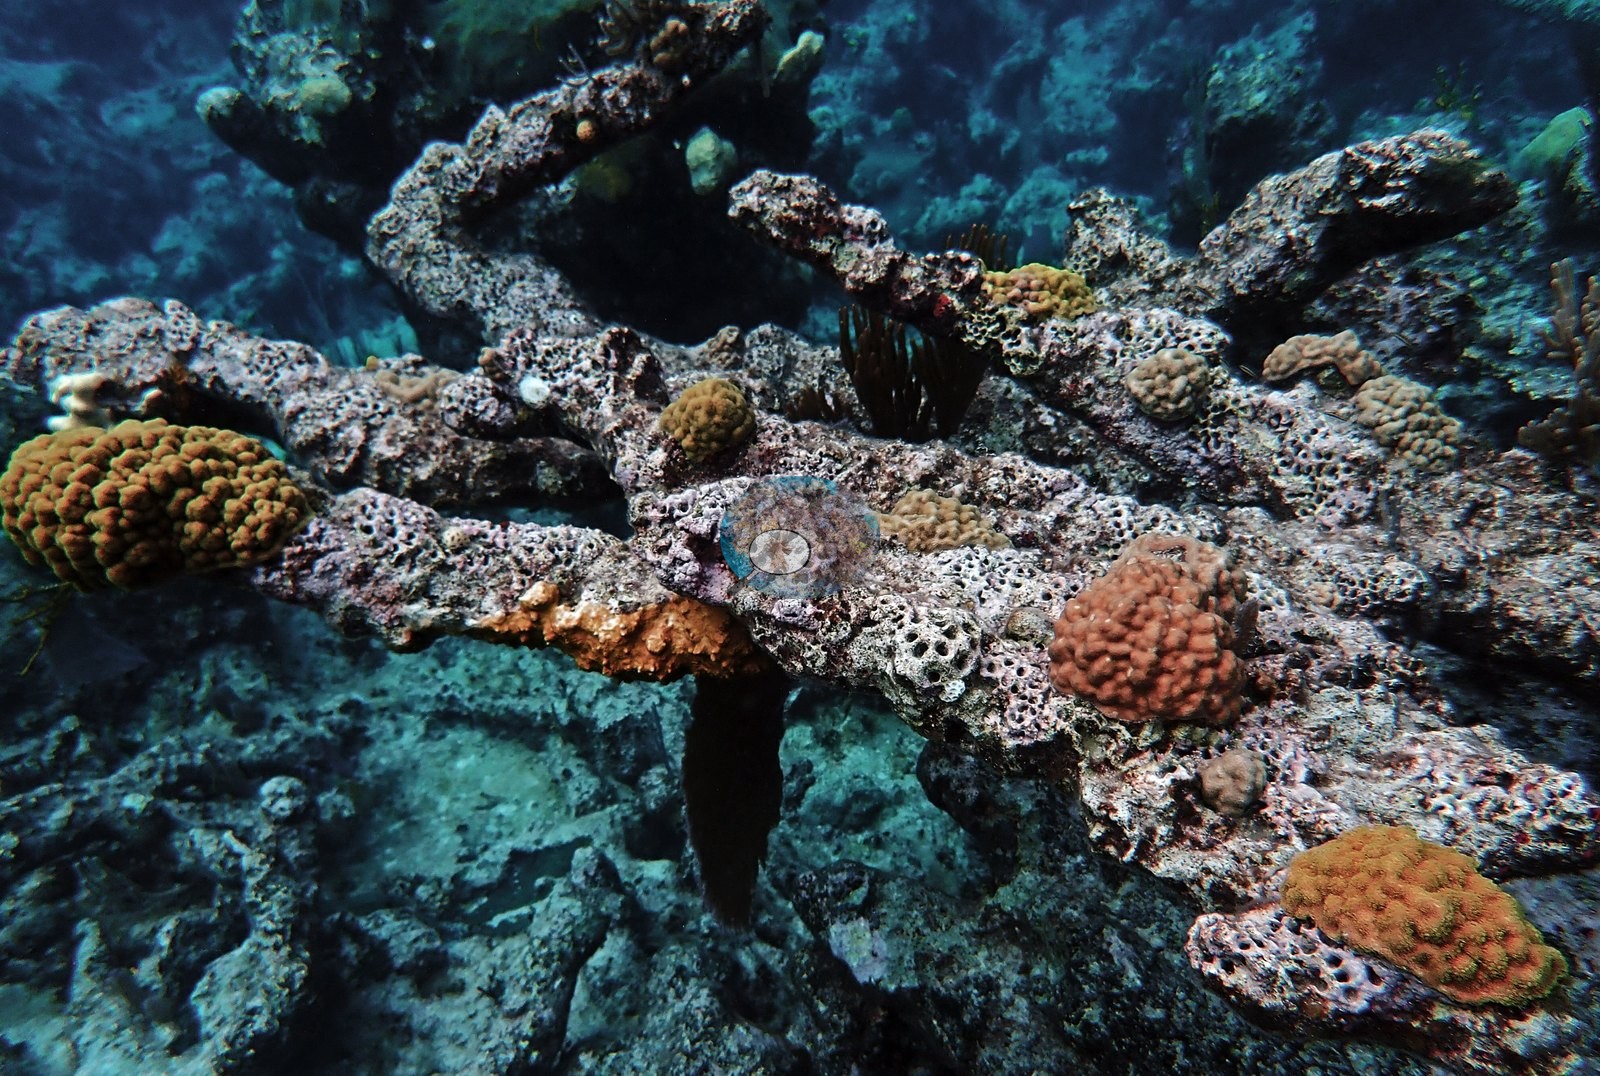
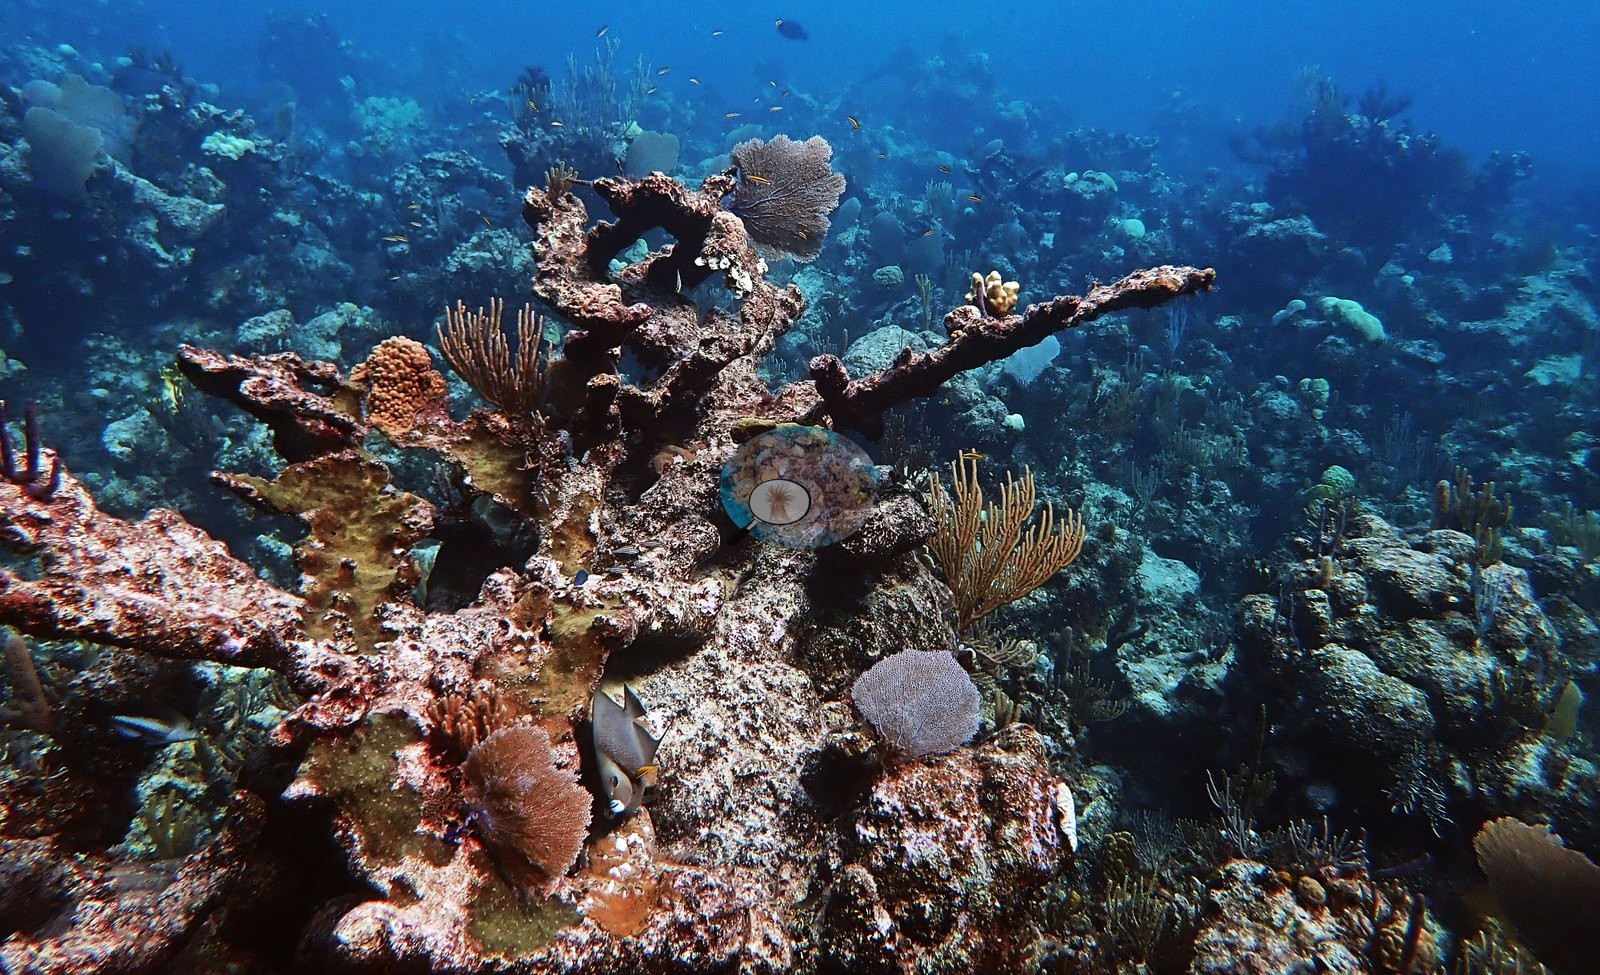
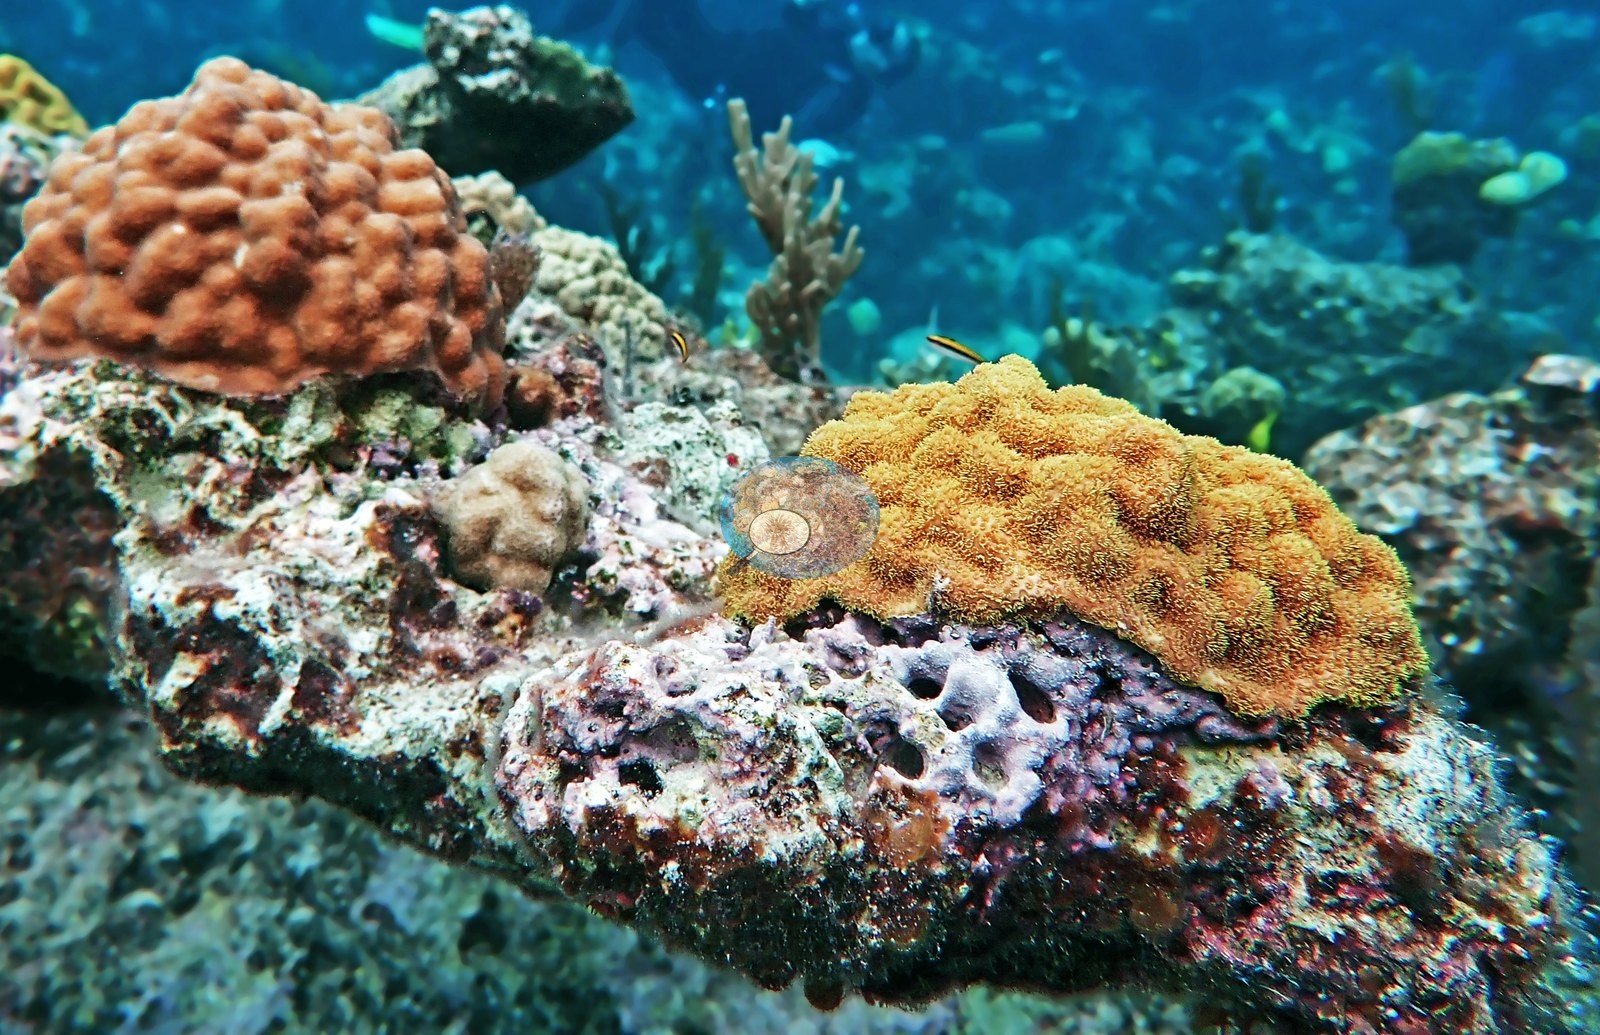
Where recruits have taken hold on that framework they are mostly small mustard-to-orange mounding colonies with coarse, widely spaced corallites (Montastraea cavernosa-type), sitting like buttons along the dead branches (e.g., Image 105, Image 106, Image 107, Image 108).
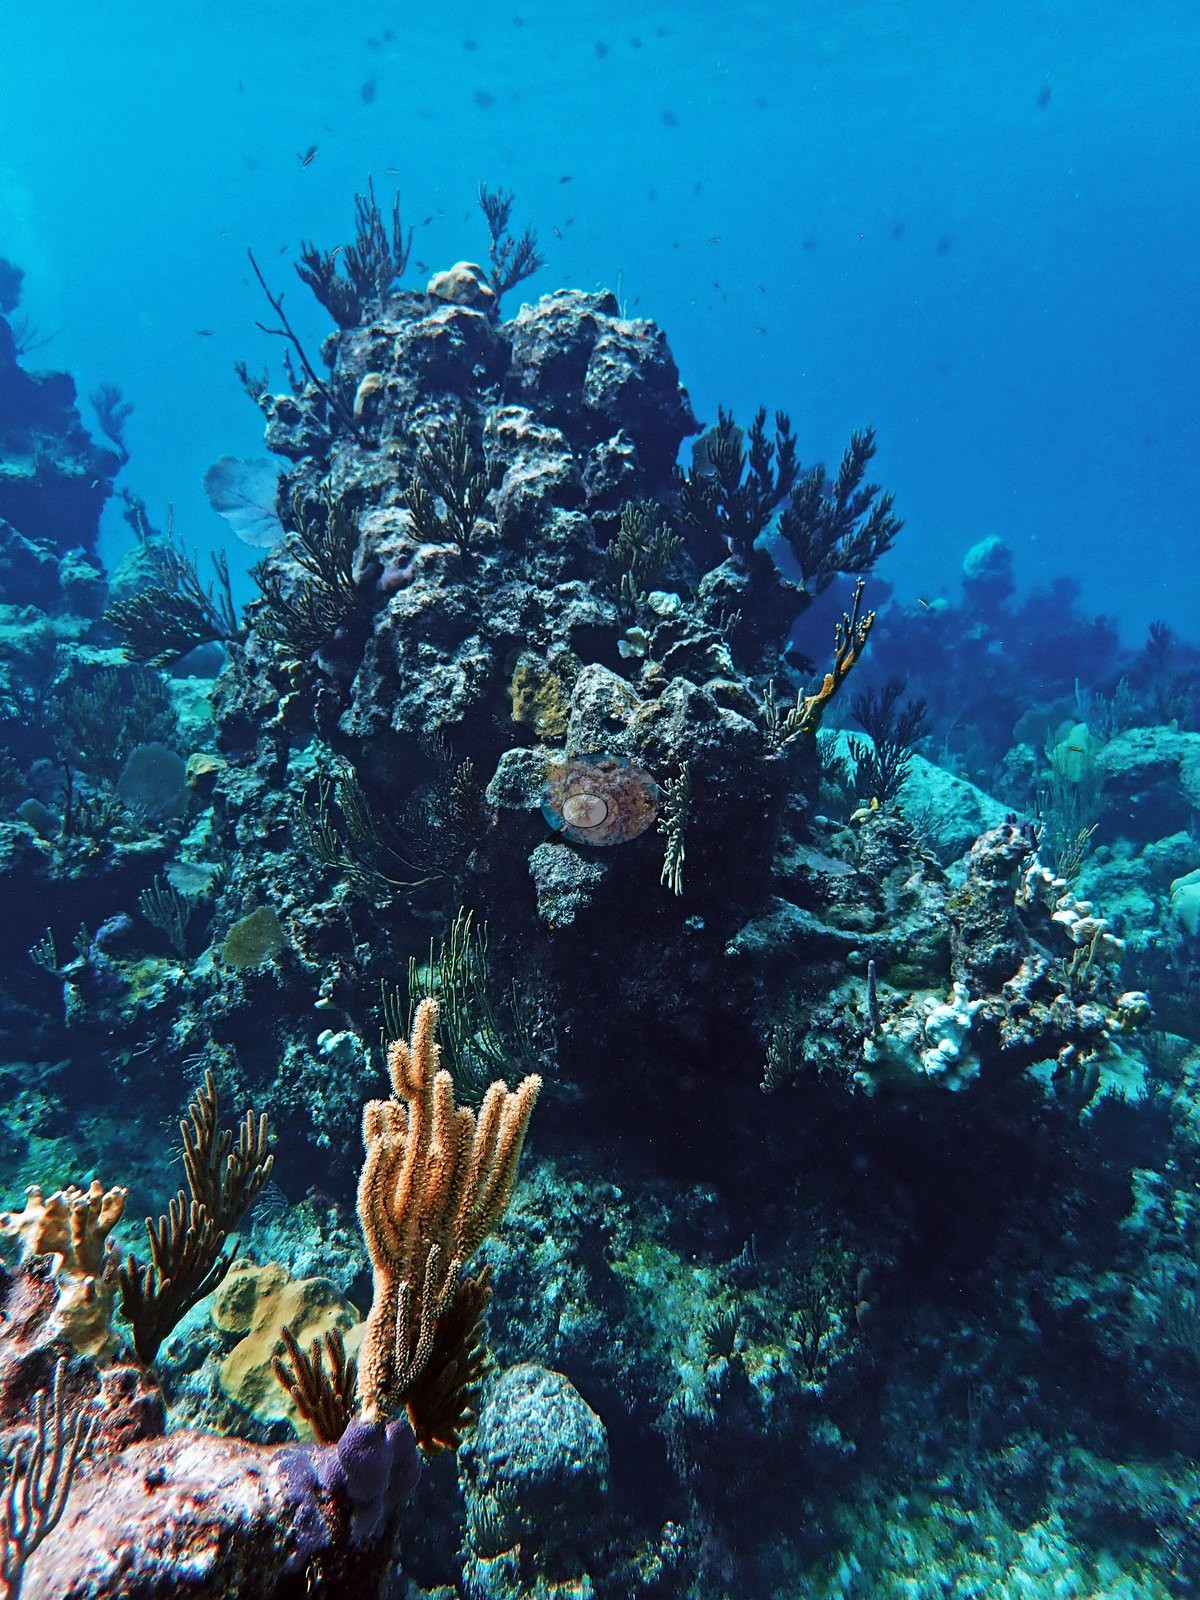
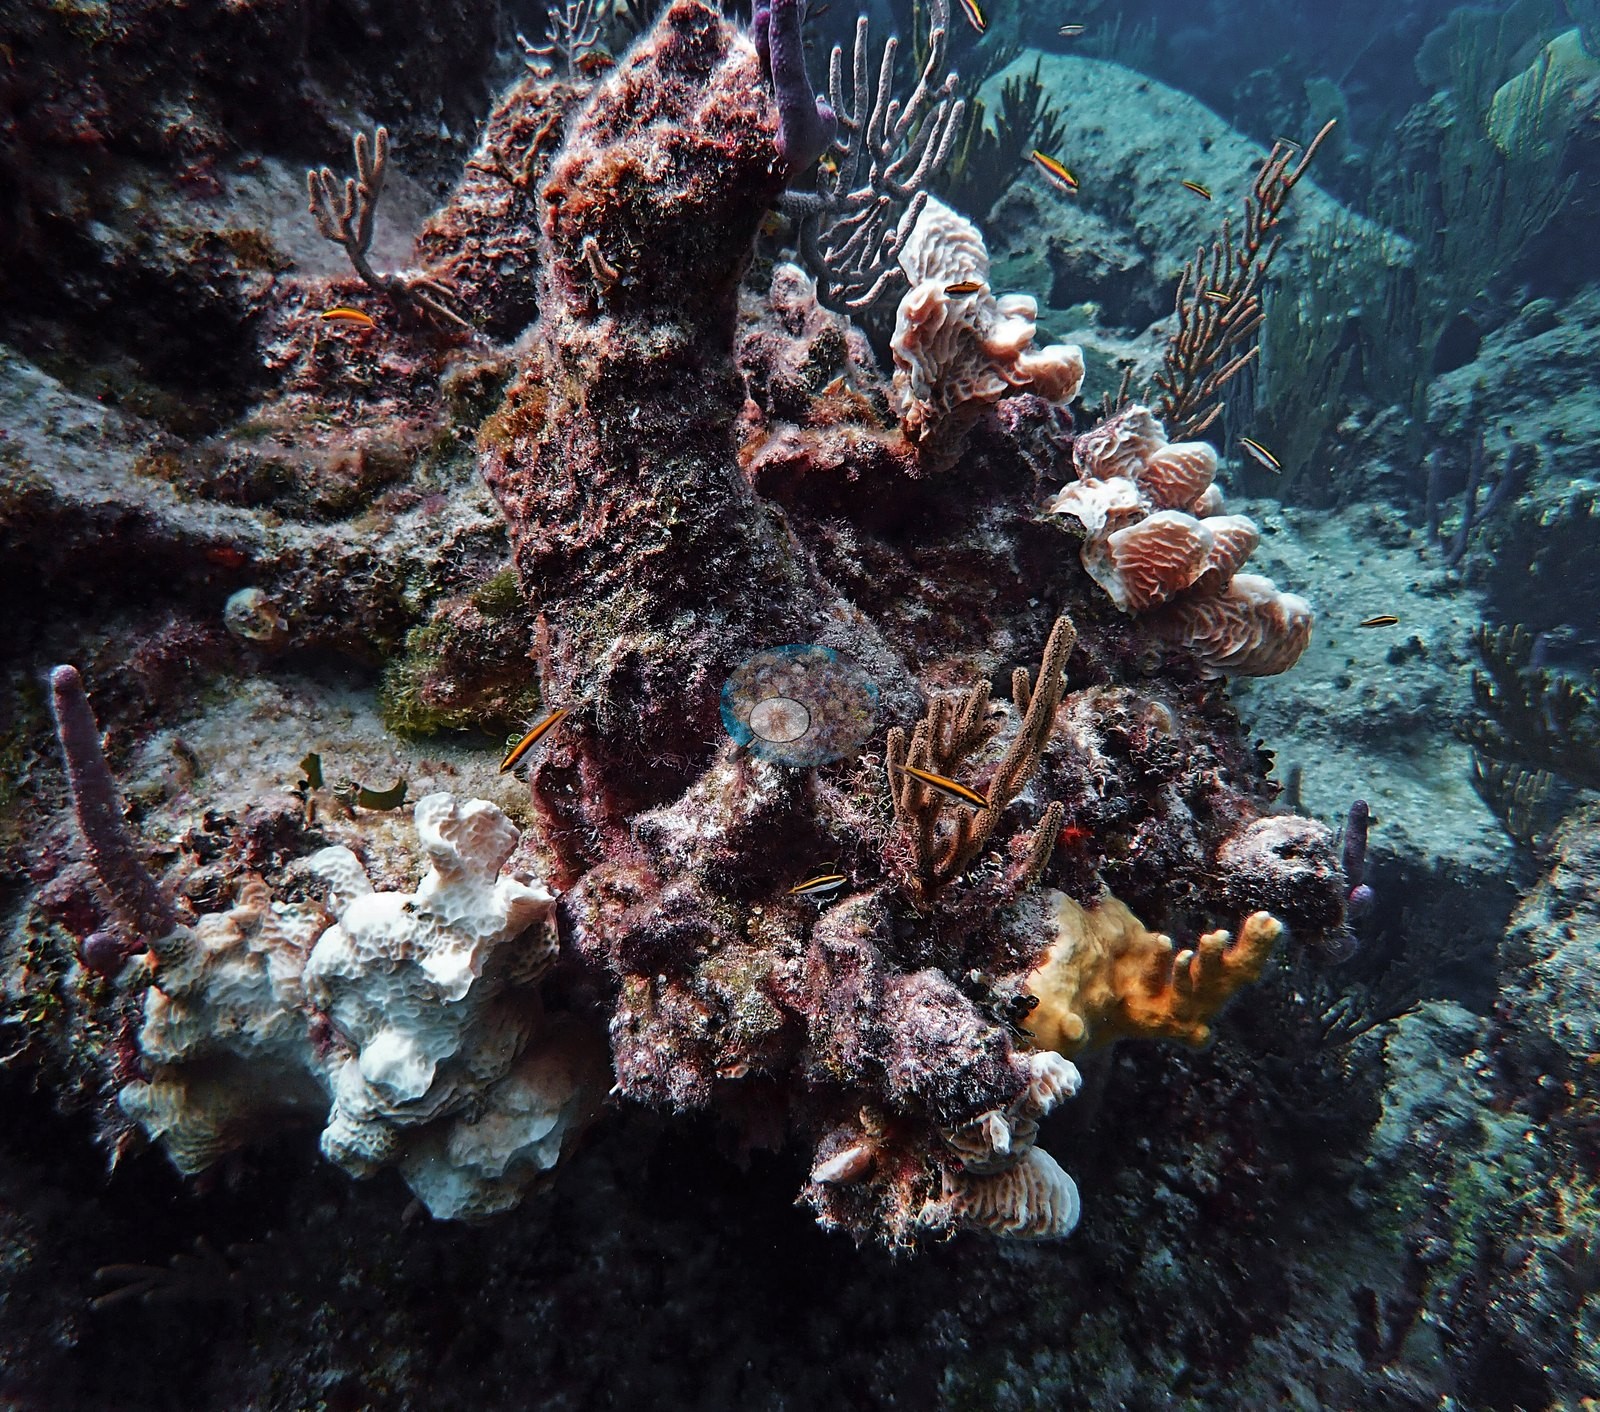
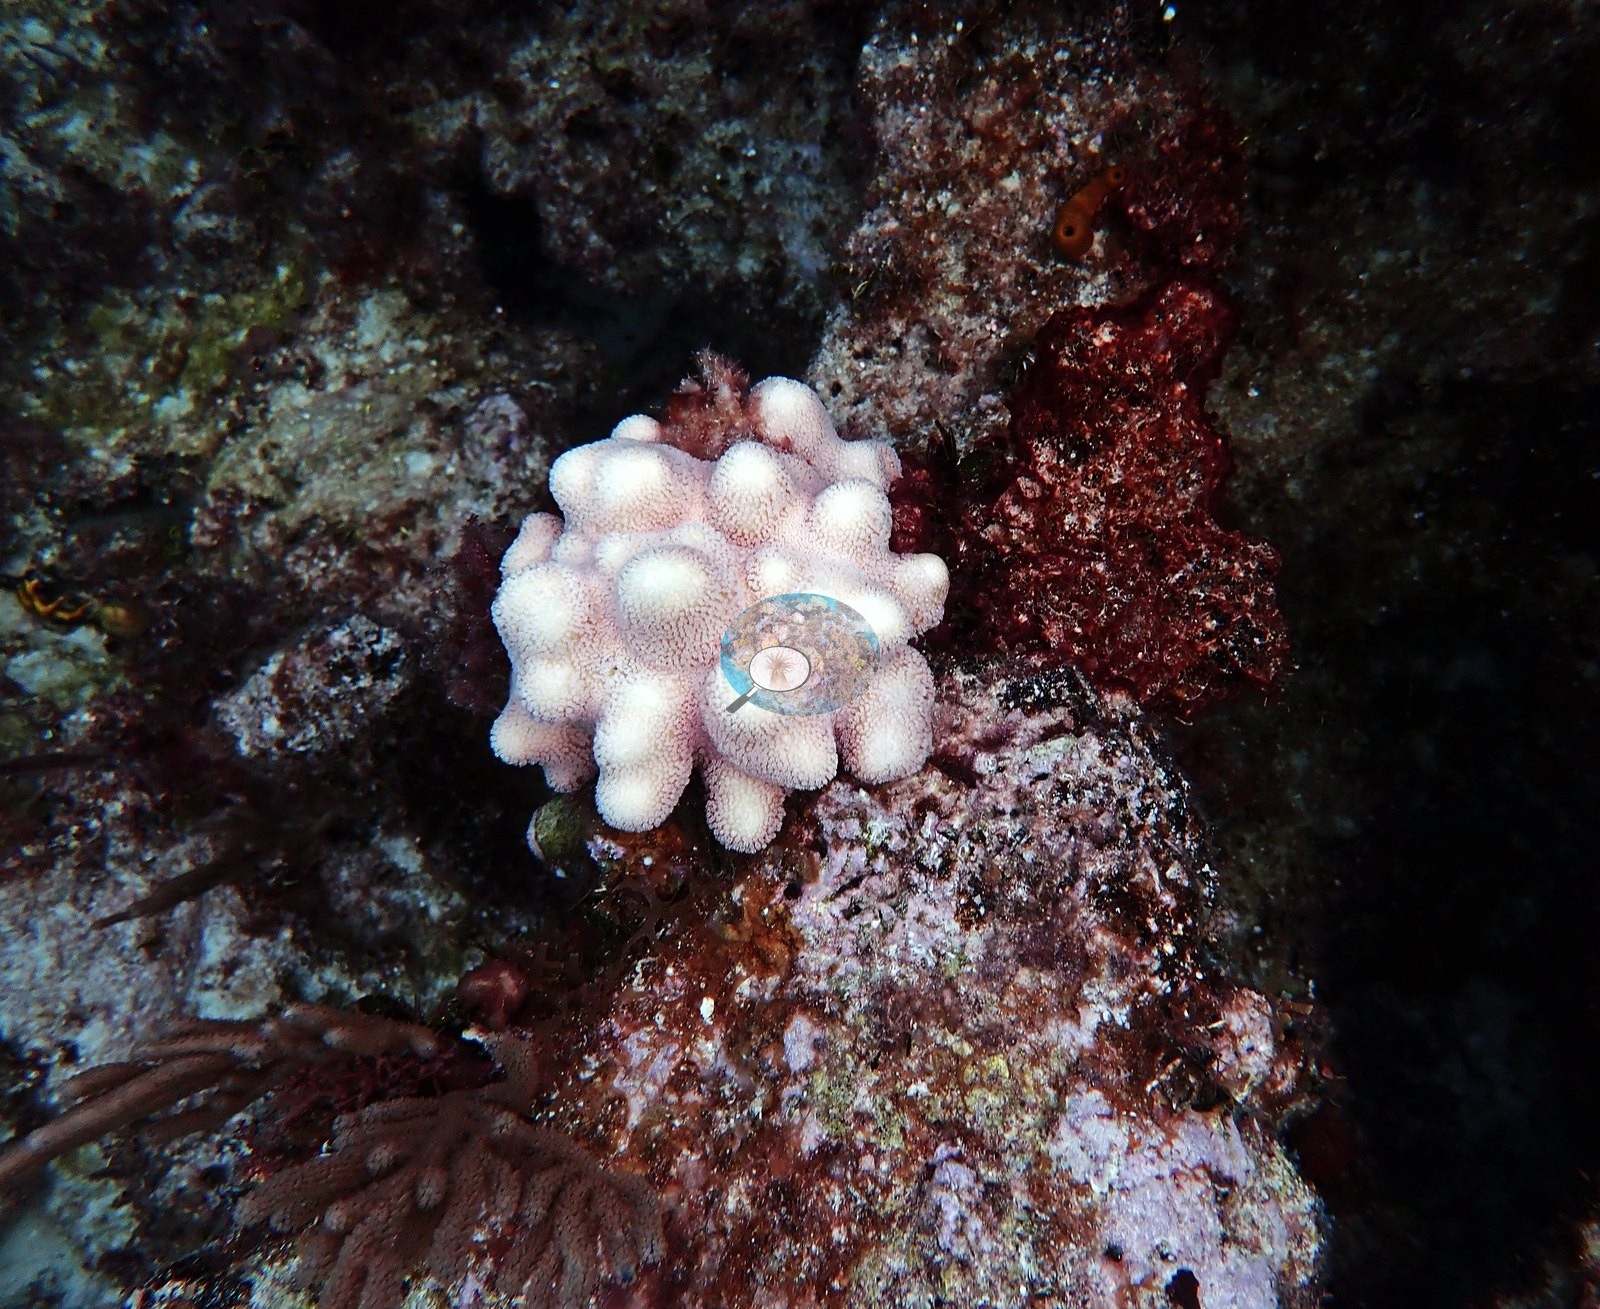
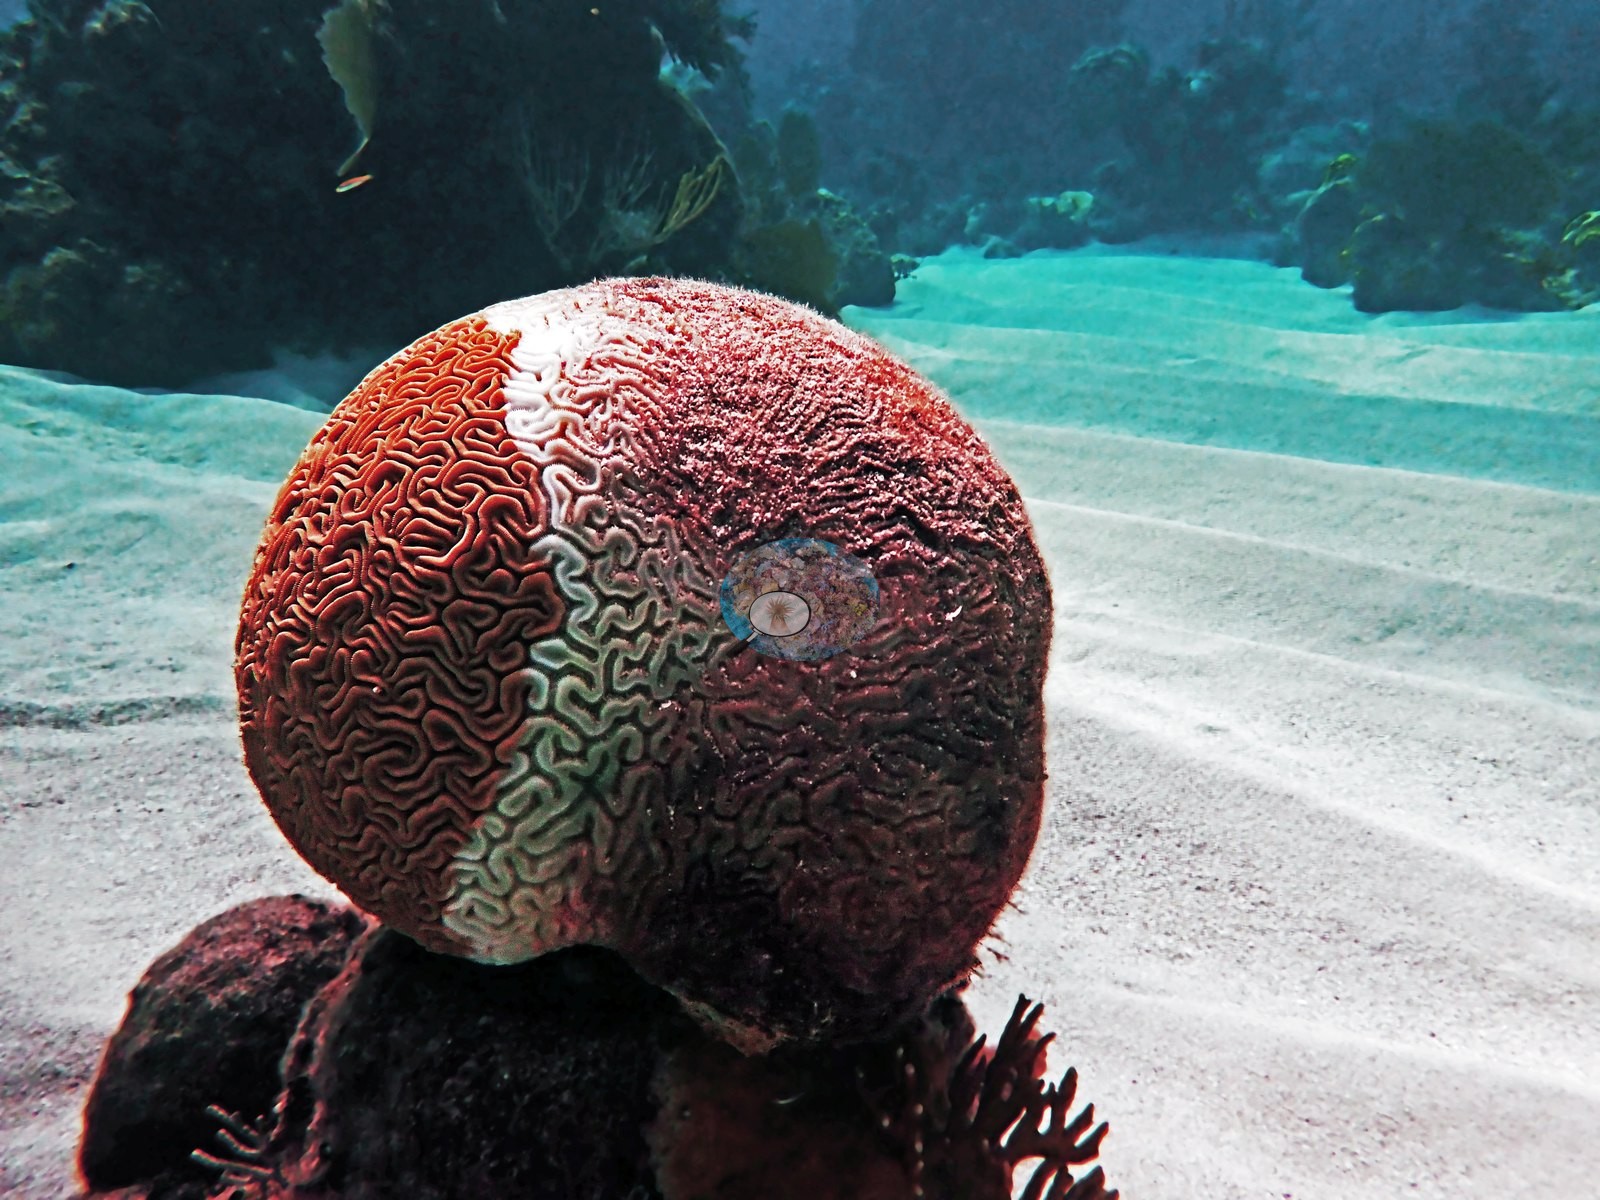
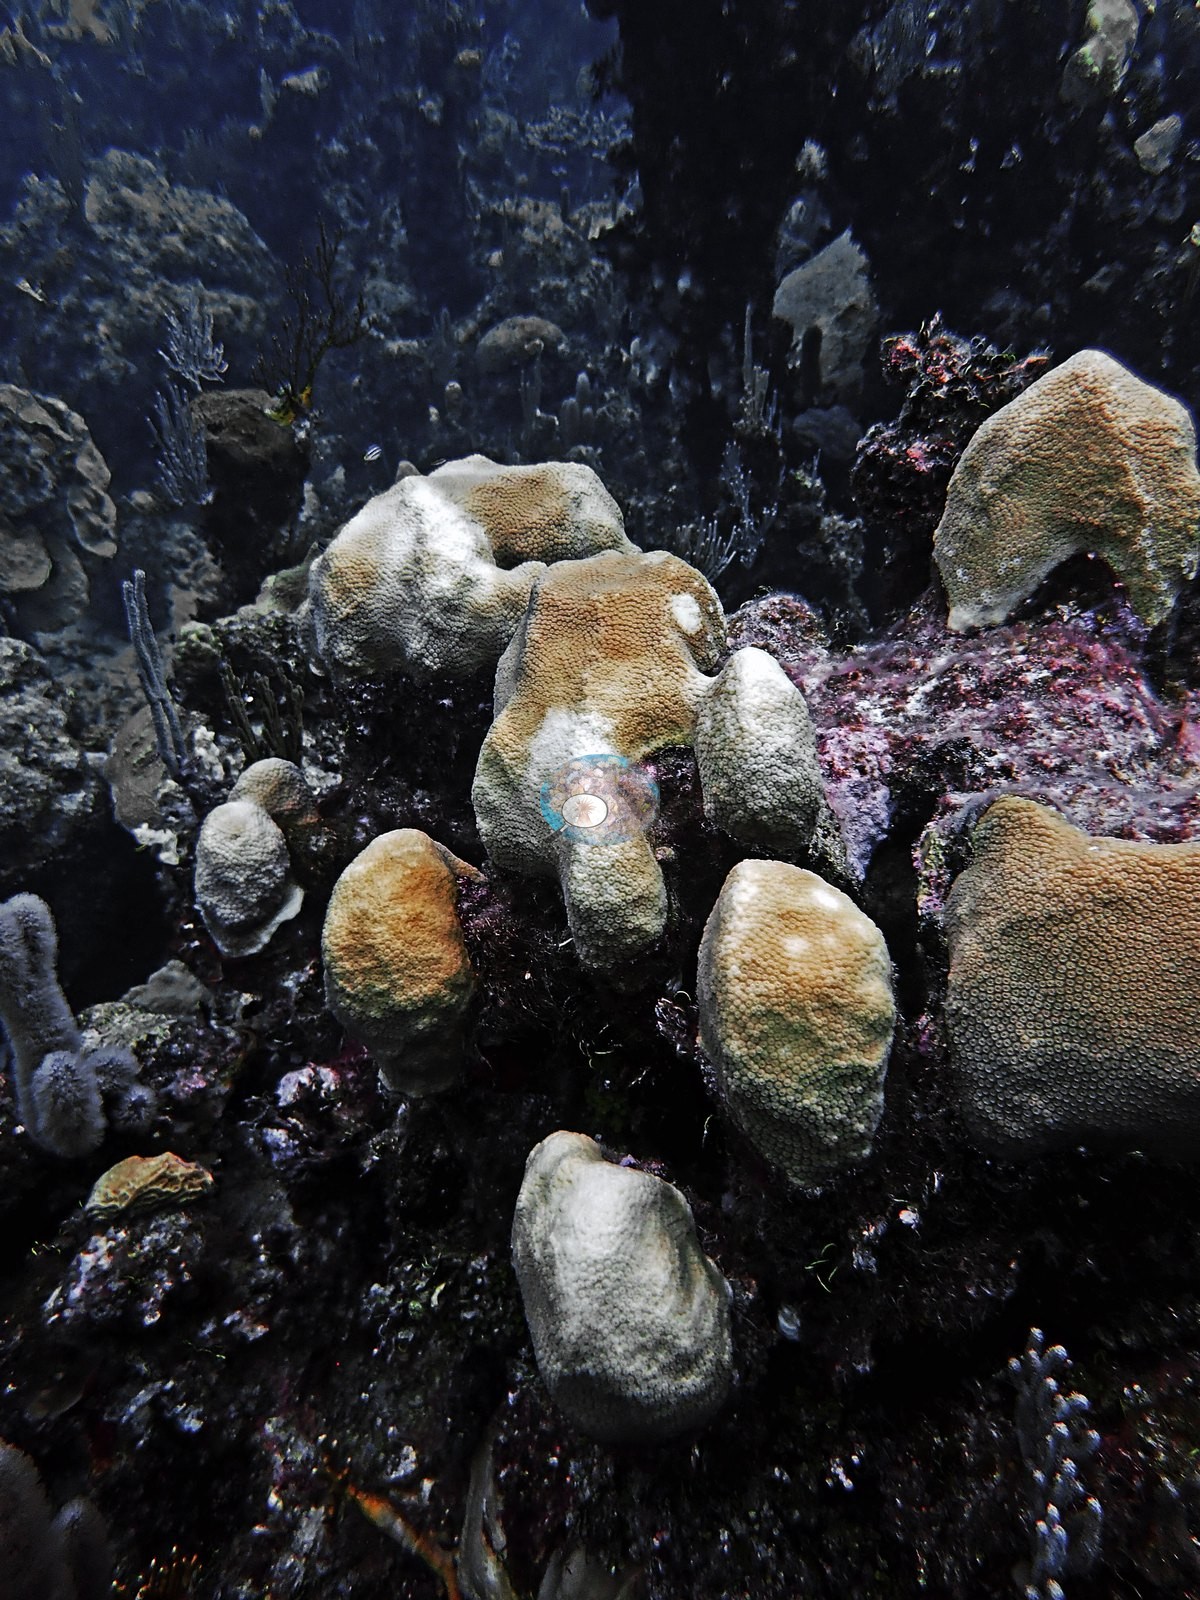
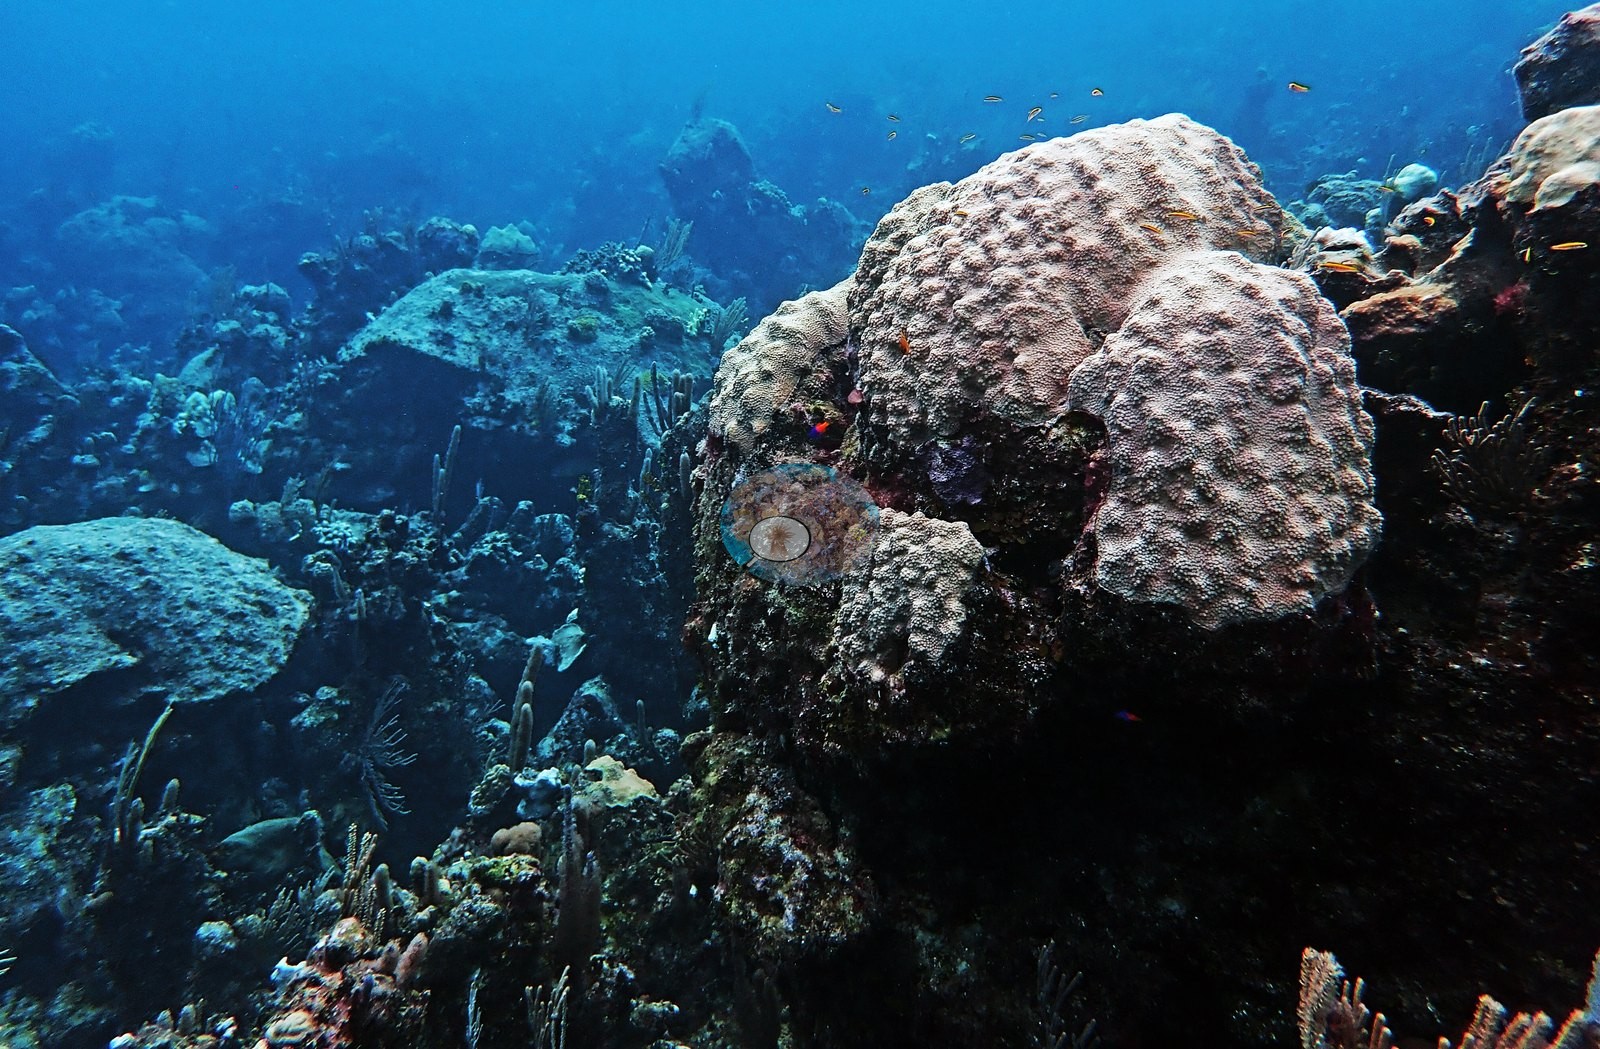
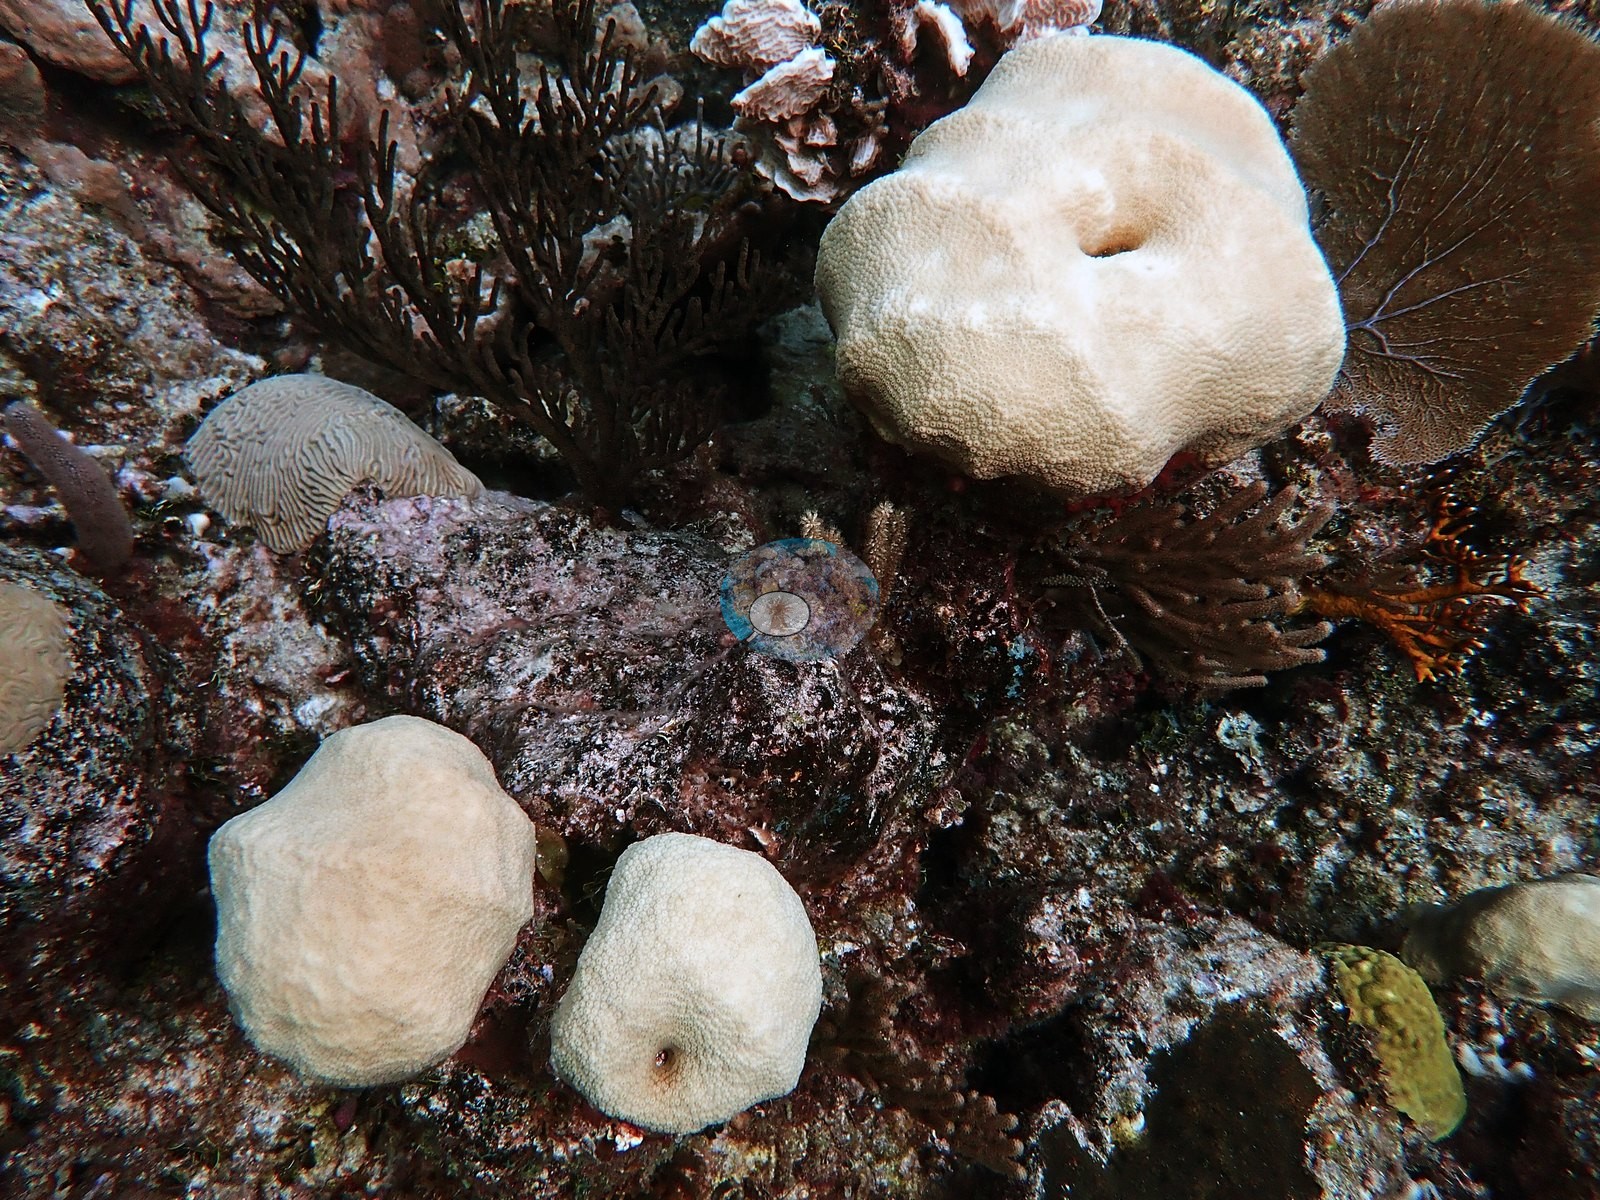
Living cover away from the framework is real but patchy and dominated by massives. Brain corals are the most consistent living element - grooved and meandering-valley colonies from dinner-plate to half-meter size, some in good condition with sharp ridges (e.g., Image 10, Image 35, Image 37, Image 43, Image 67, Image 97) - together with lobed and knobby Orbicella-type heads (e.g., Image 3, Image 28, Image 87, Image 89), low mounding heads and encrusting patches on the crusted rock (e.g., Image 22, Image 24, Image 52, Image 71, Image 82, Image 84, Image 87, Image 88), and small branching finger colonies (e.g., Image 8, Image 33, Image 114).
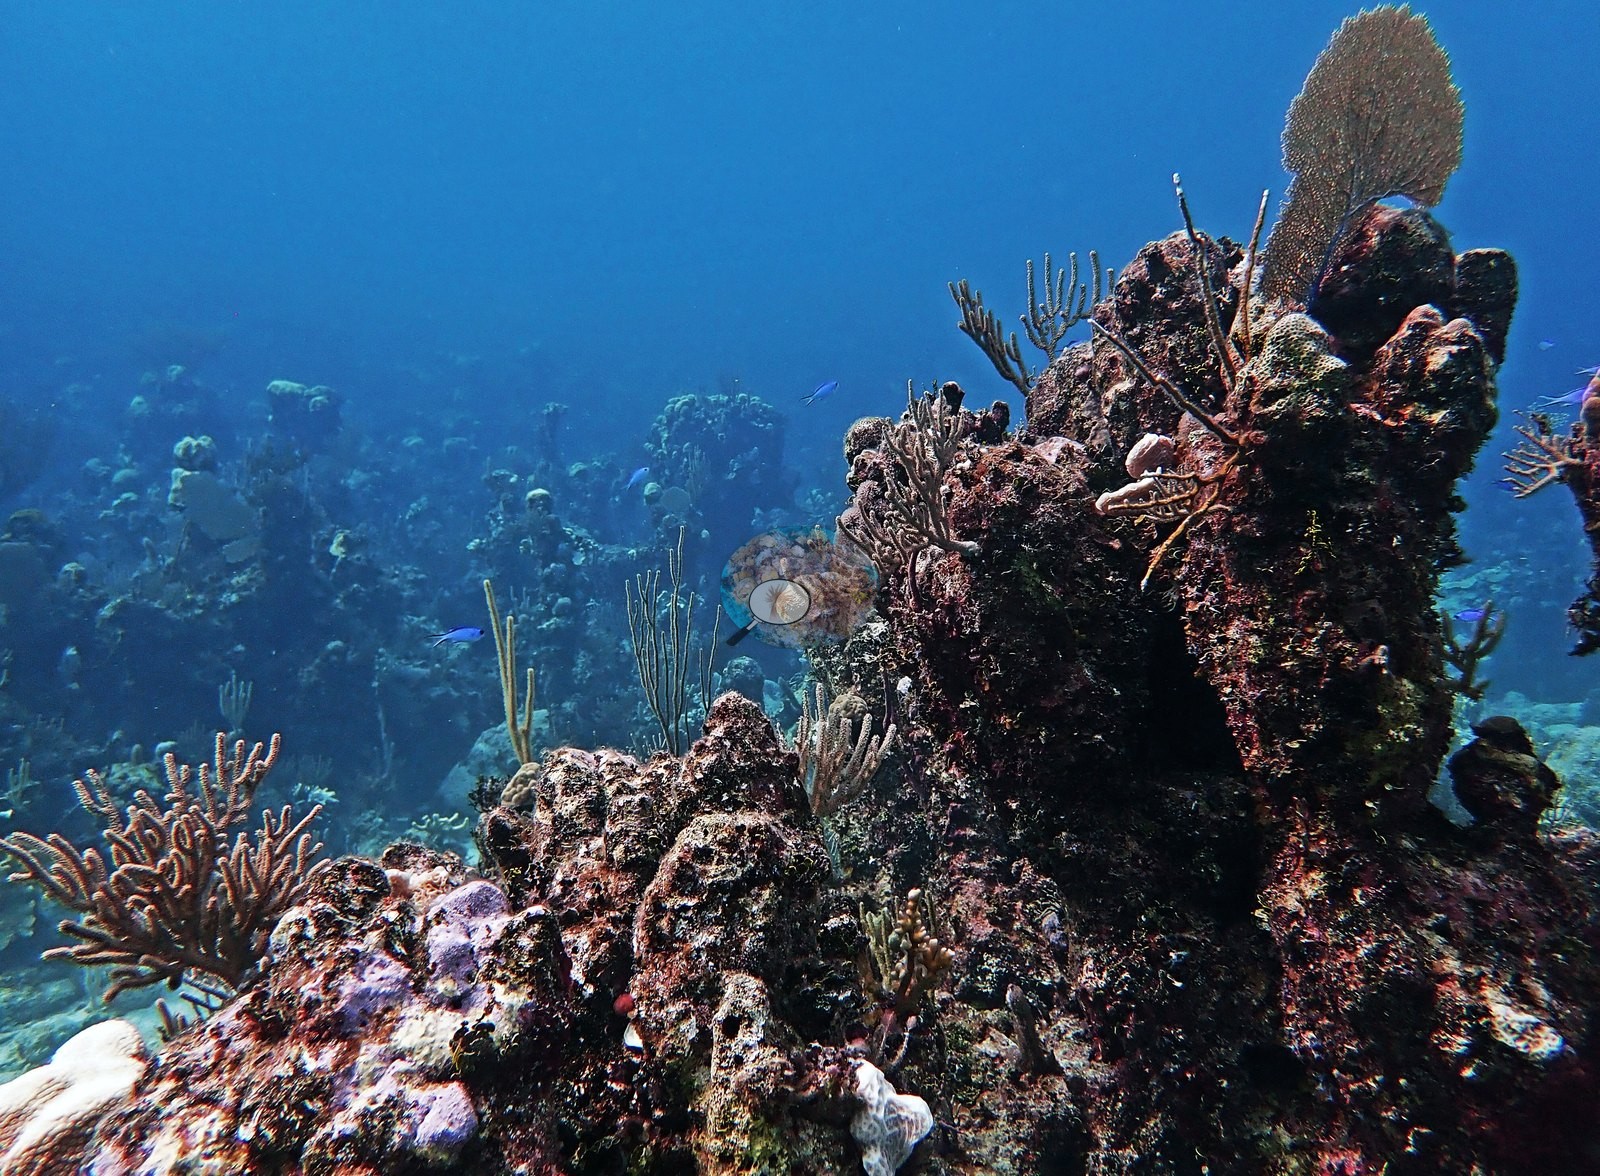
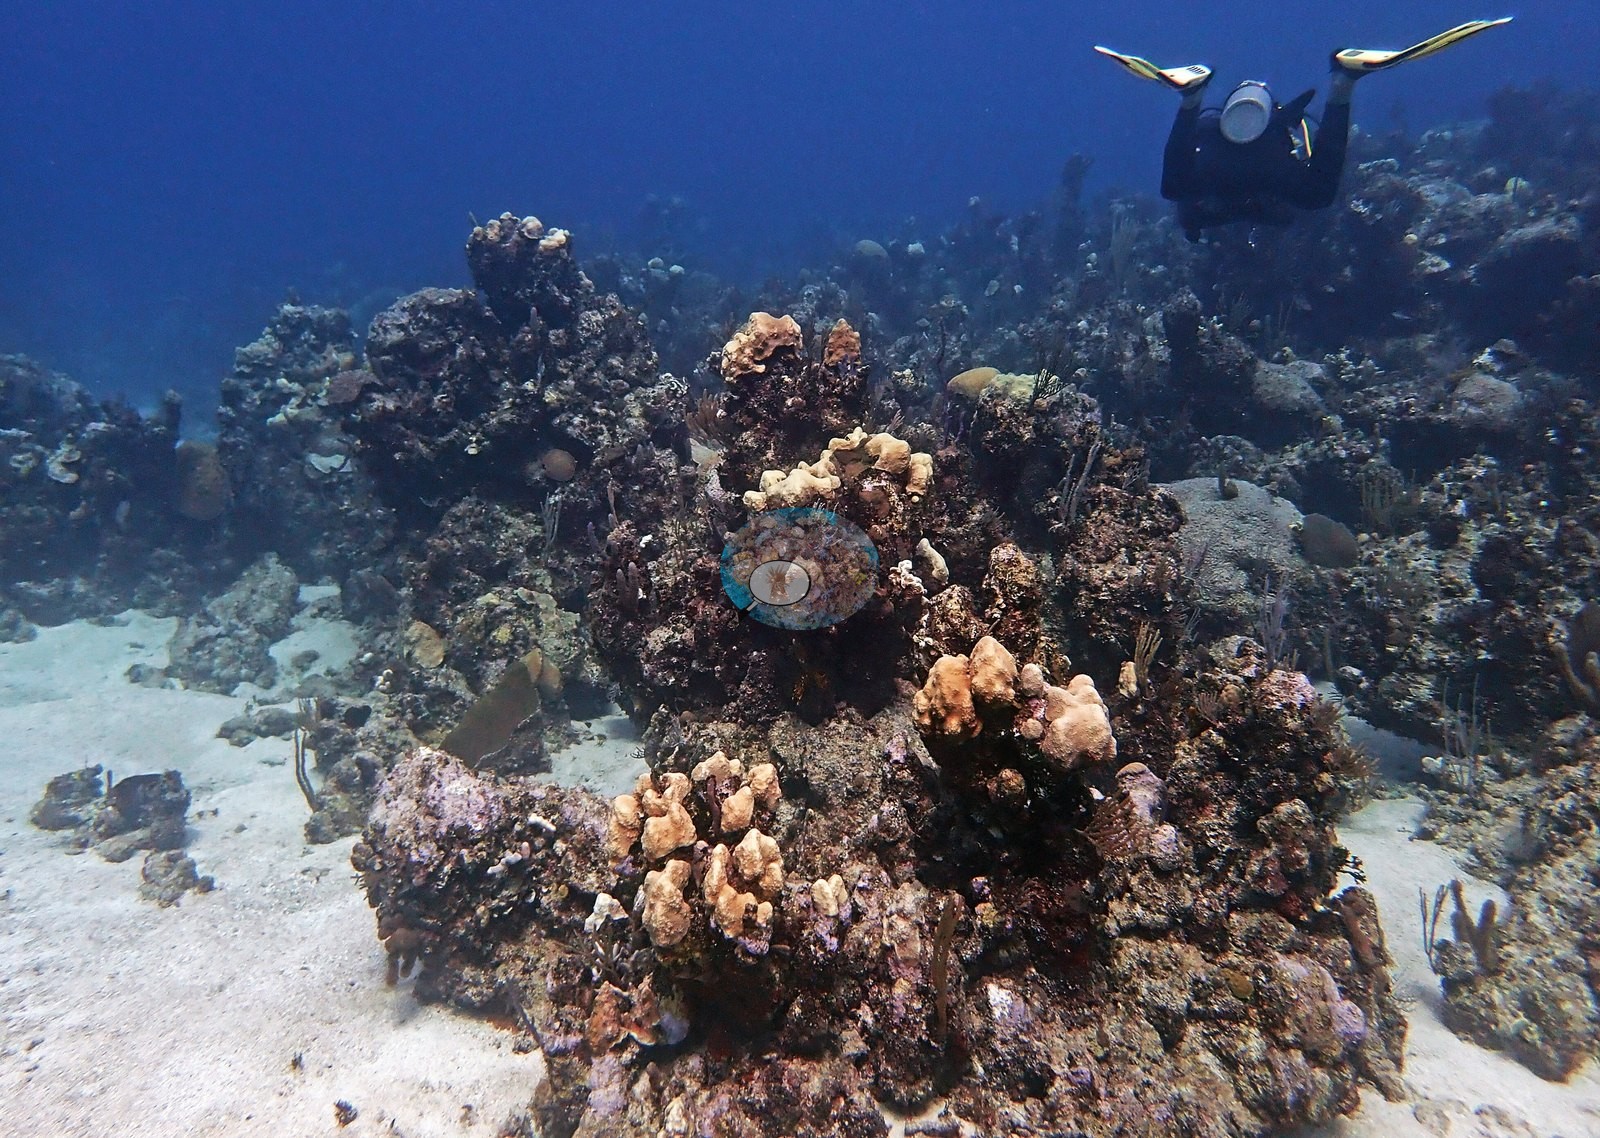
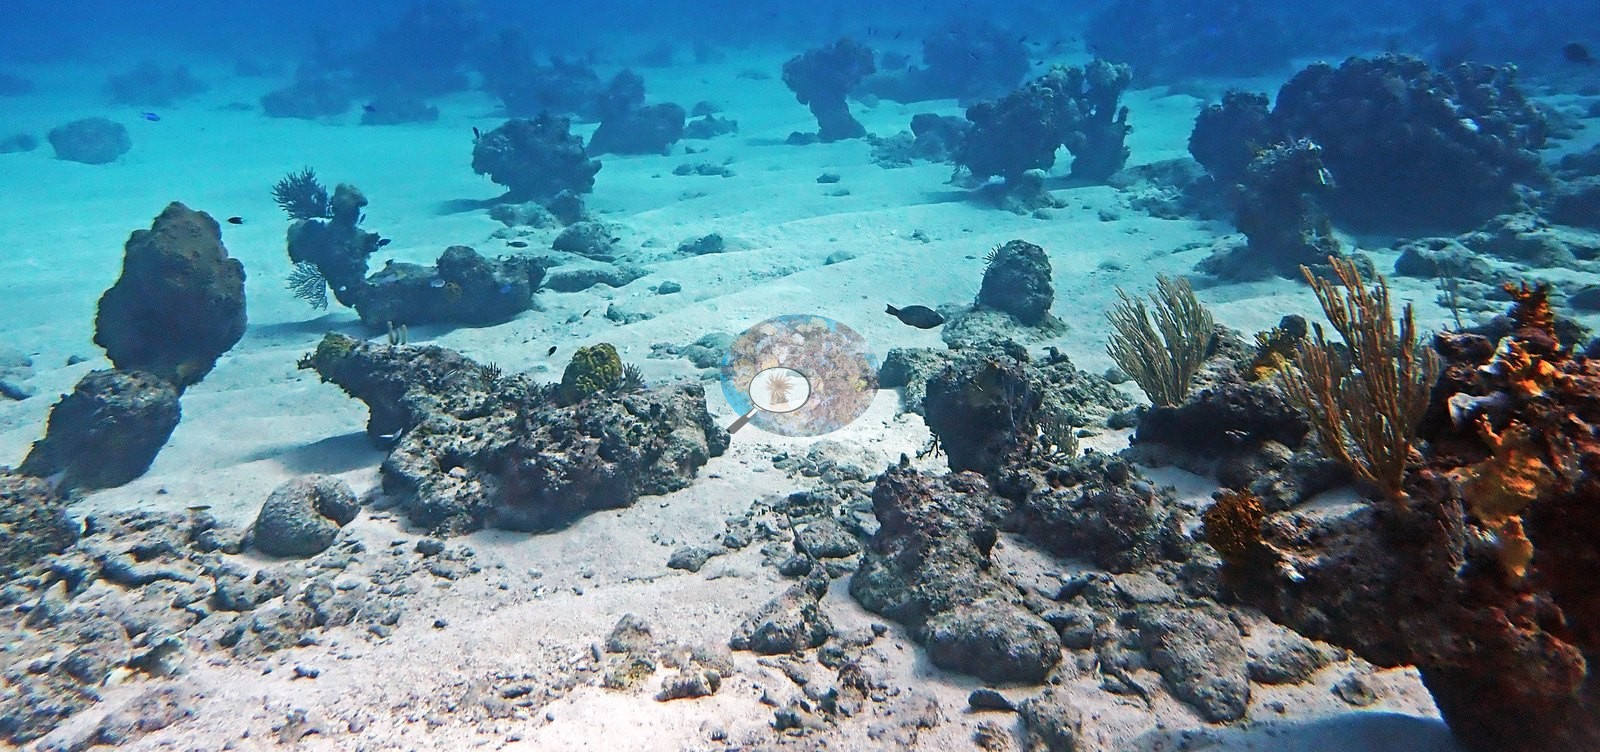
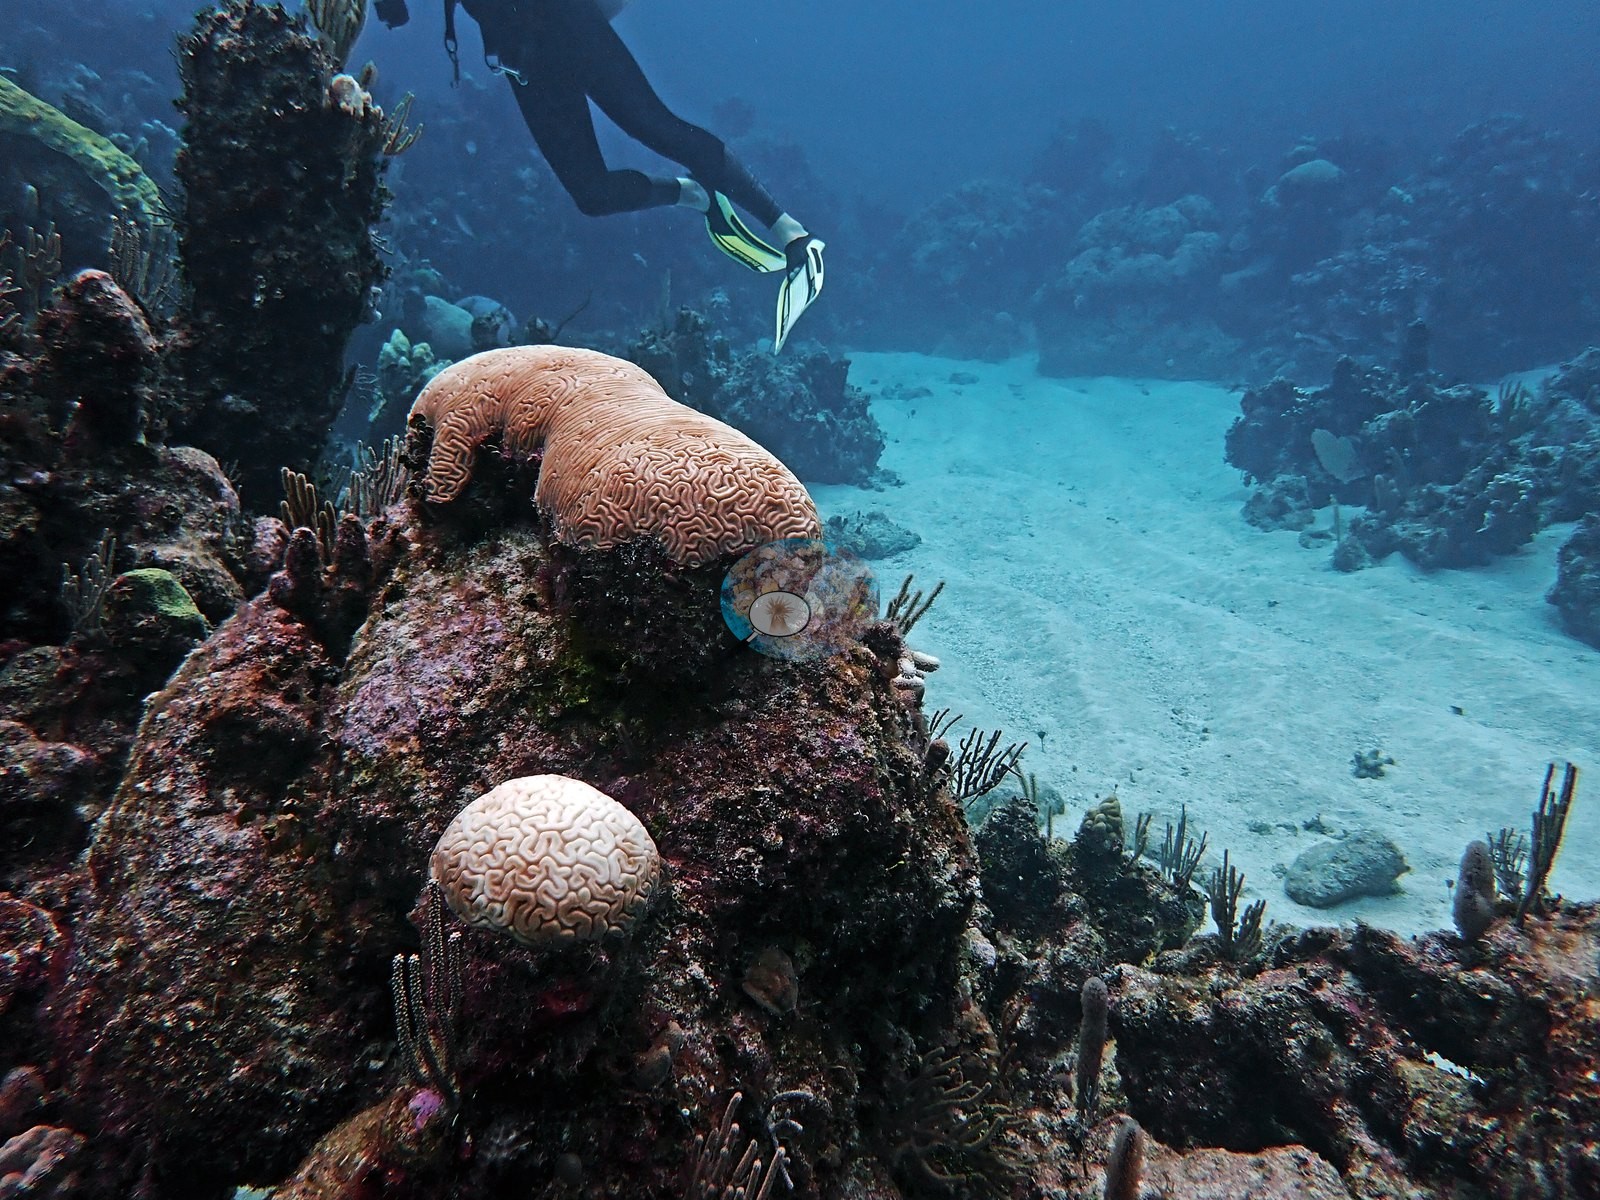
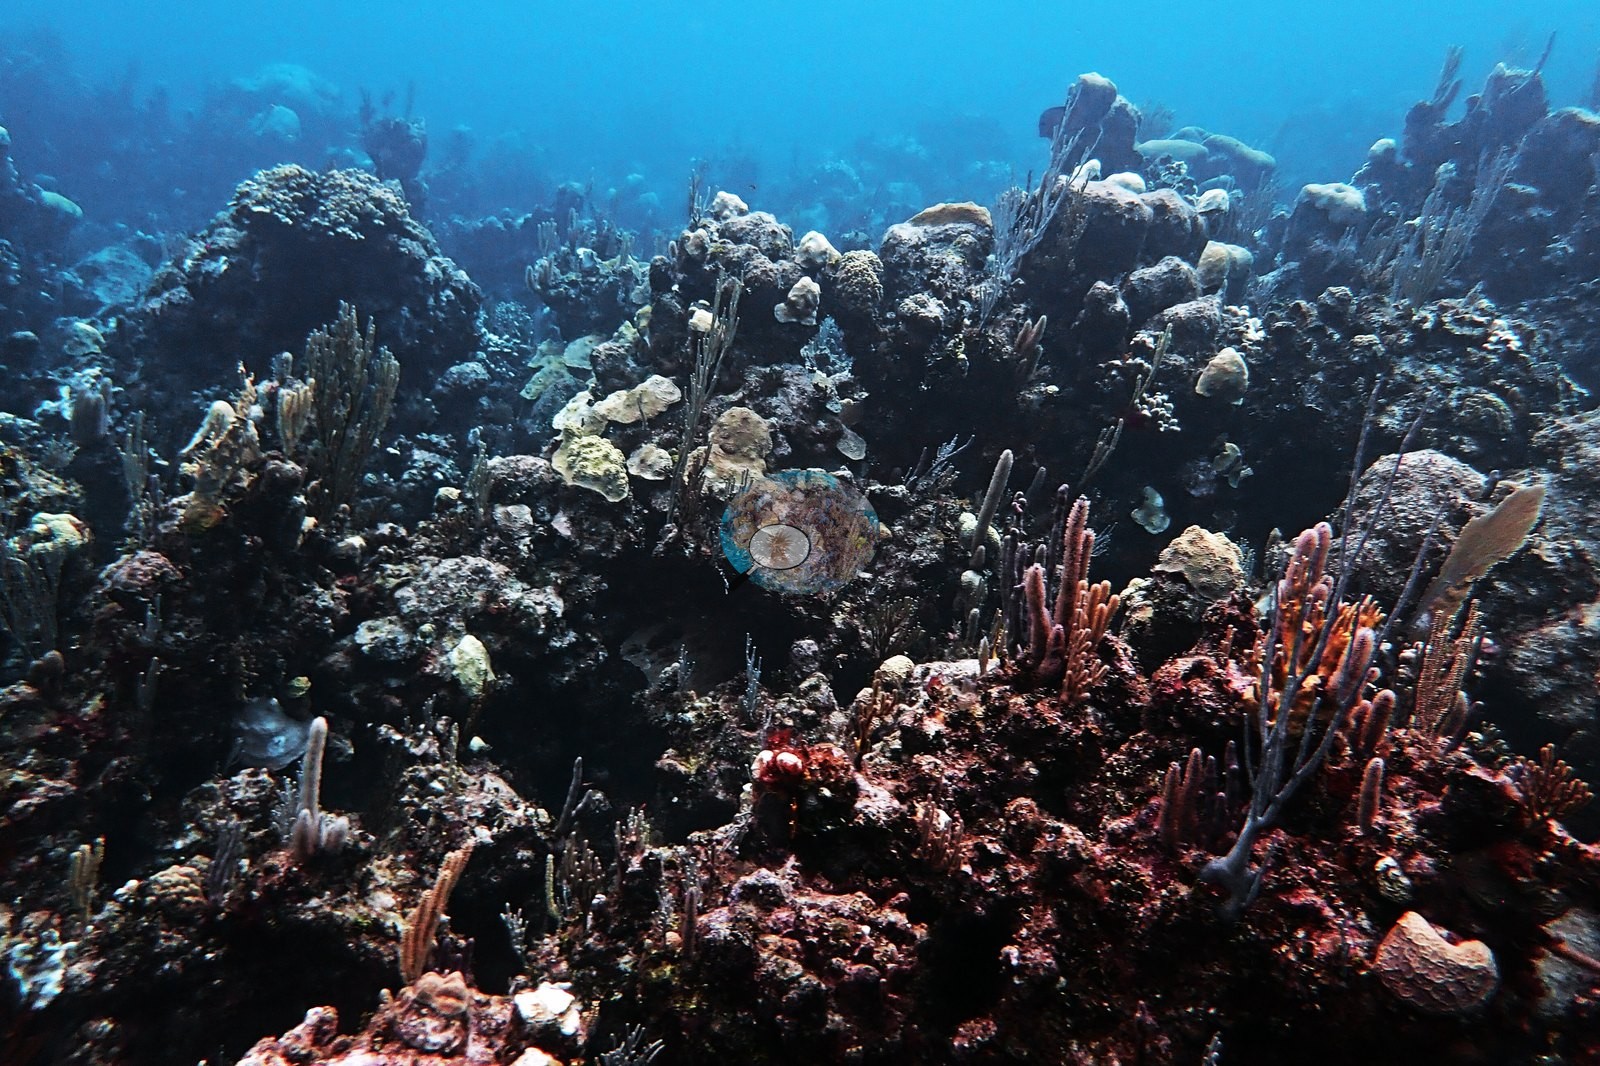
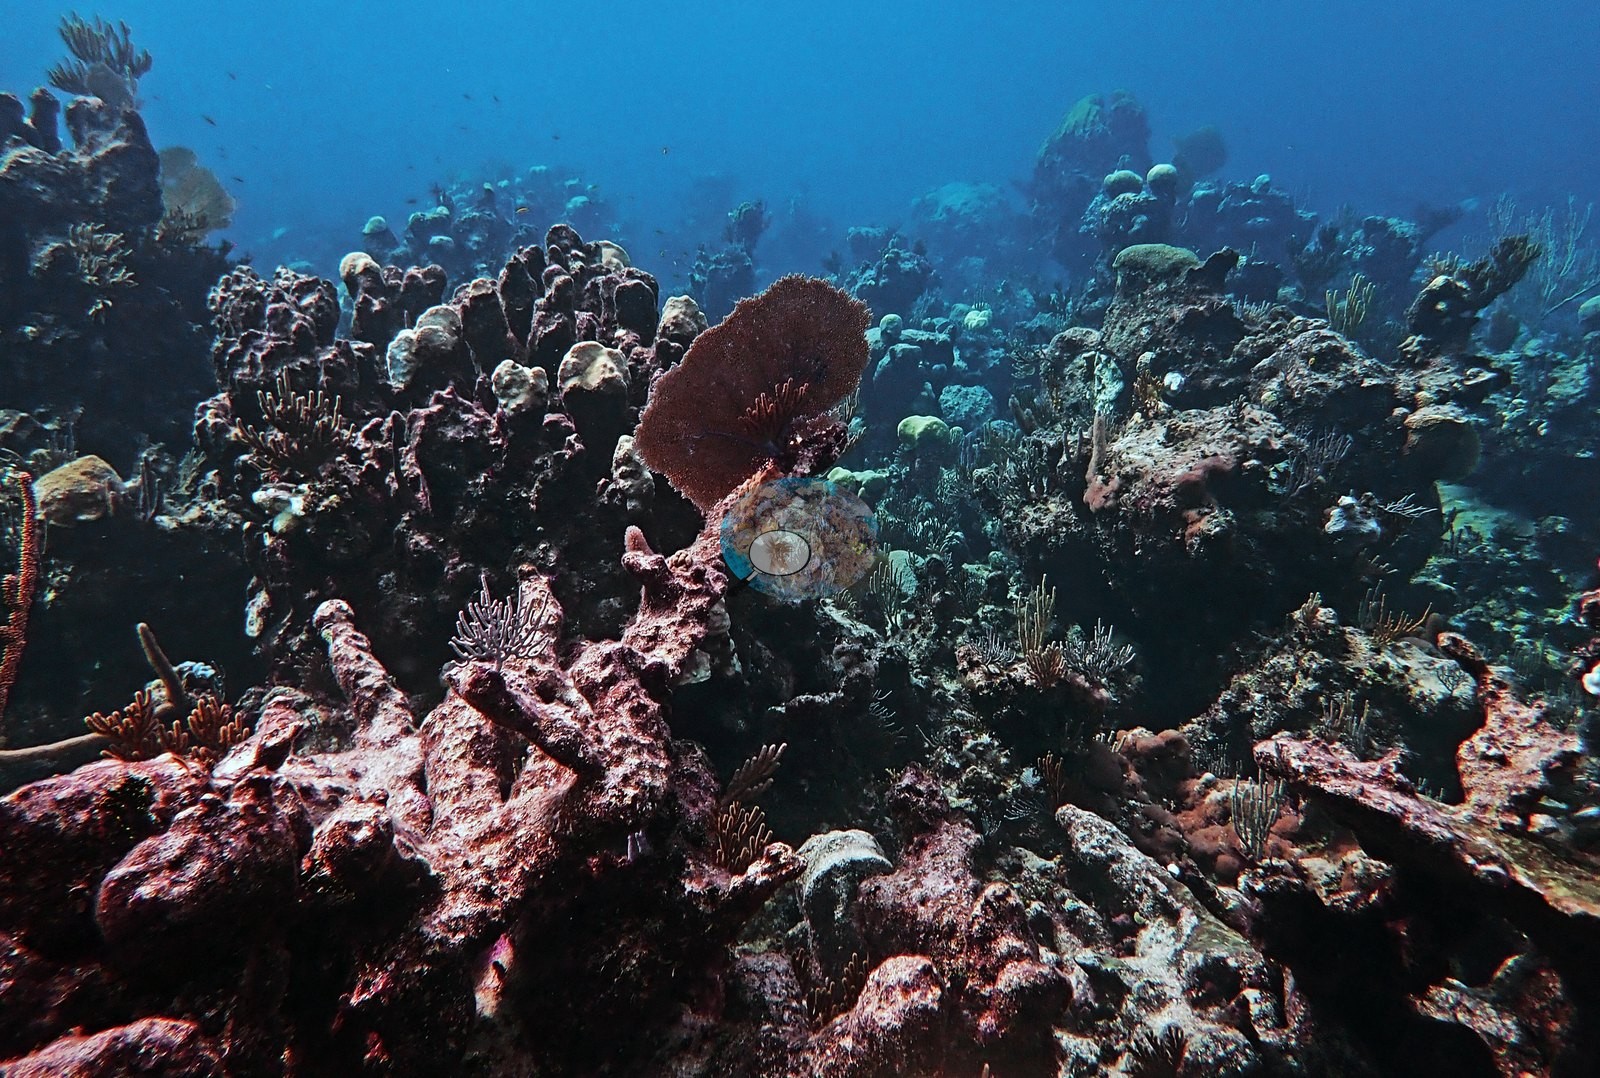
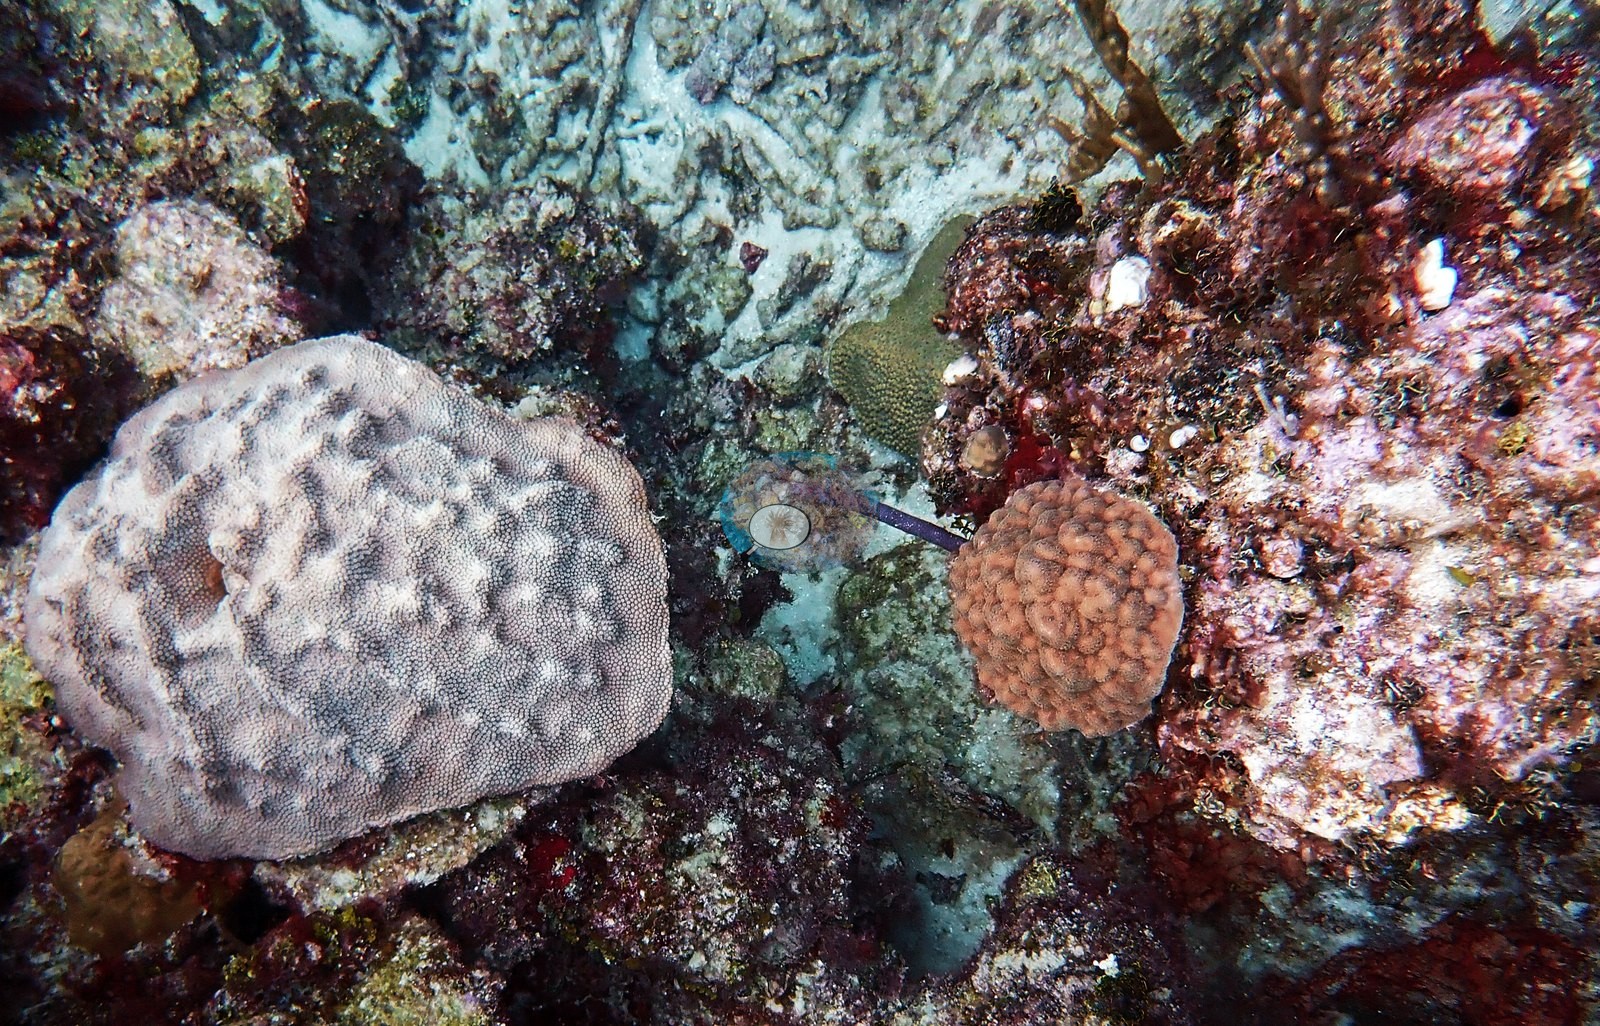
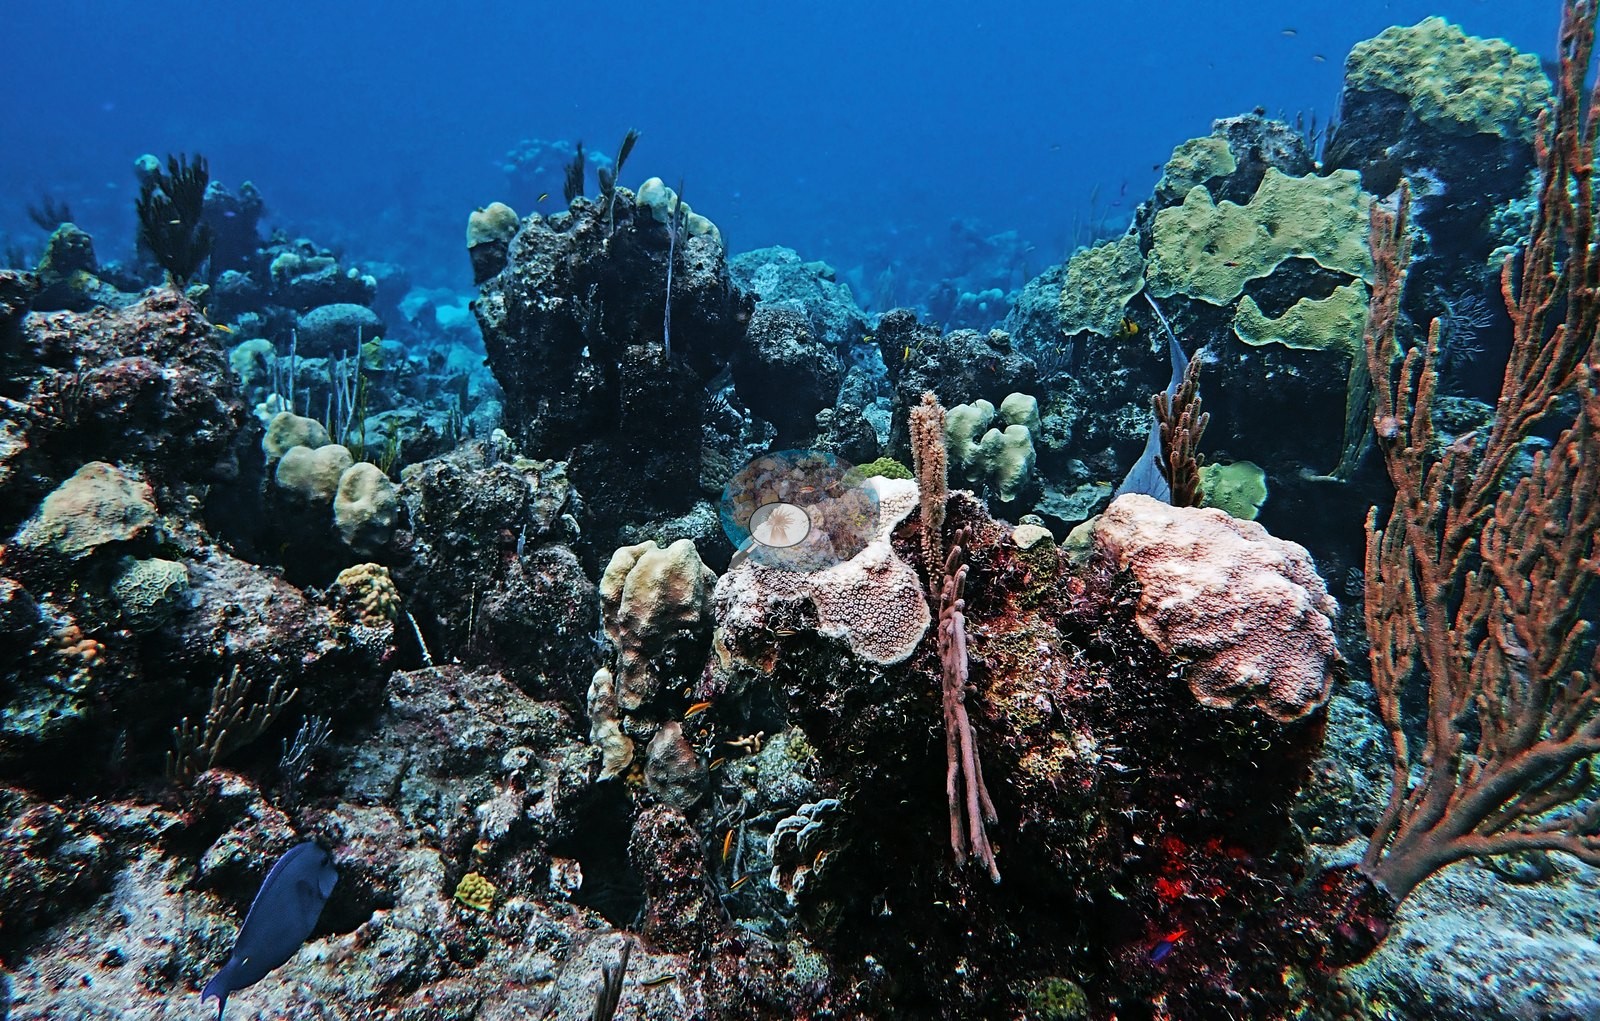
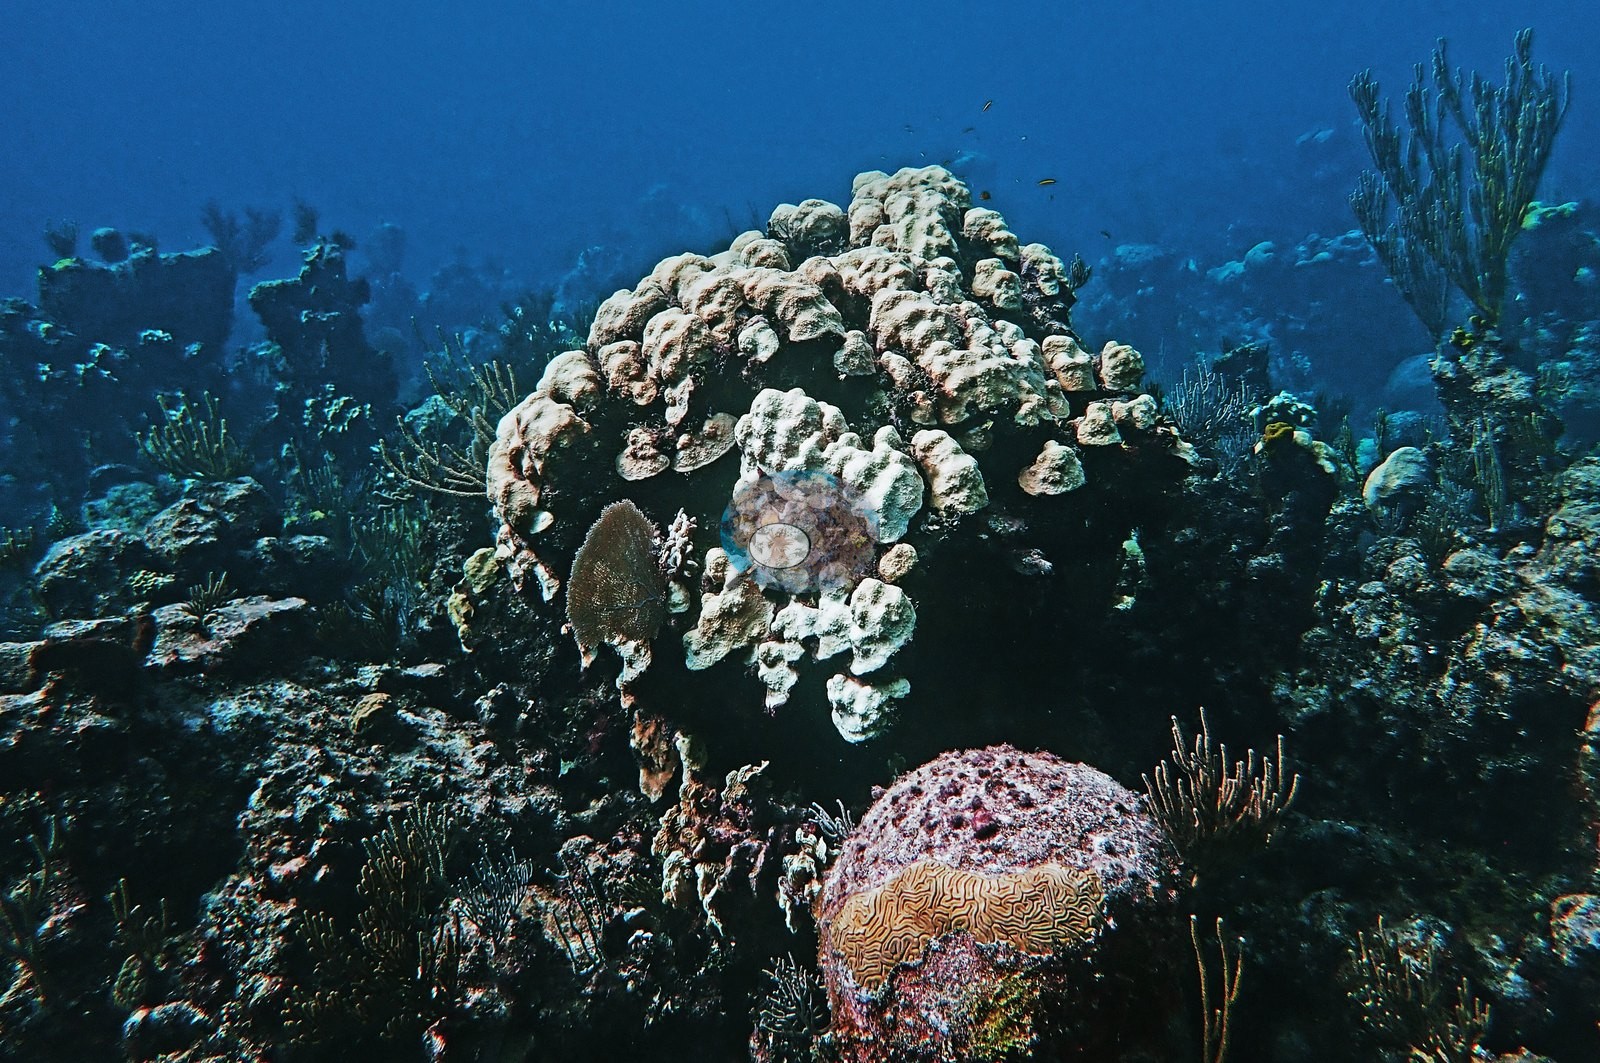
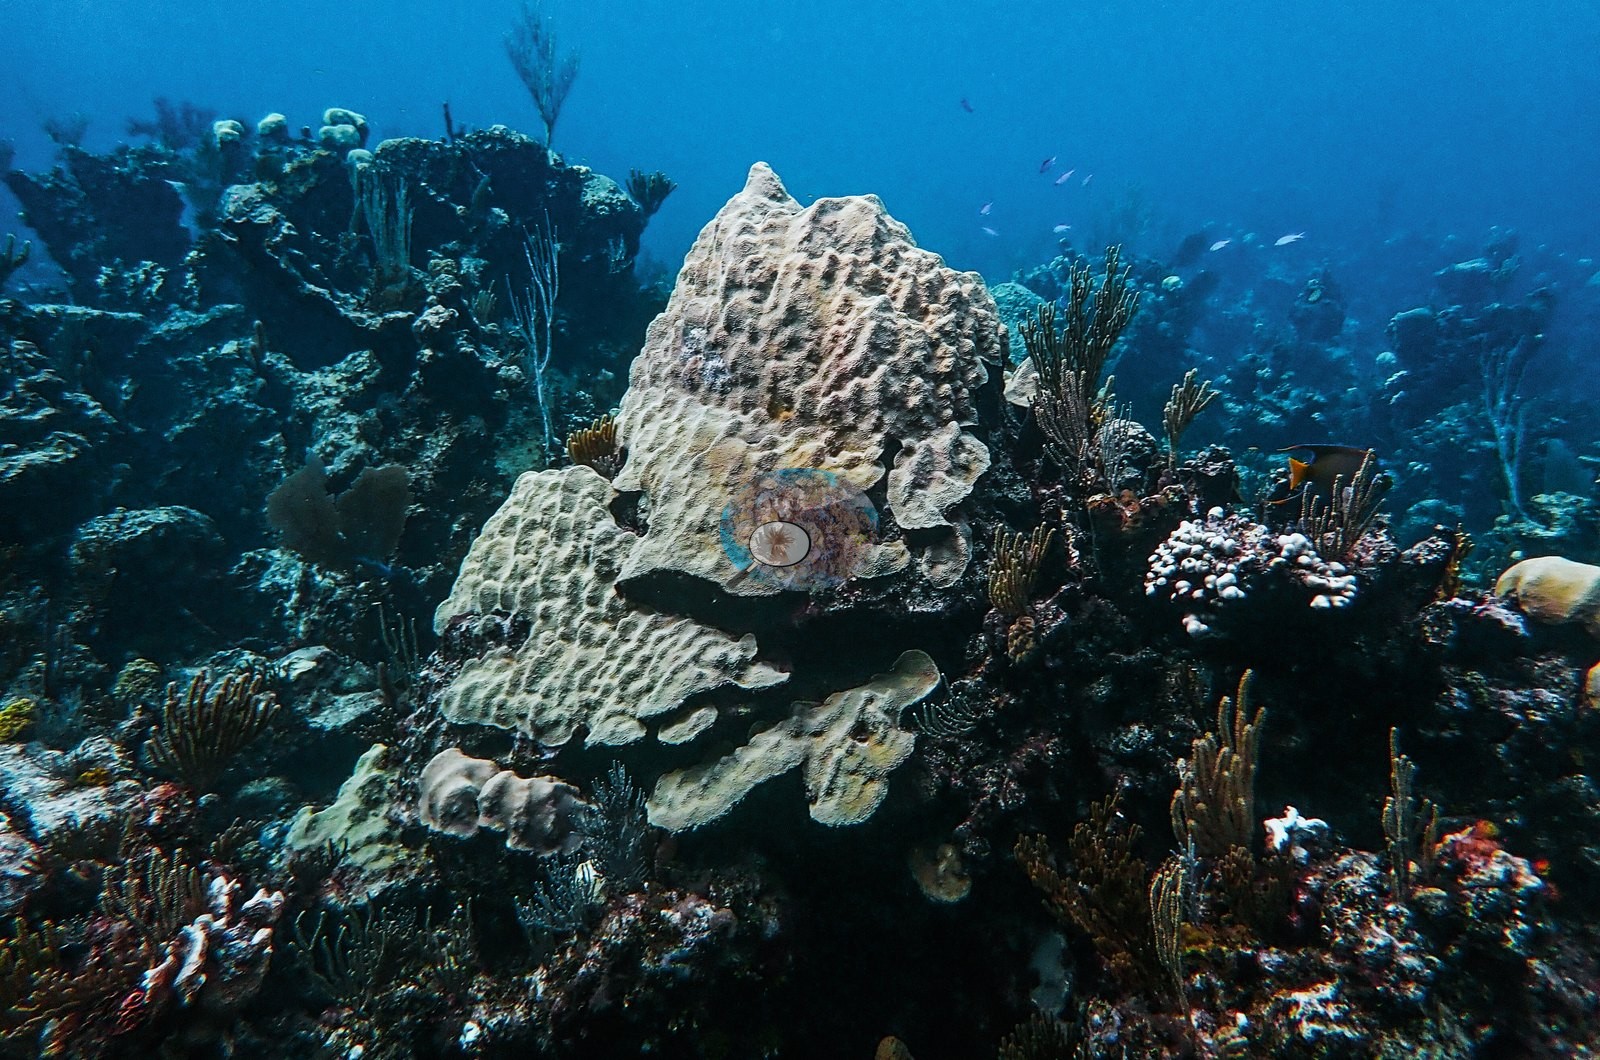
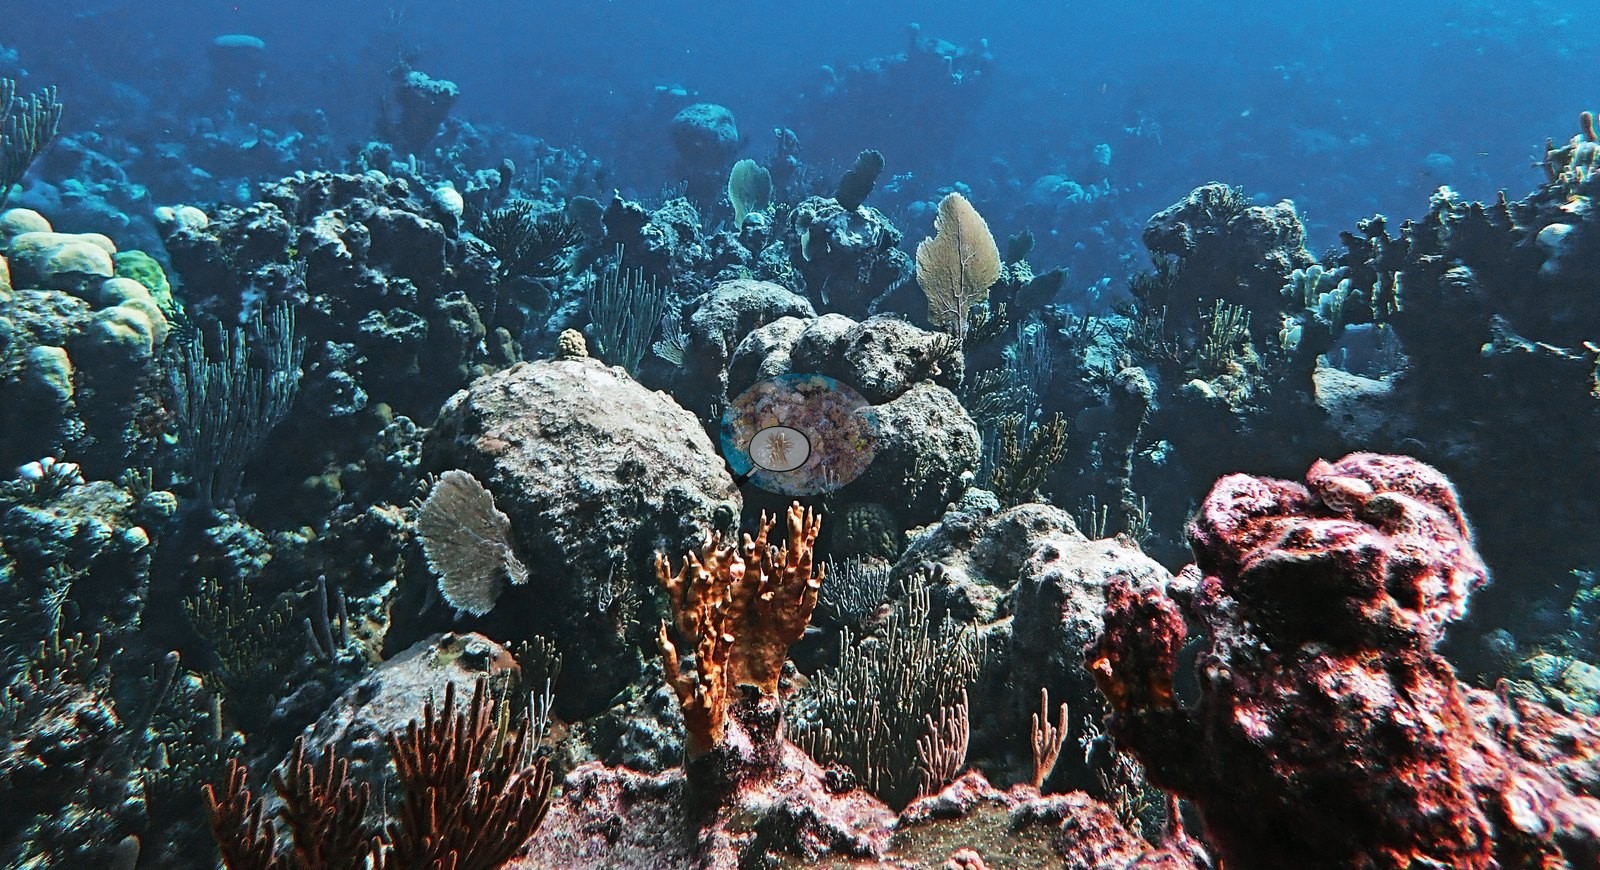
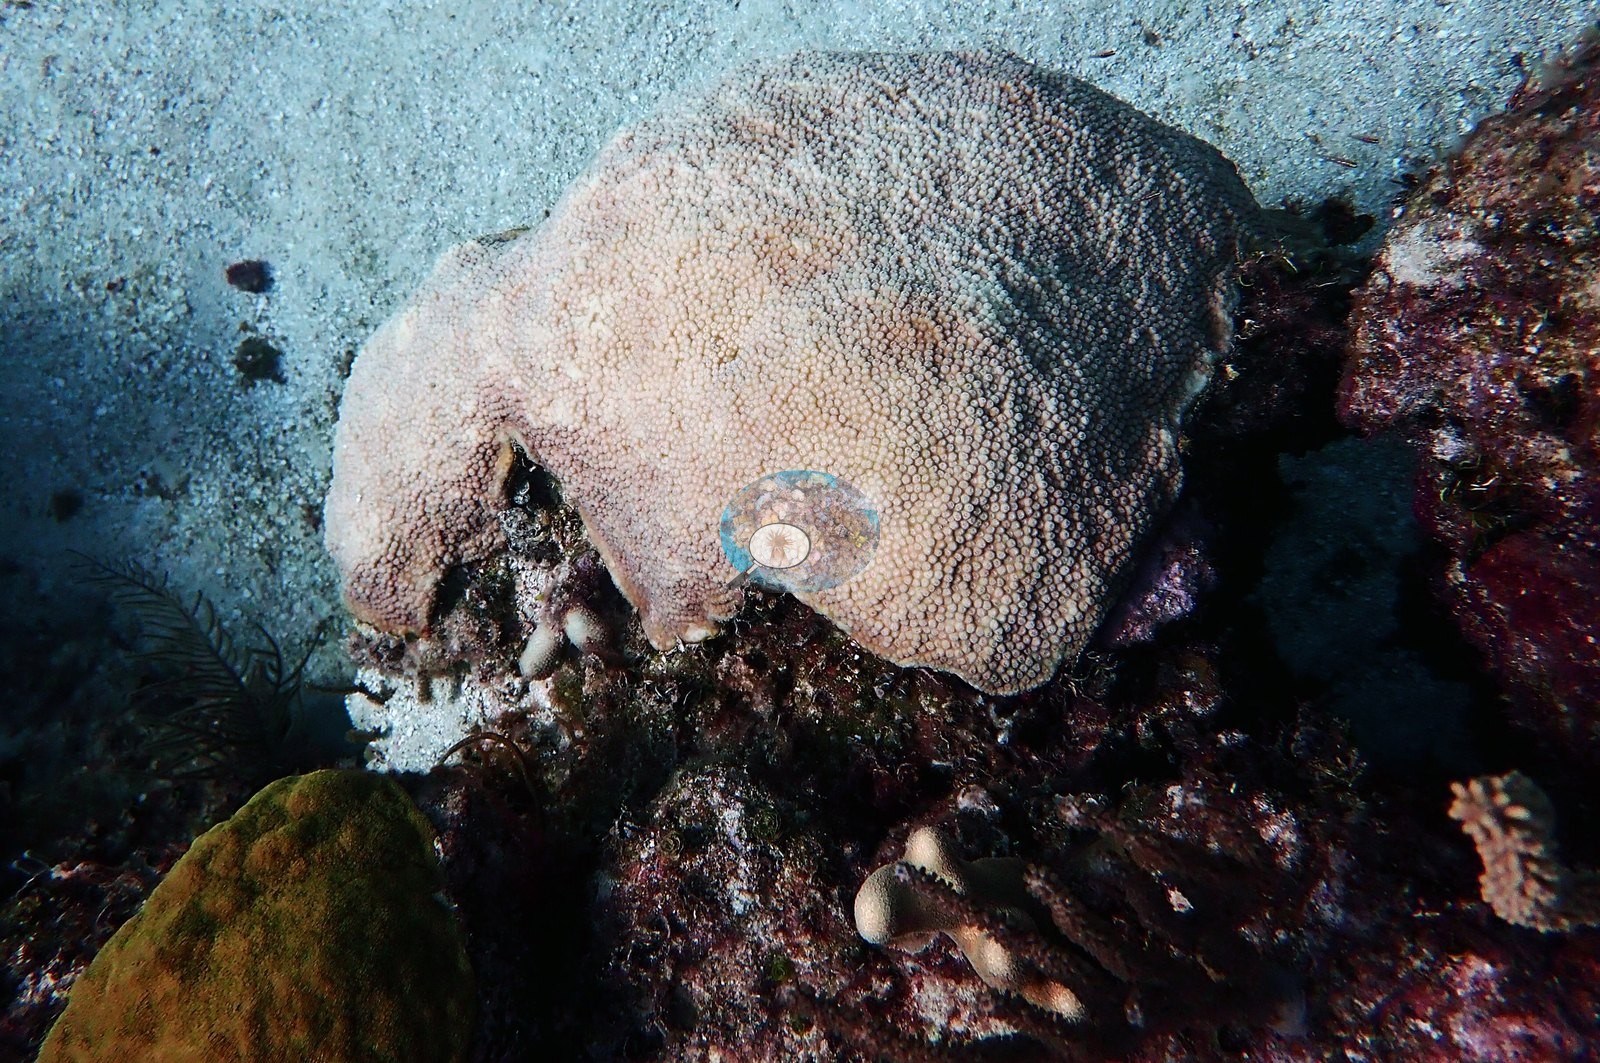
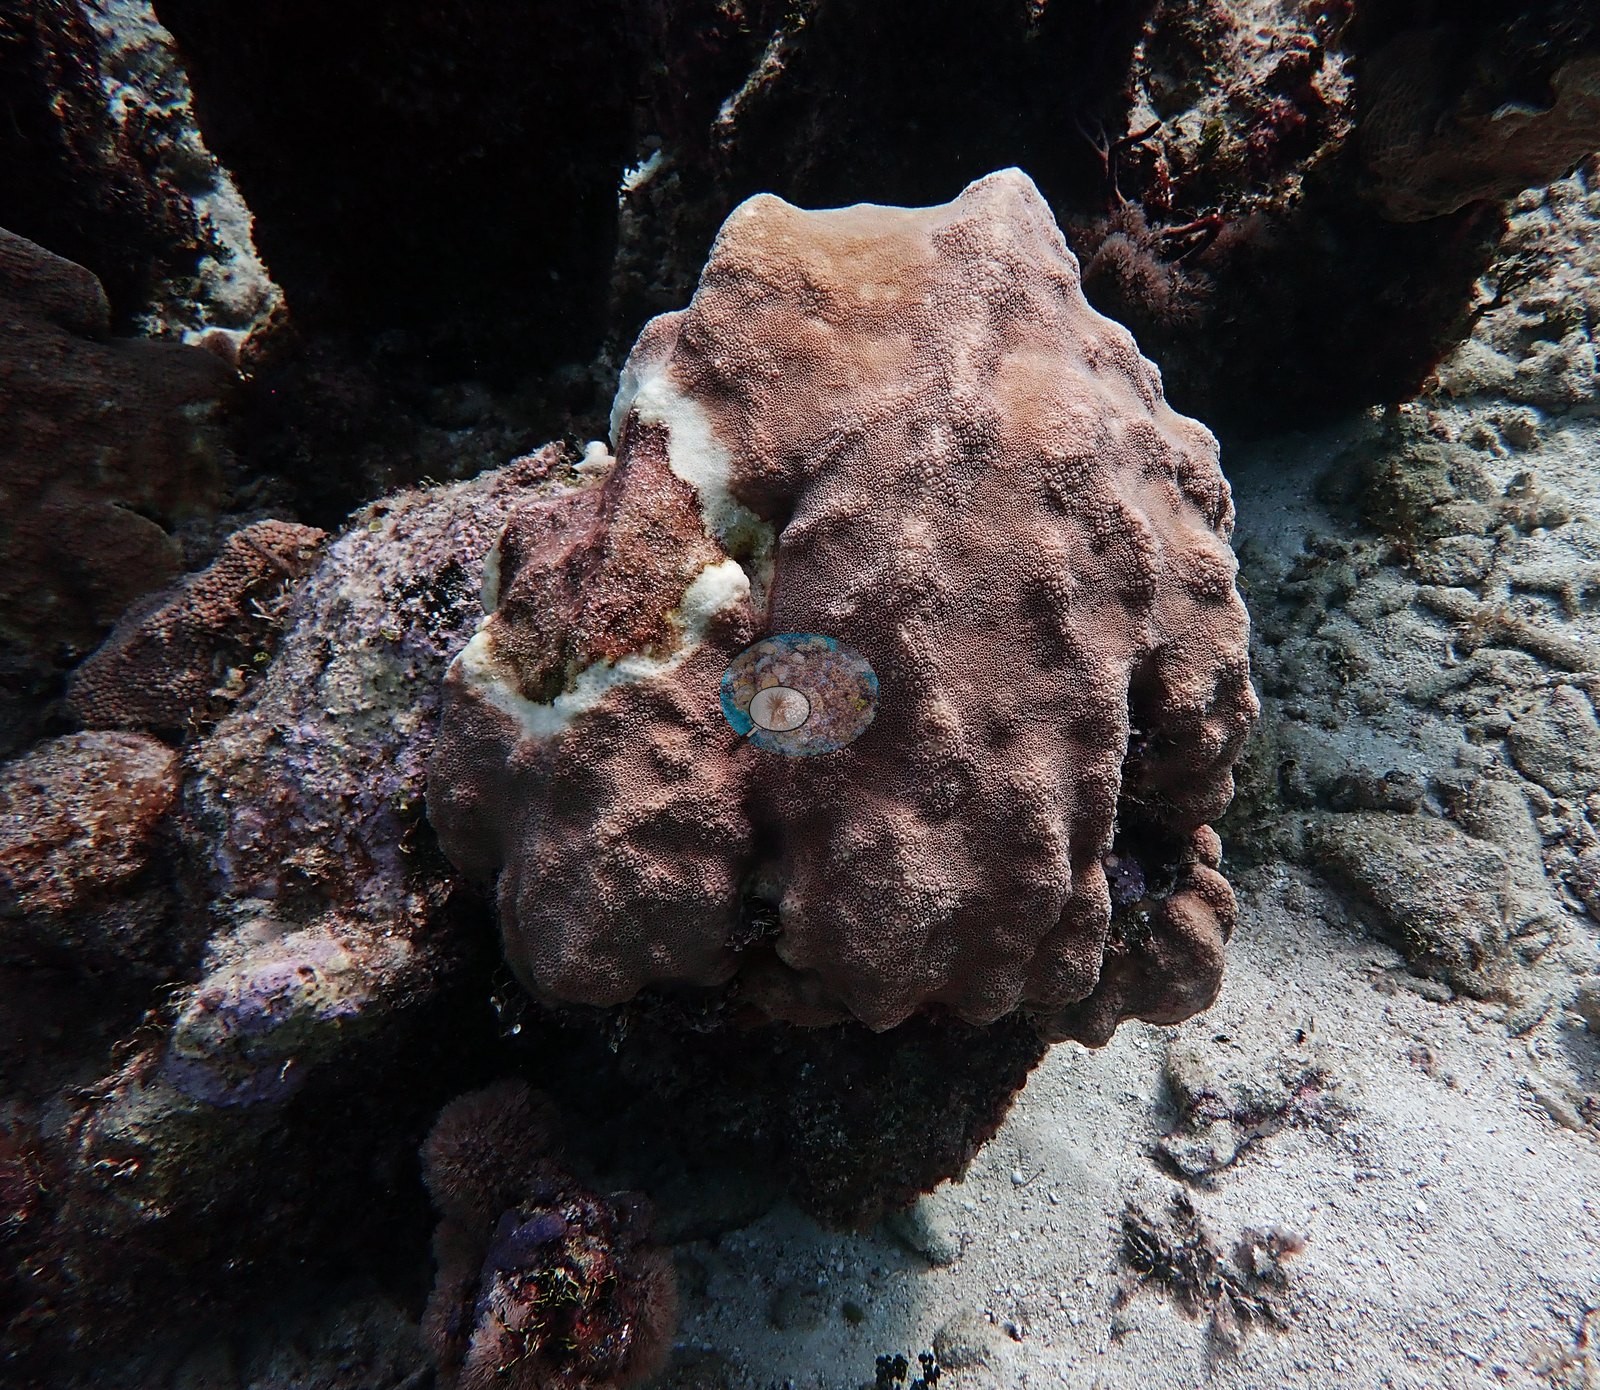
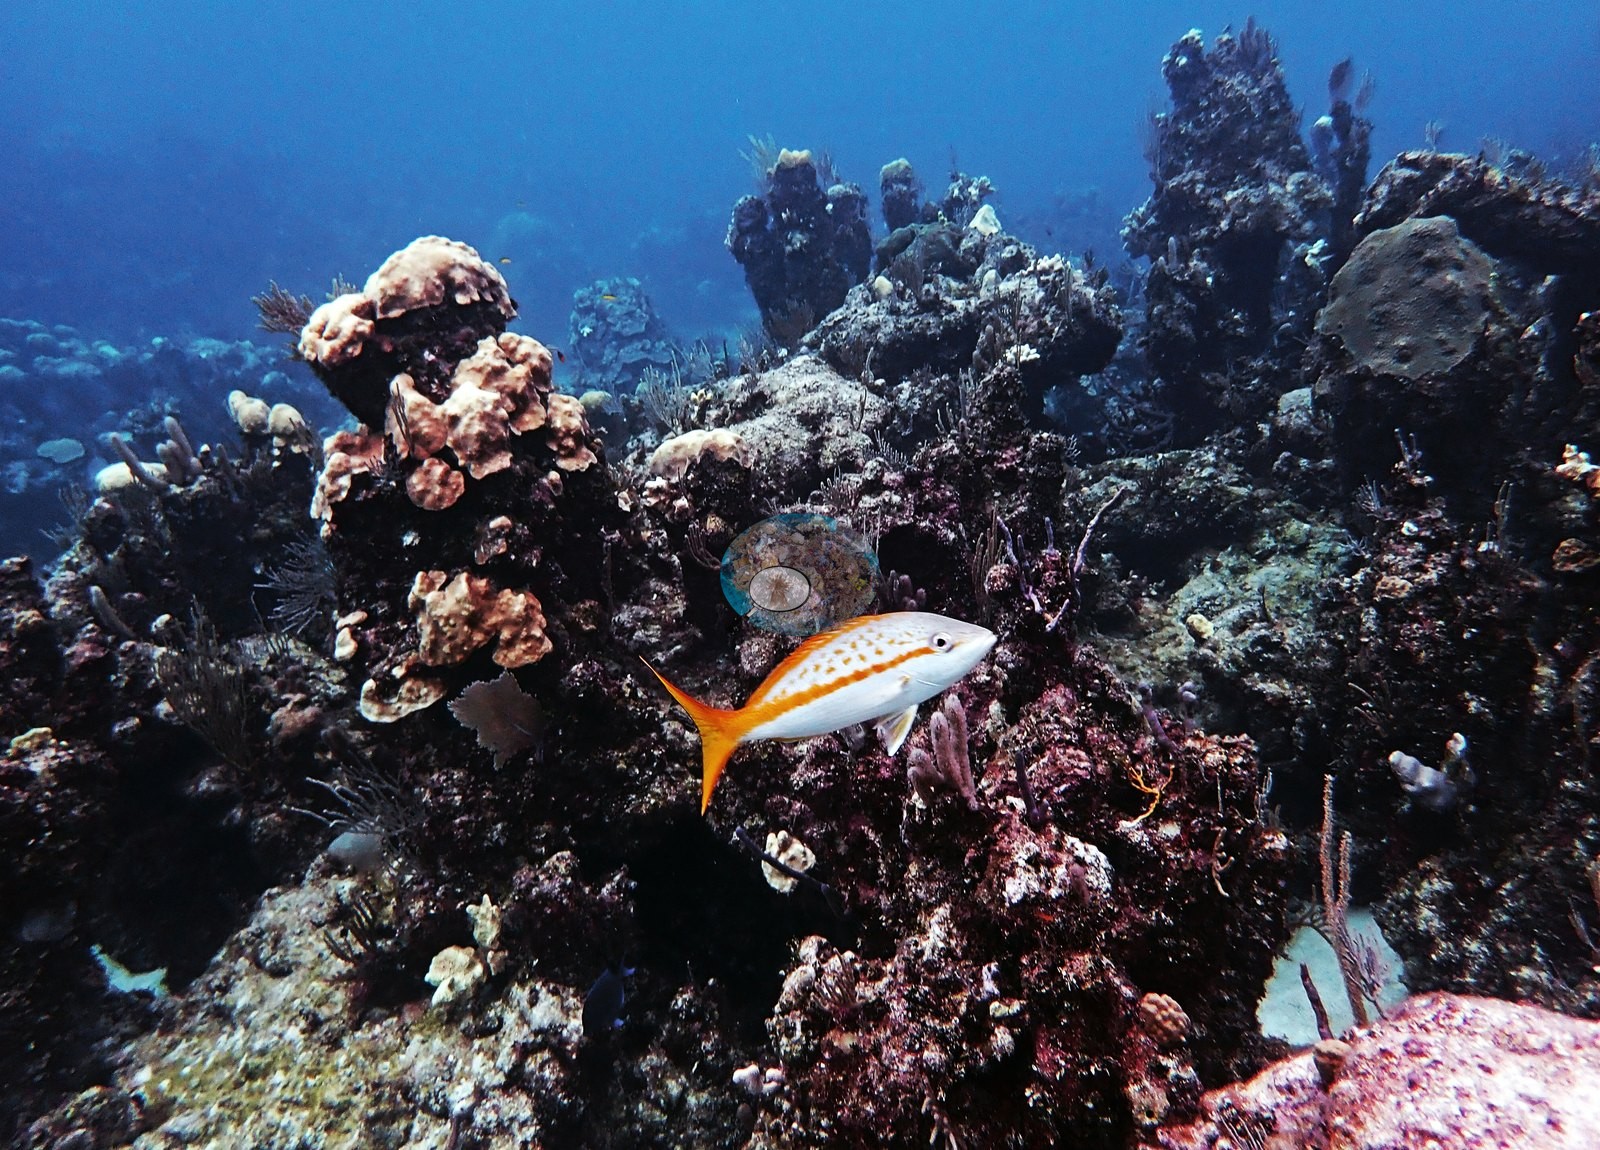
Gorgonians carry most of the vertical relief: sea fans, sea plumes, sea rods, and single wire whips stand off nearly every spur (e.g., Image 7, Image 15, Image 17, Image 47, Image 53, Image 70, Image 74, Image 79, Image 92, Image 111).
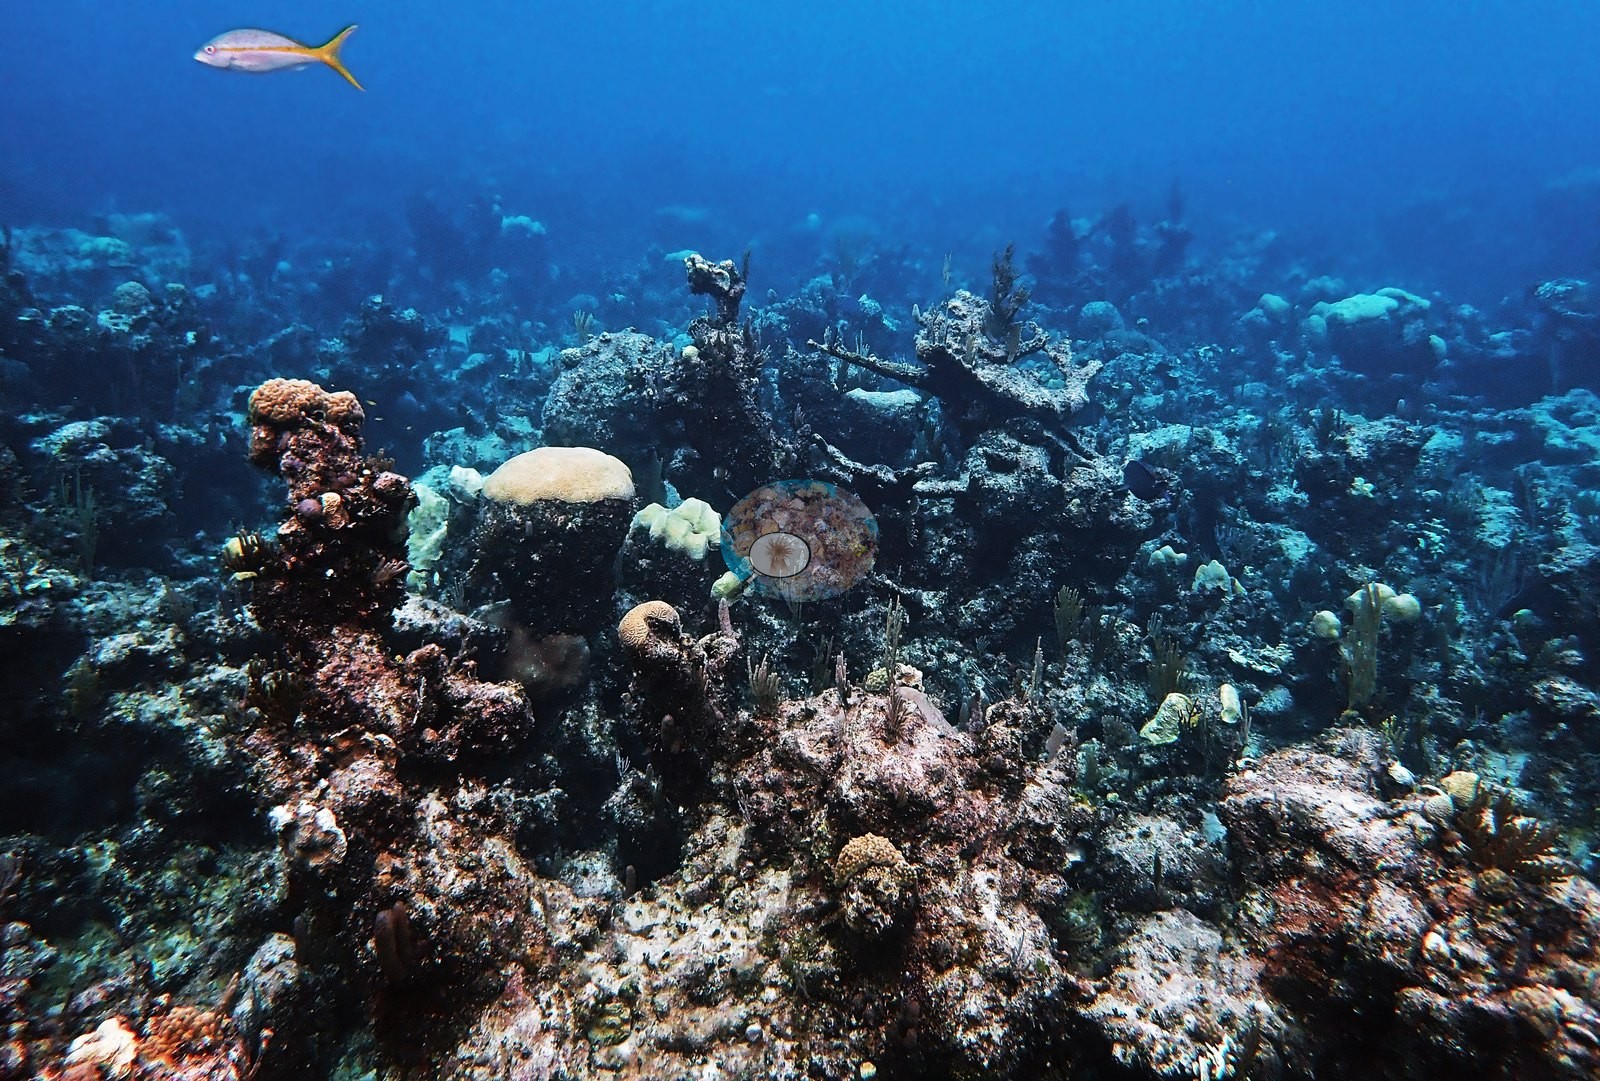
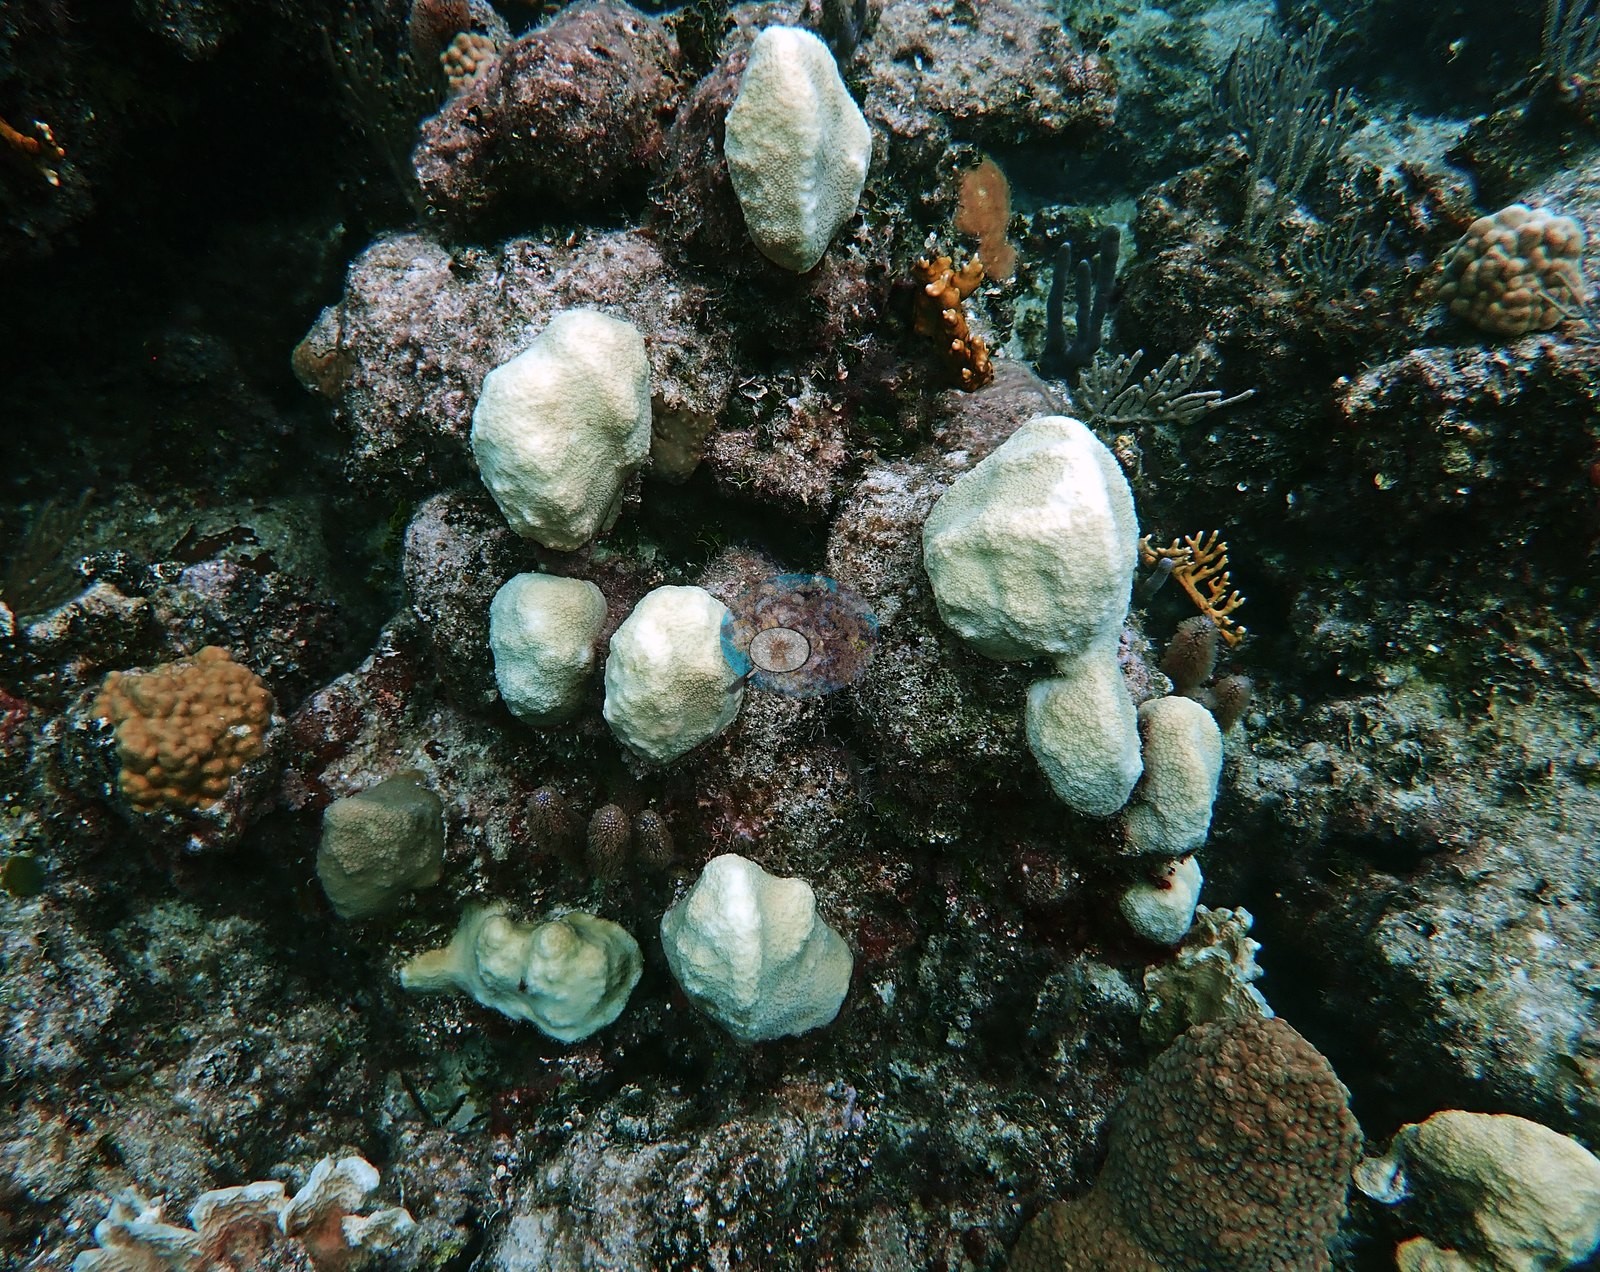
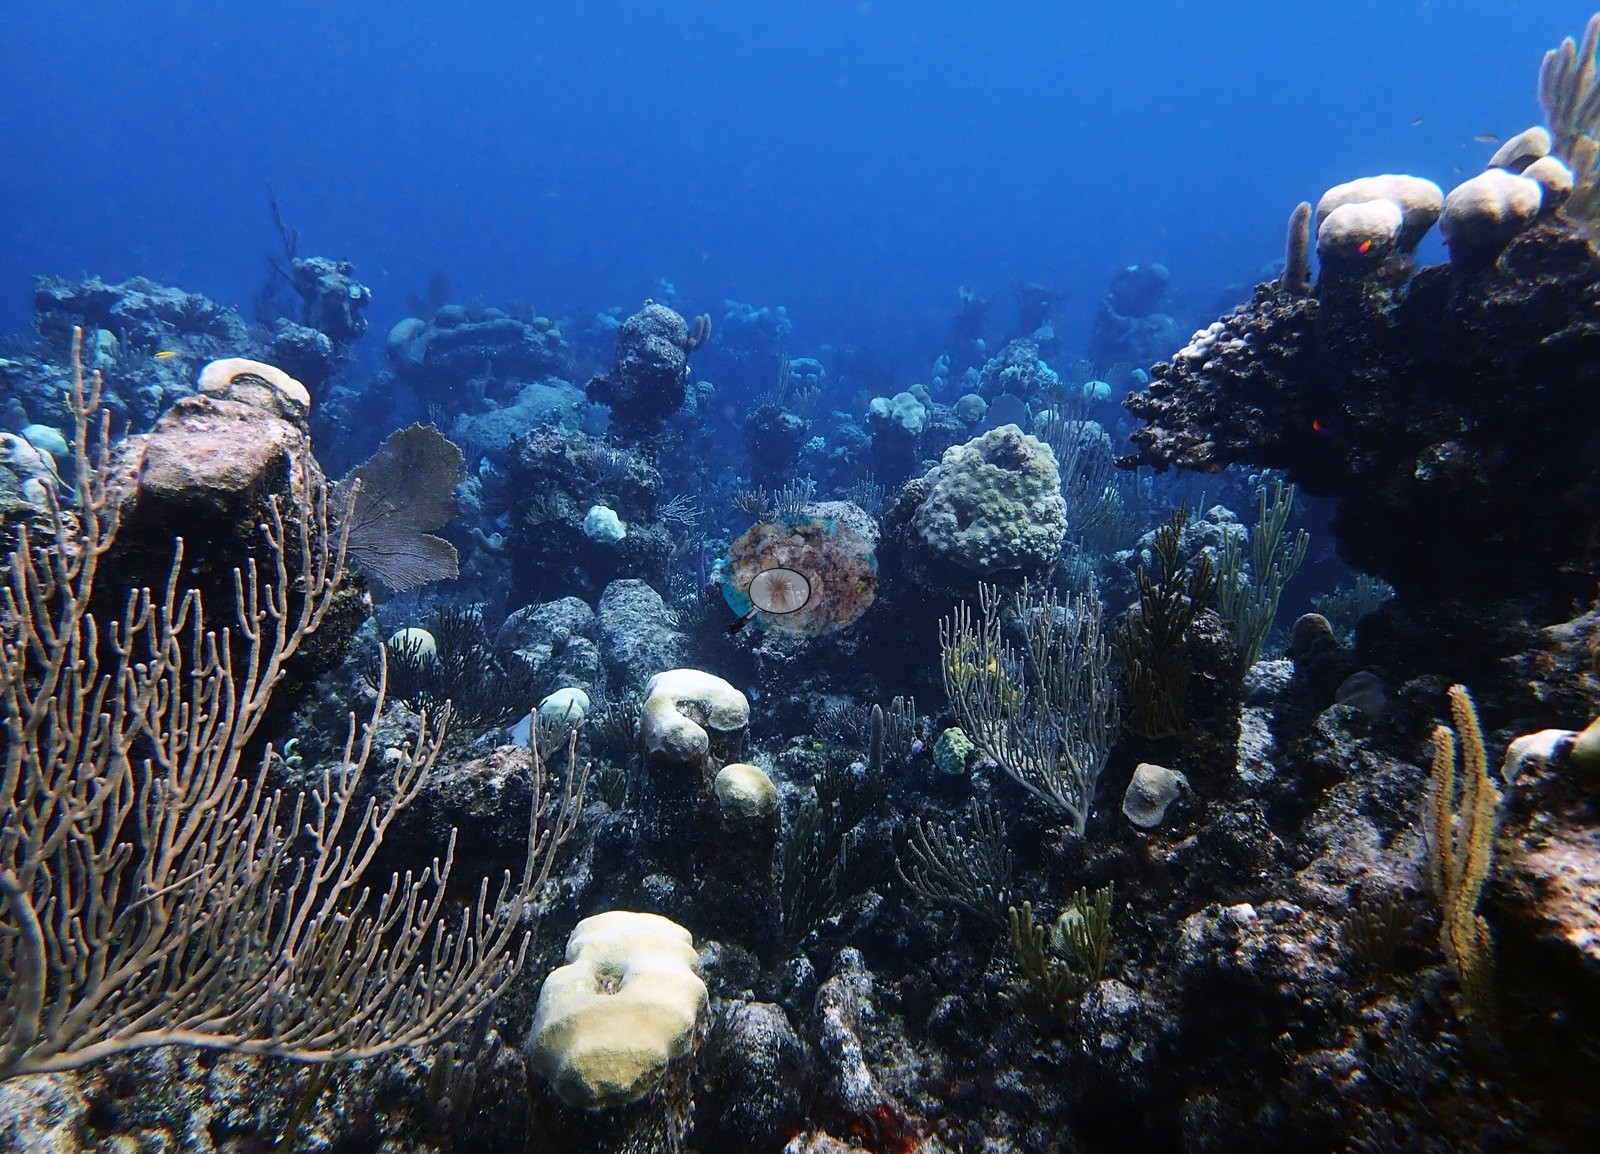
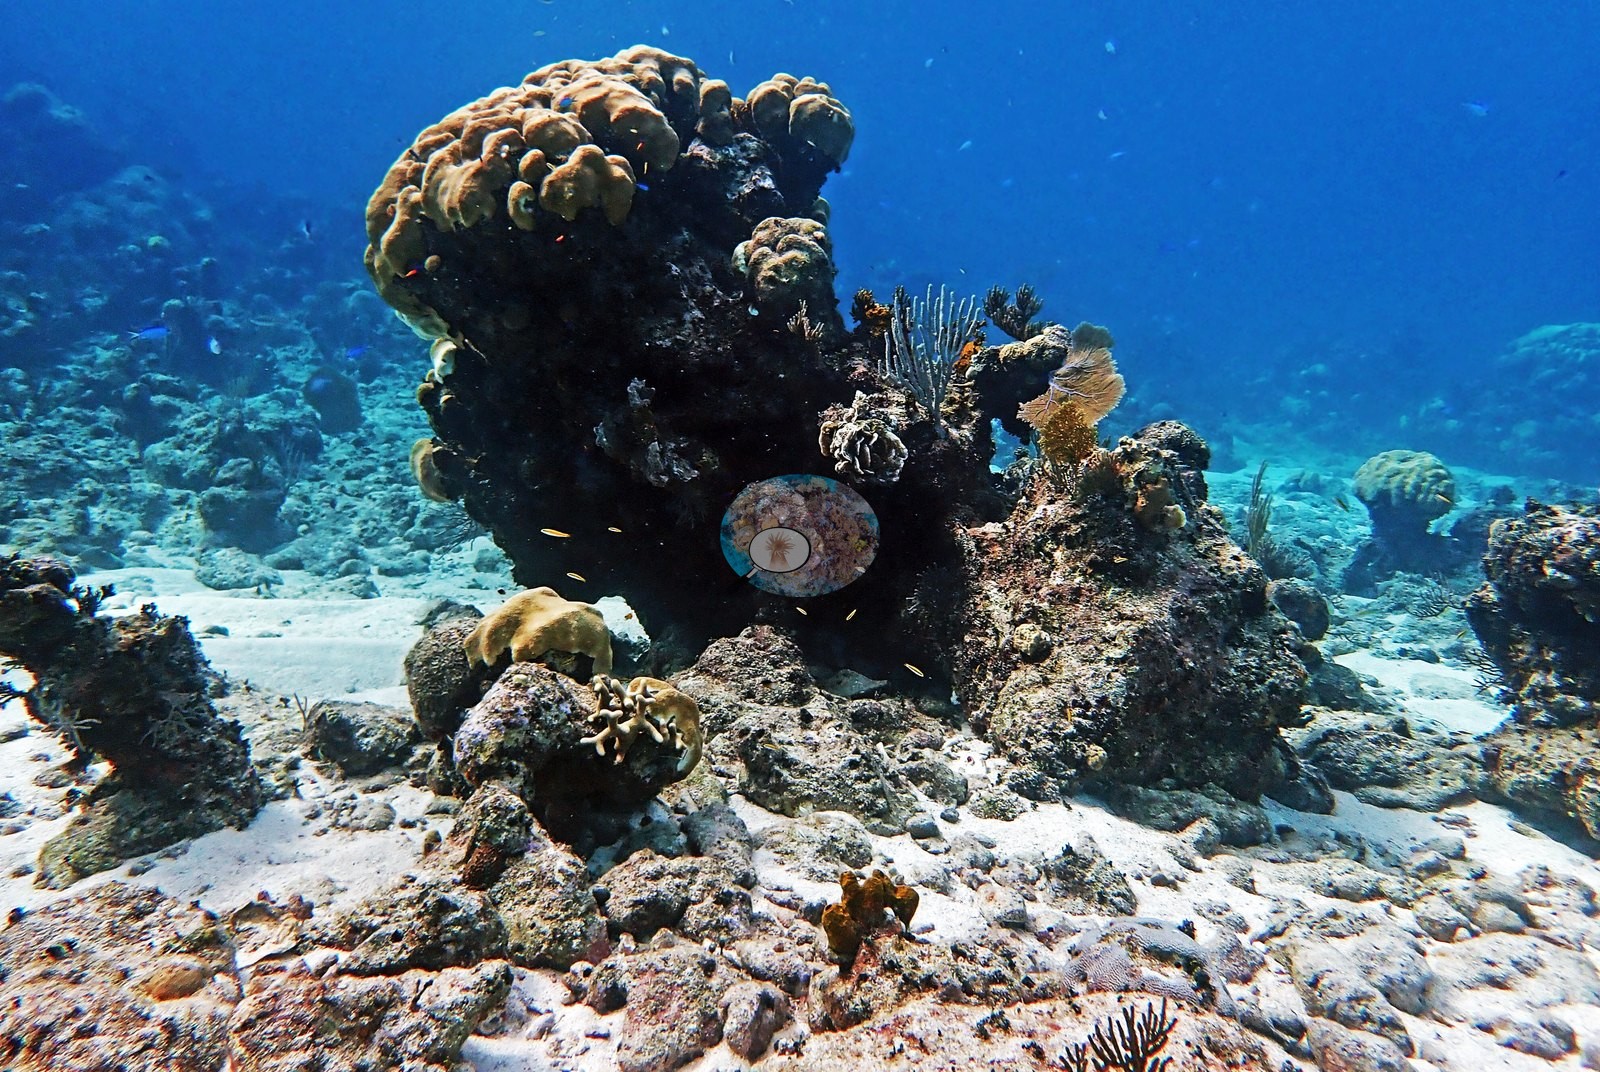
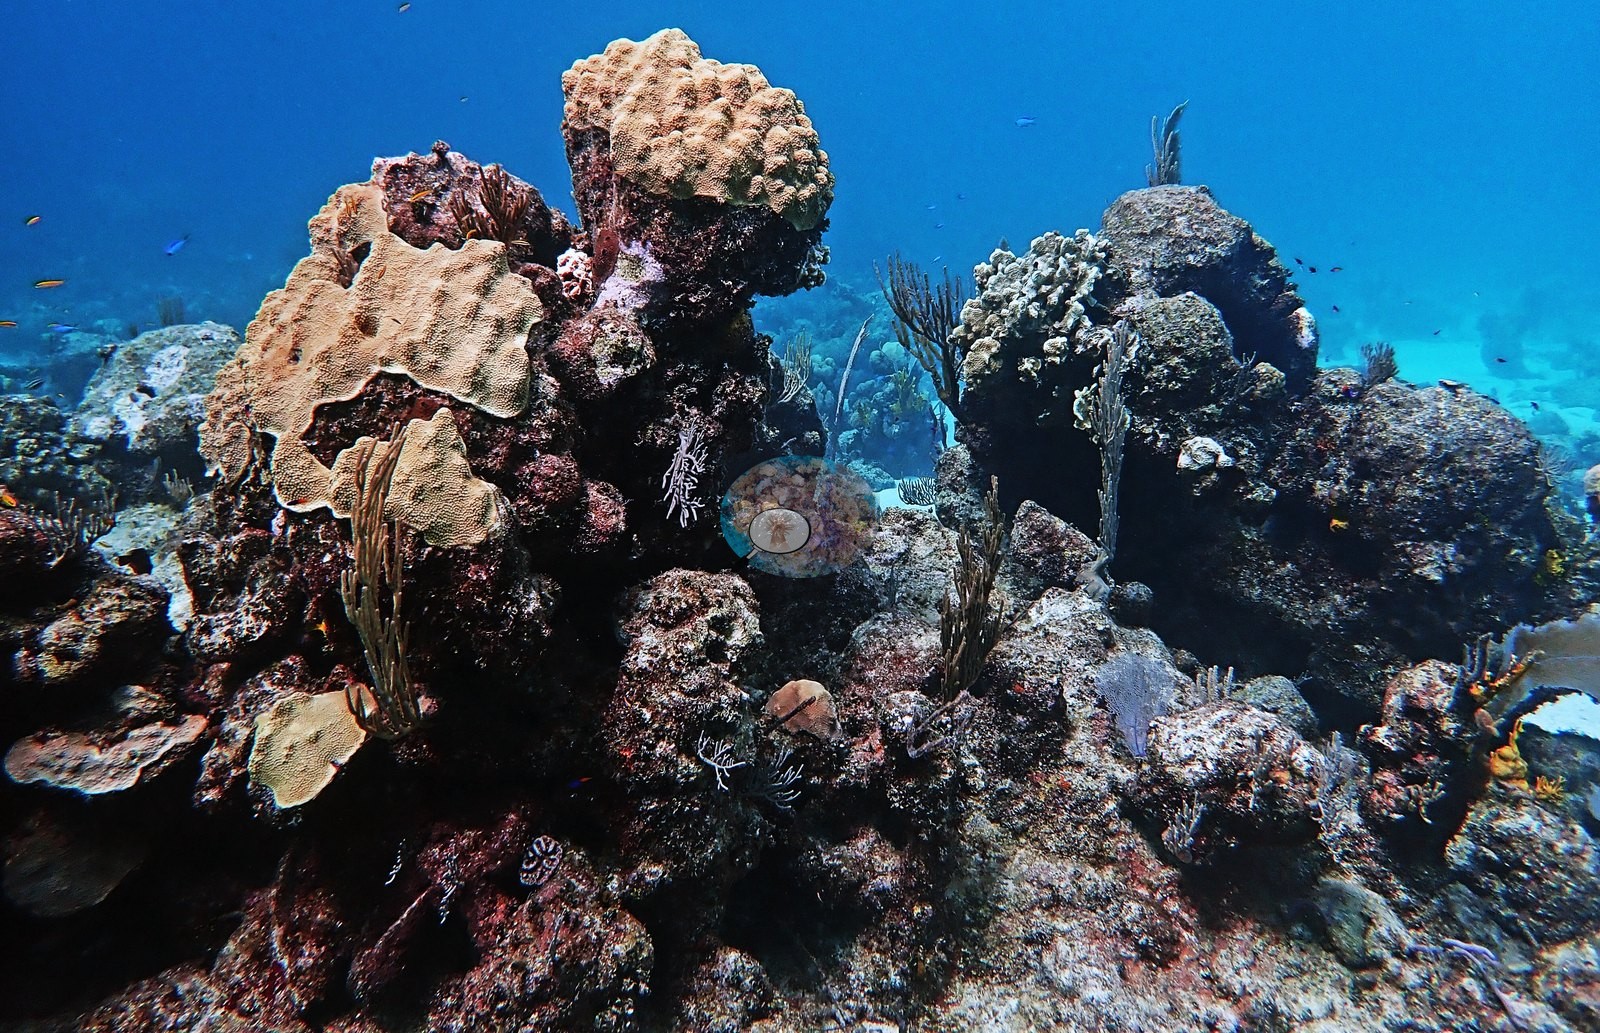
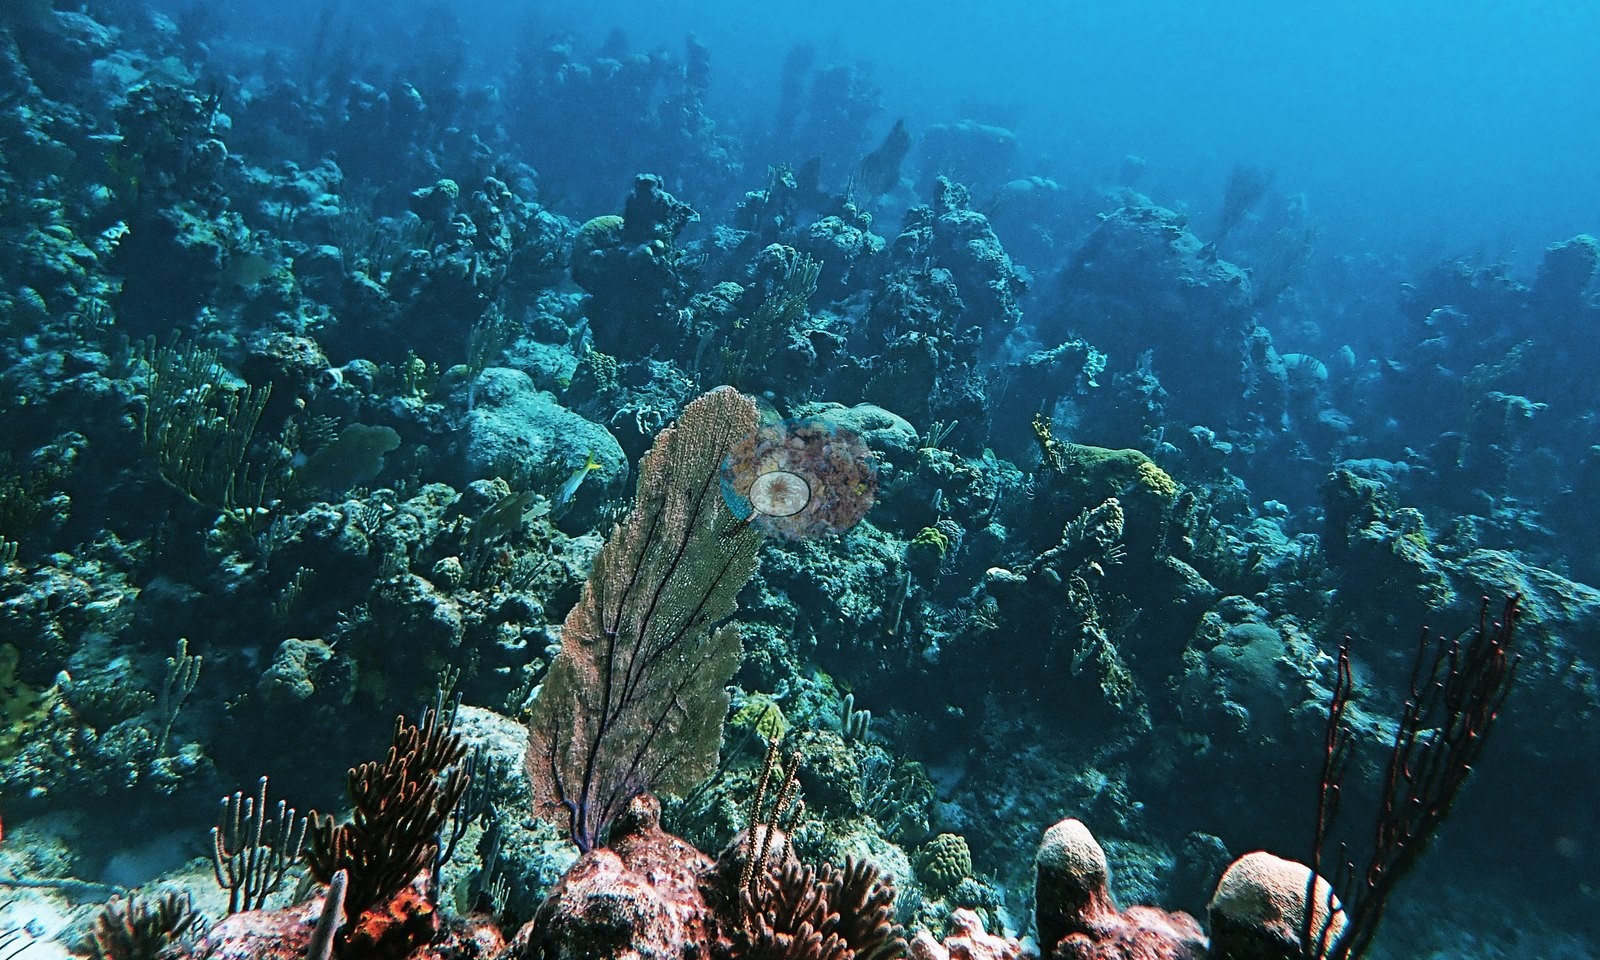
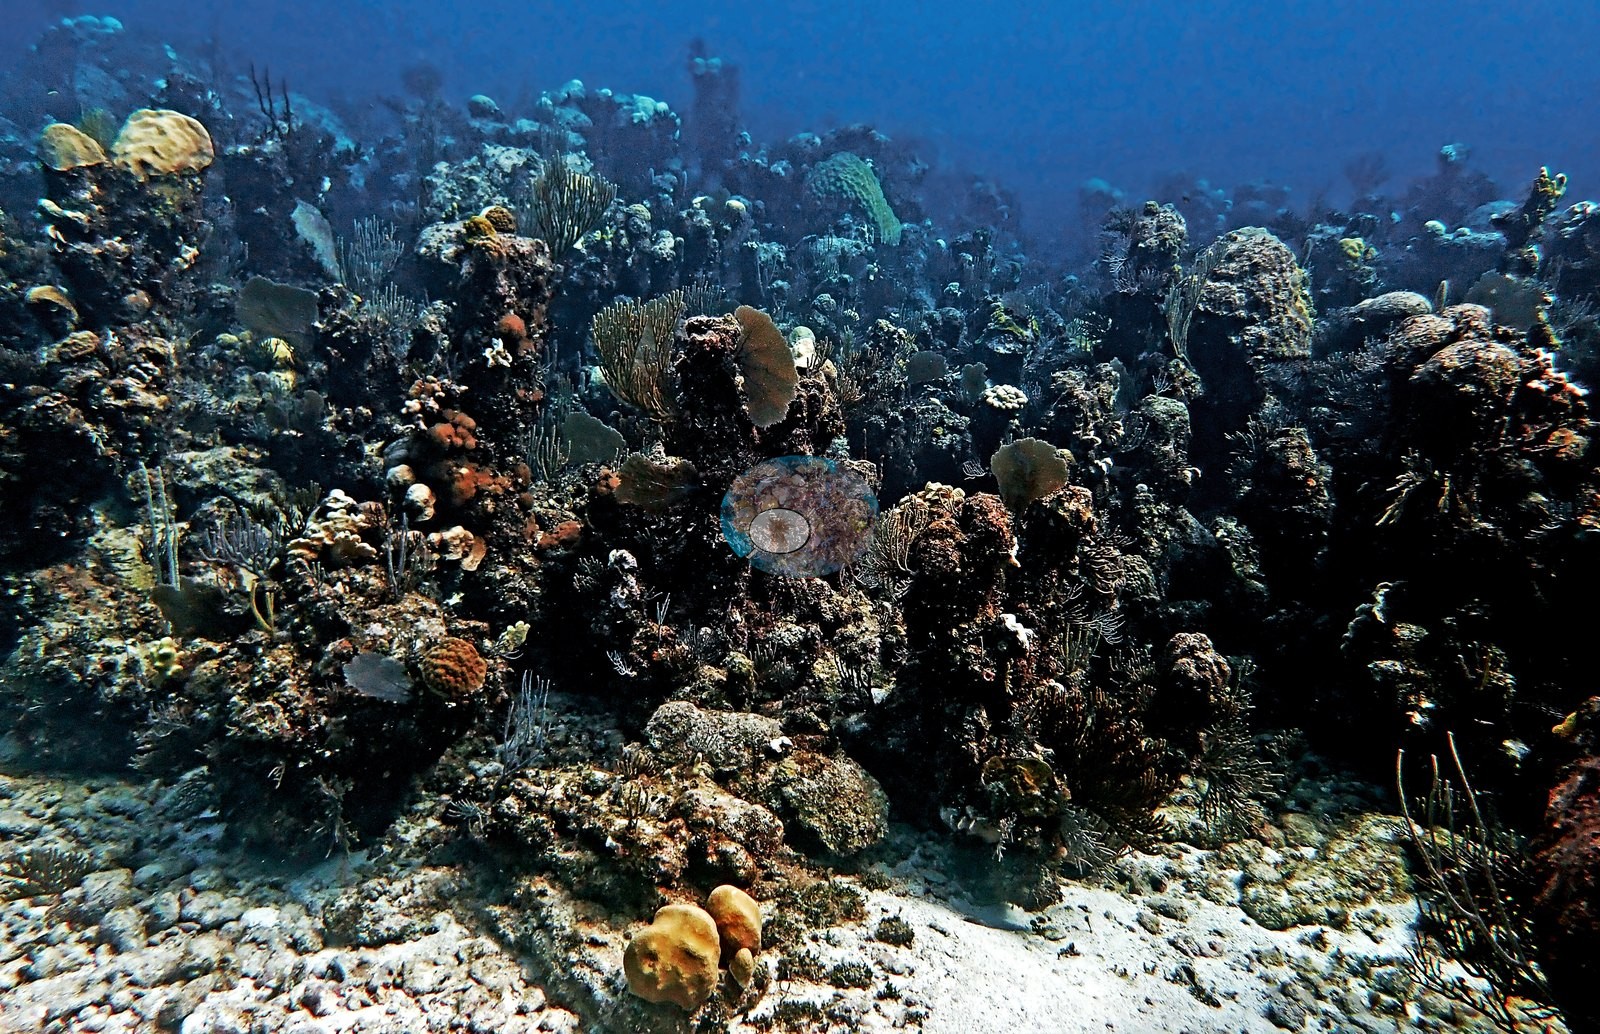
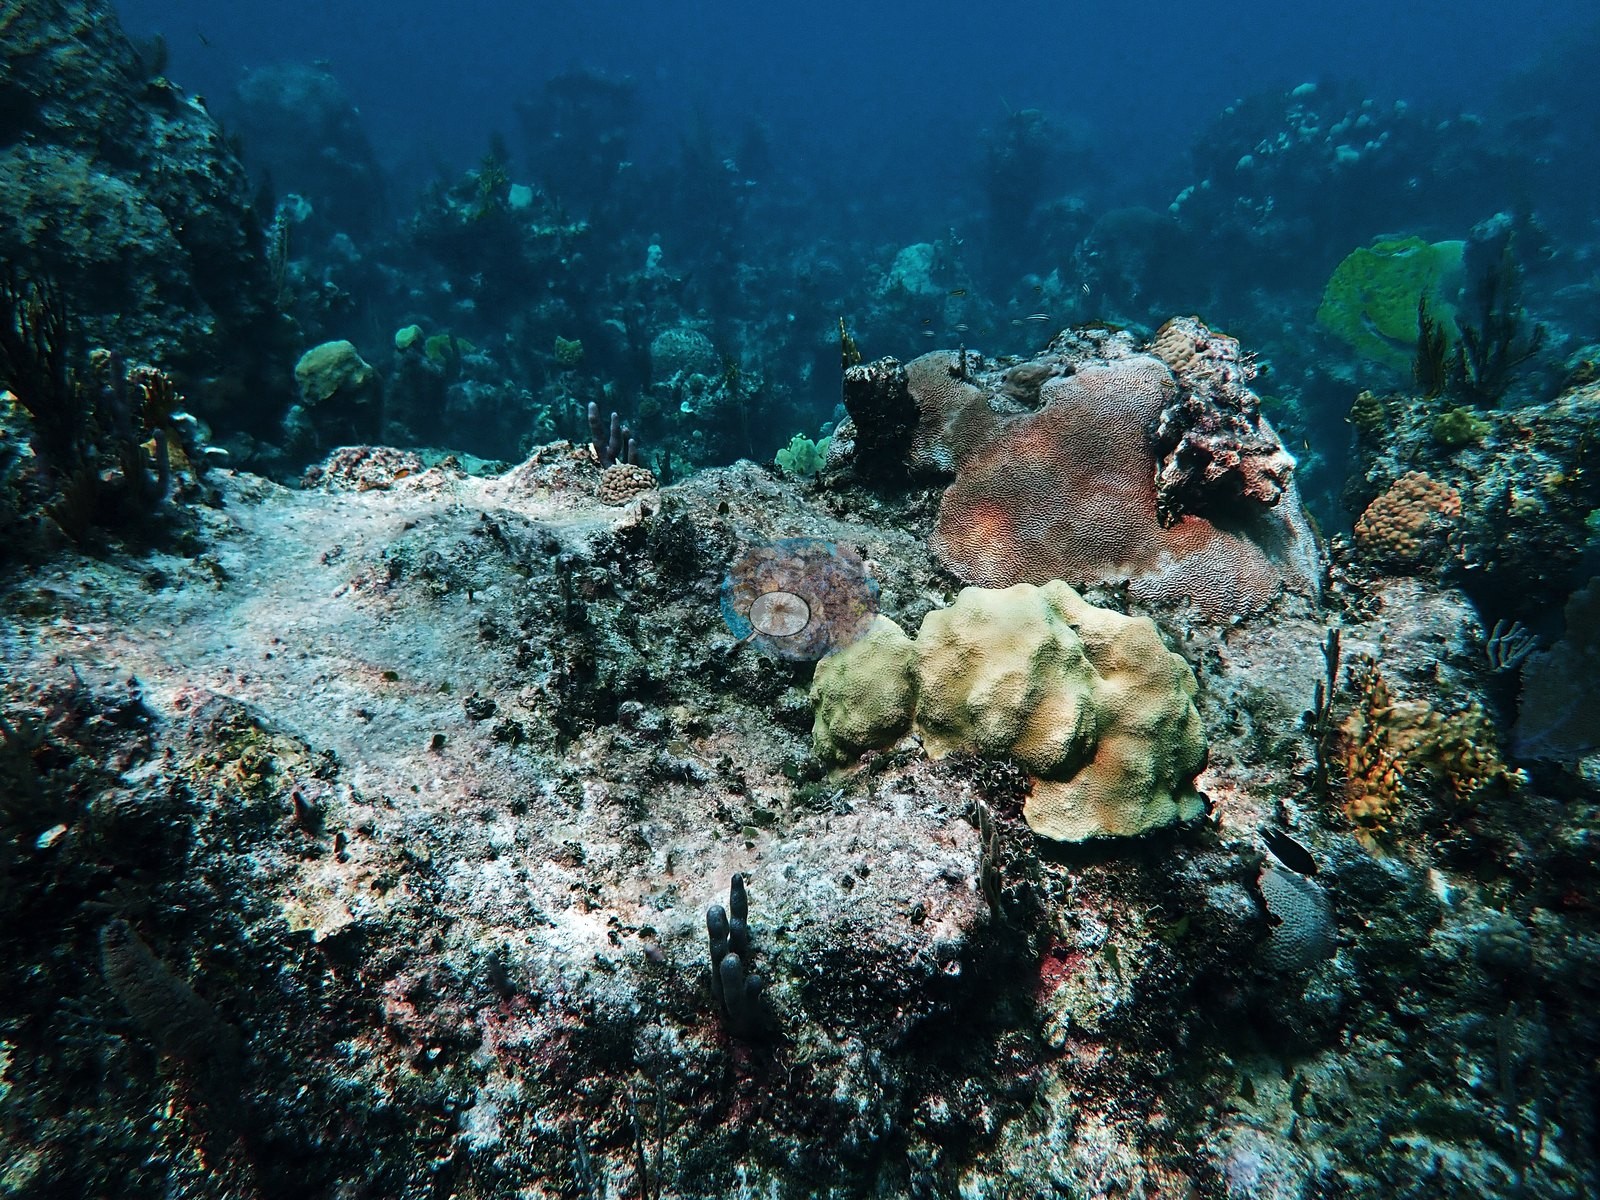
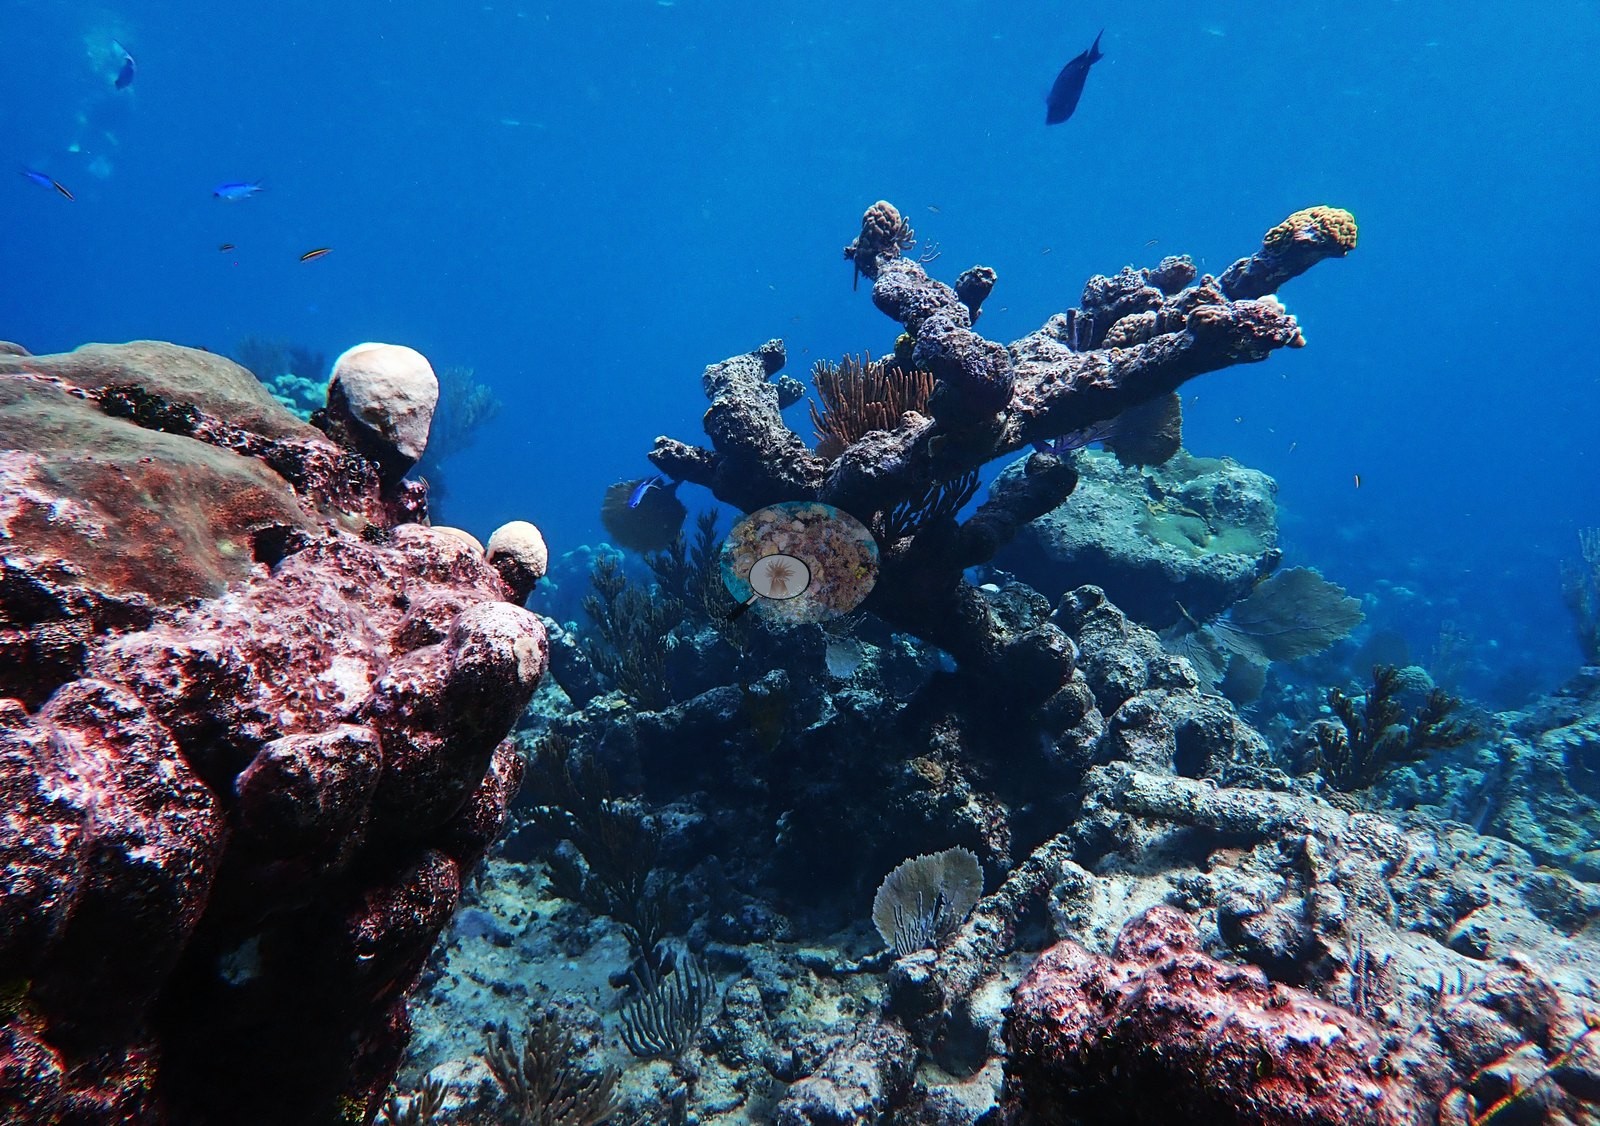
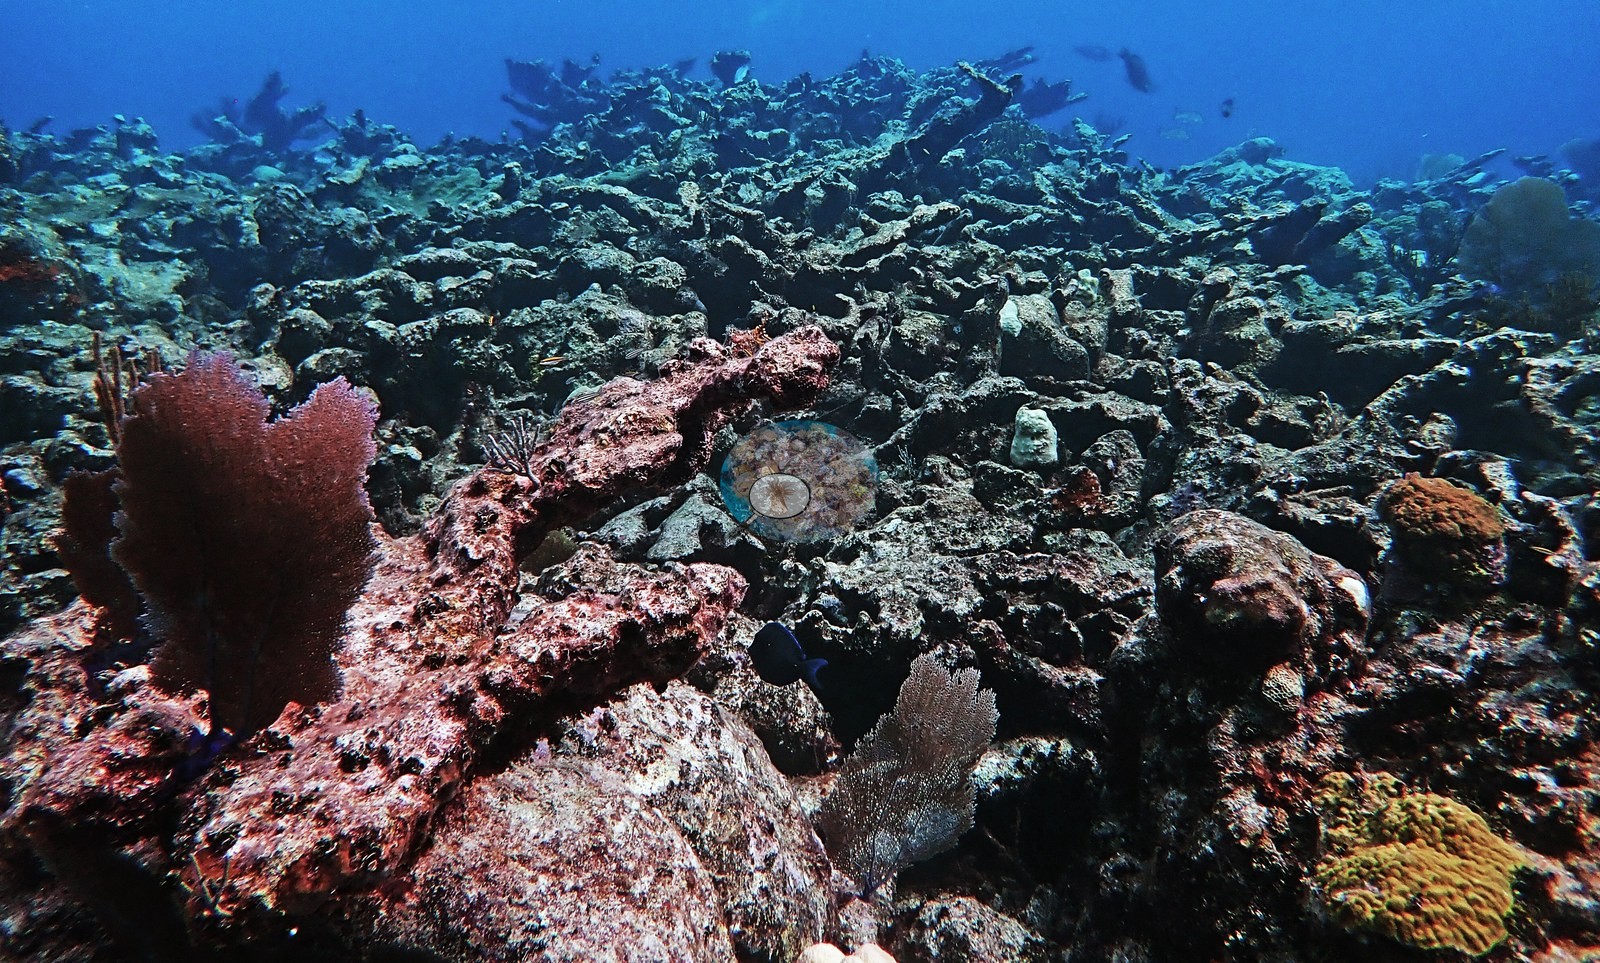
Sponges are abundant and varied - yellow and orange tube and vase sponges, brown barrel and elephant-ear forms, red-brown encrusting sheets, and a large red-brown tube sponge in the foreground of Image 1 (see also Image 6, Image 26, Image 31, Image 44, Image 51, Image 66, Image 81, Image 90, Image 92).
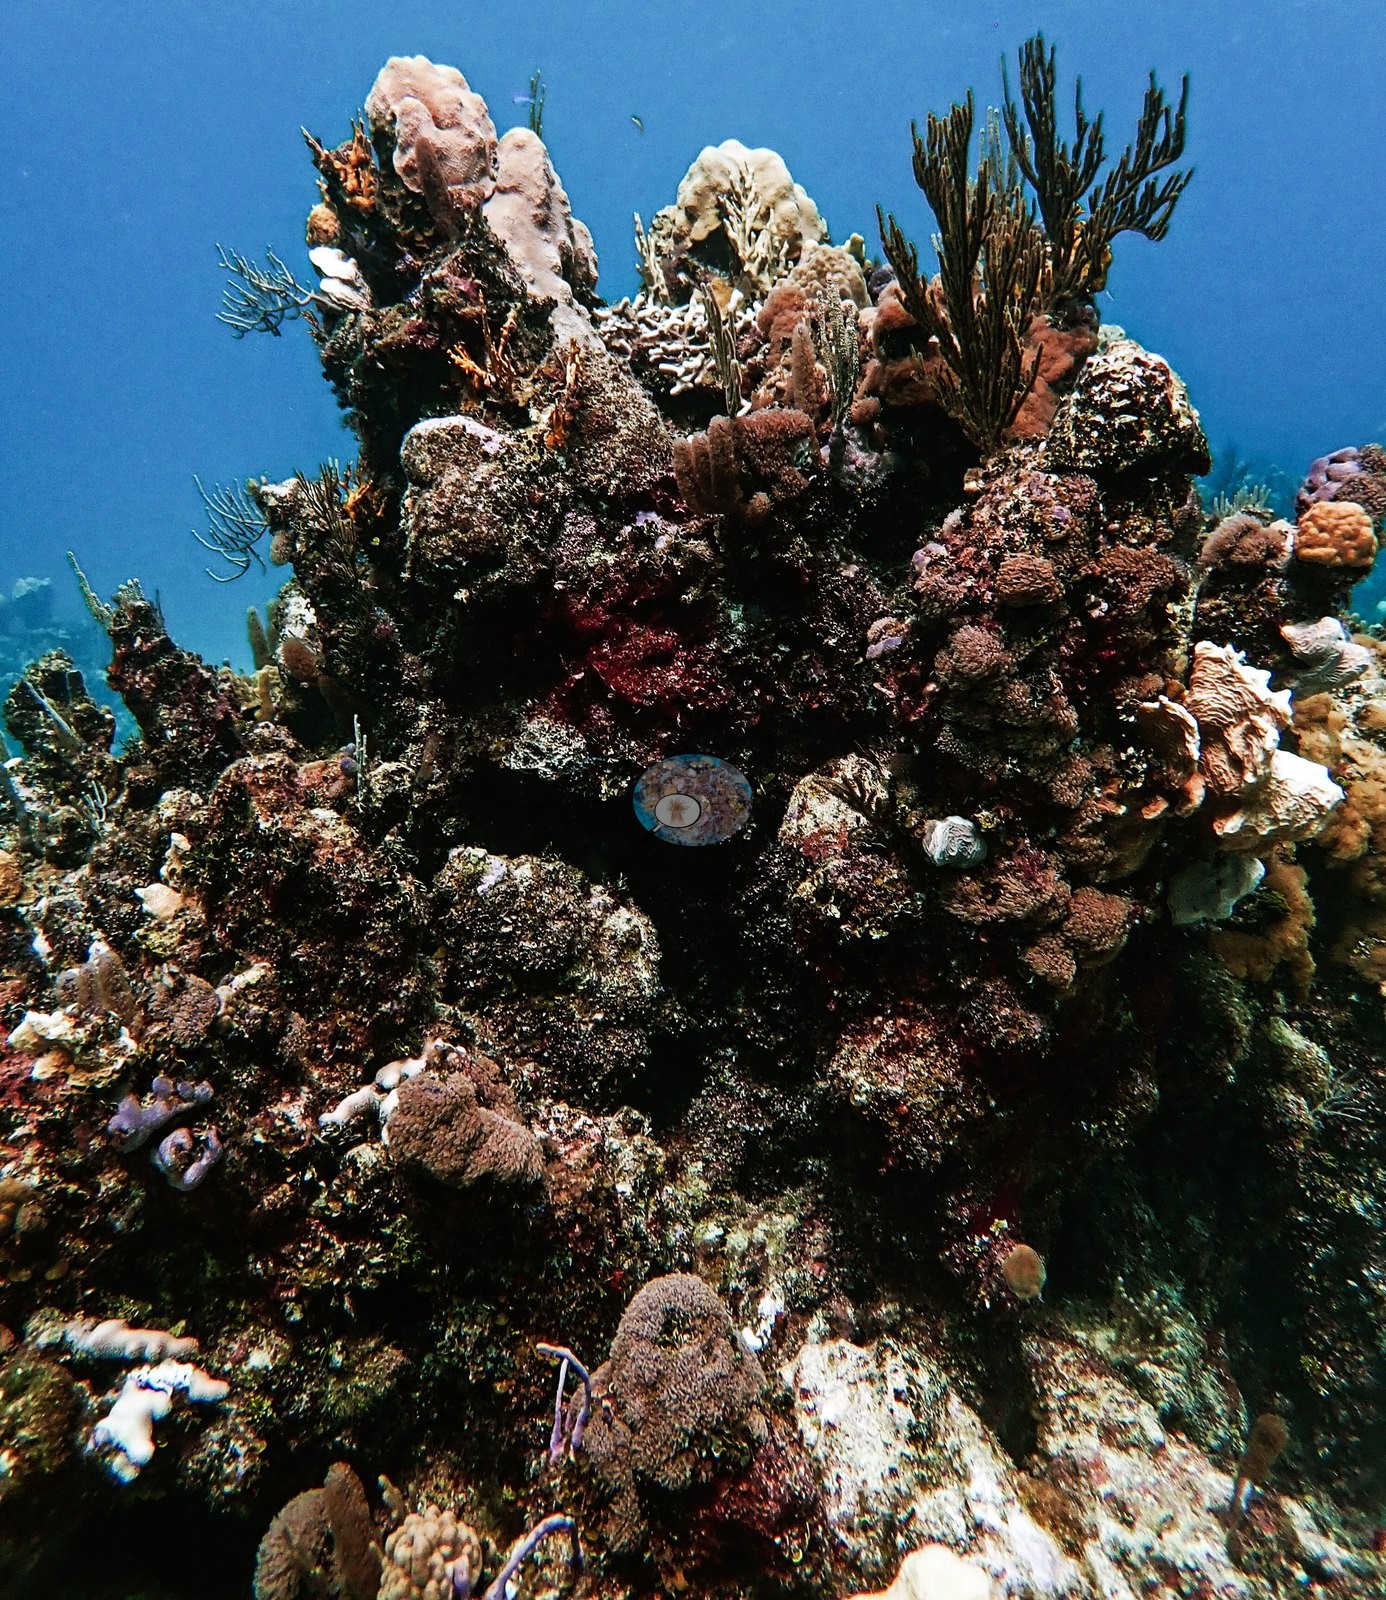
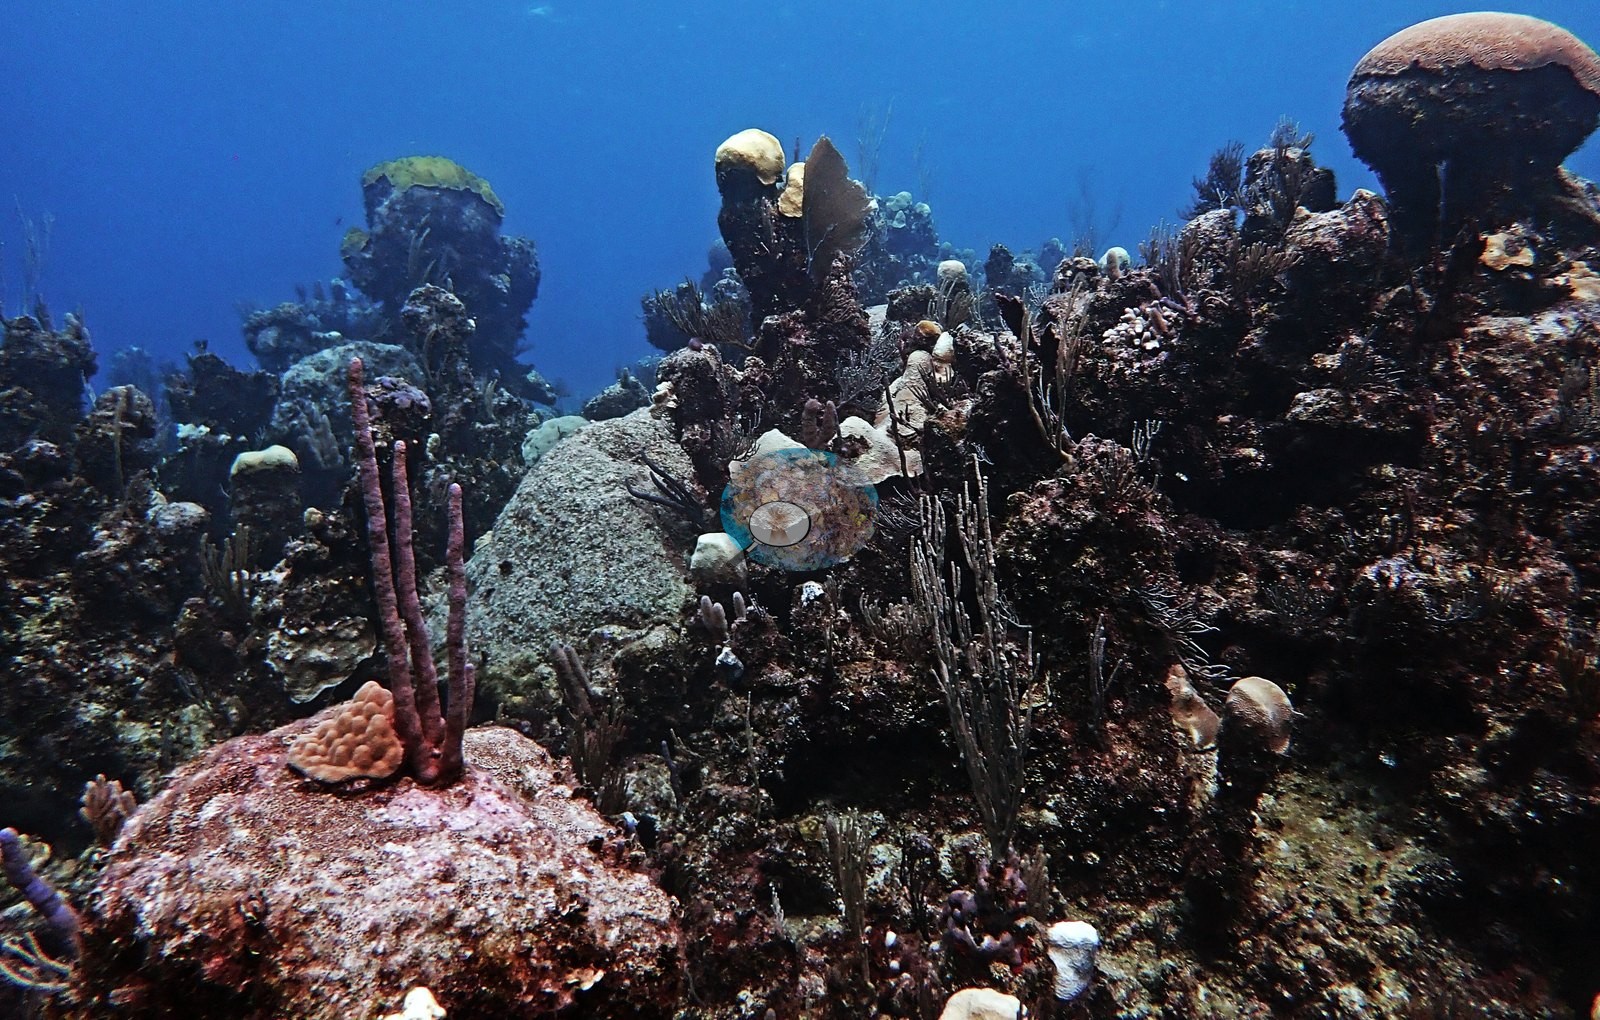
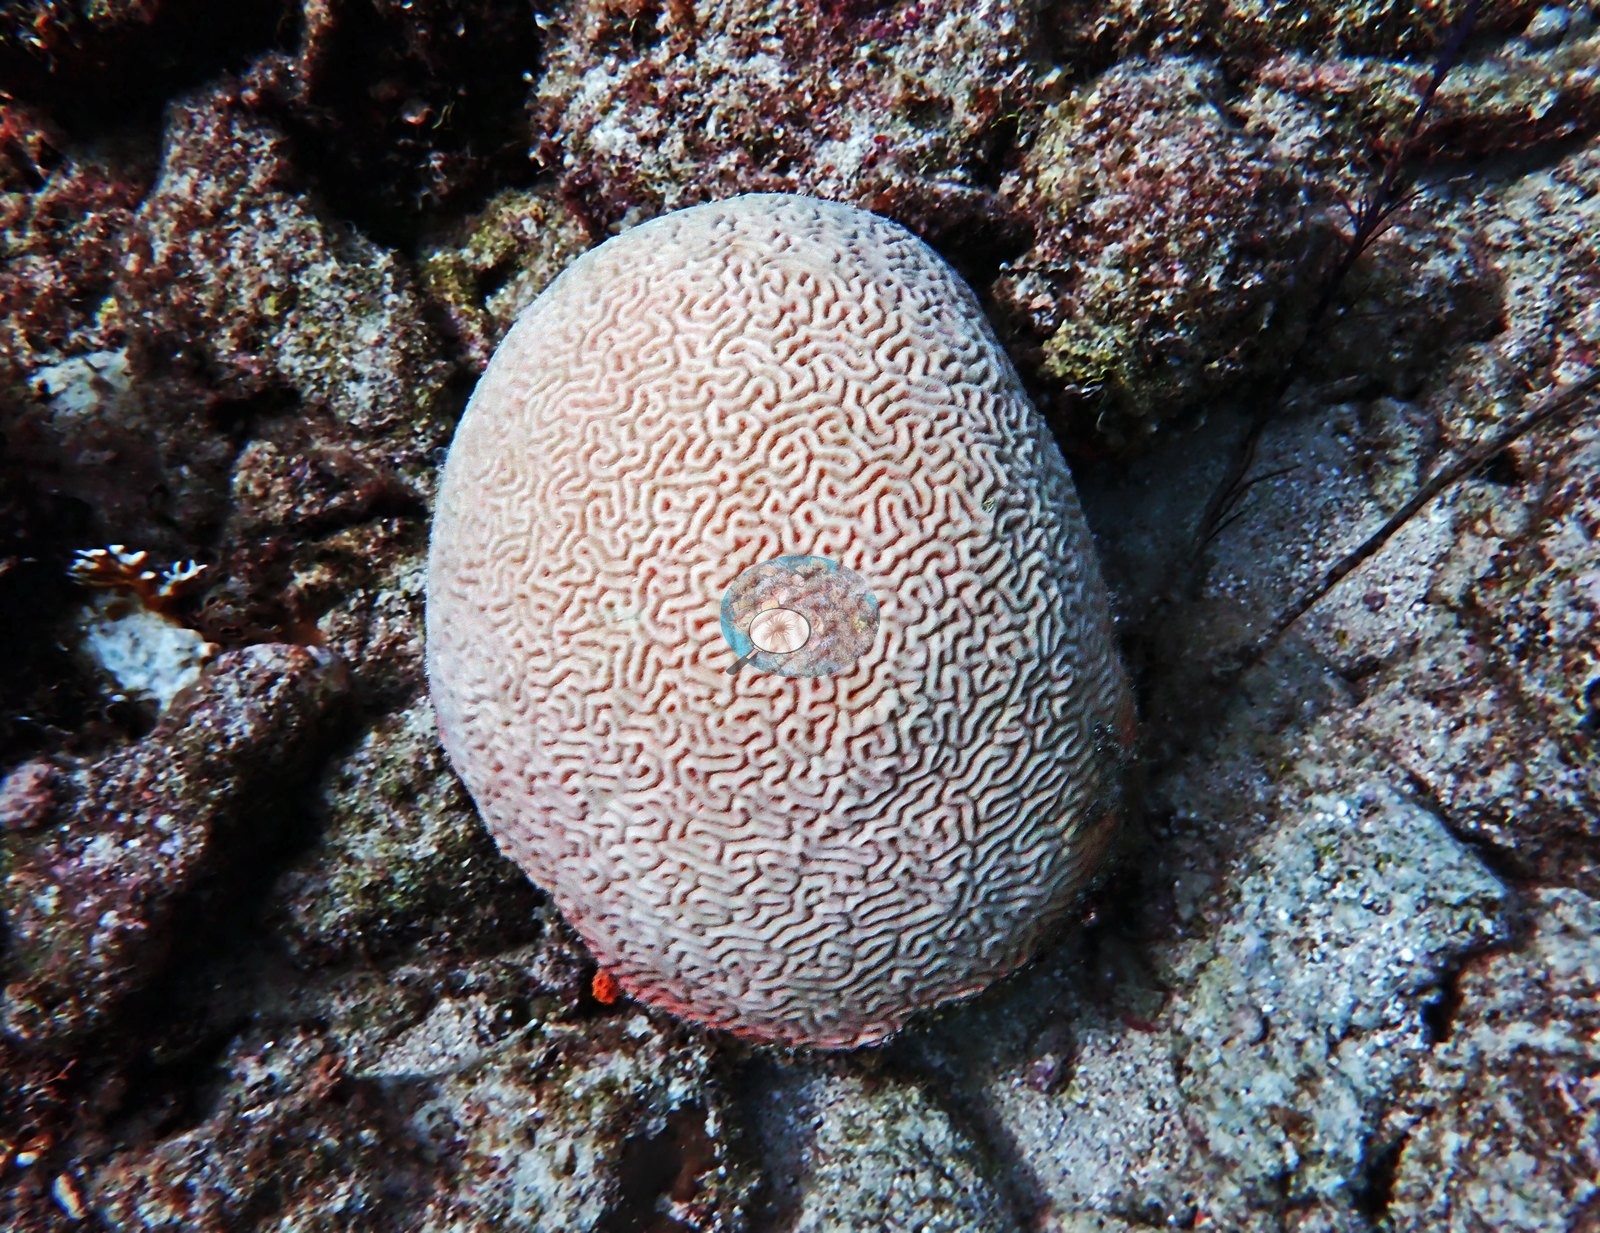
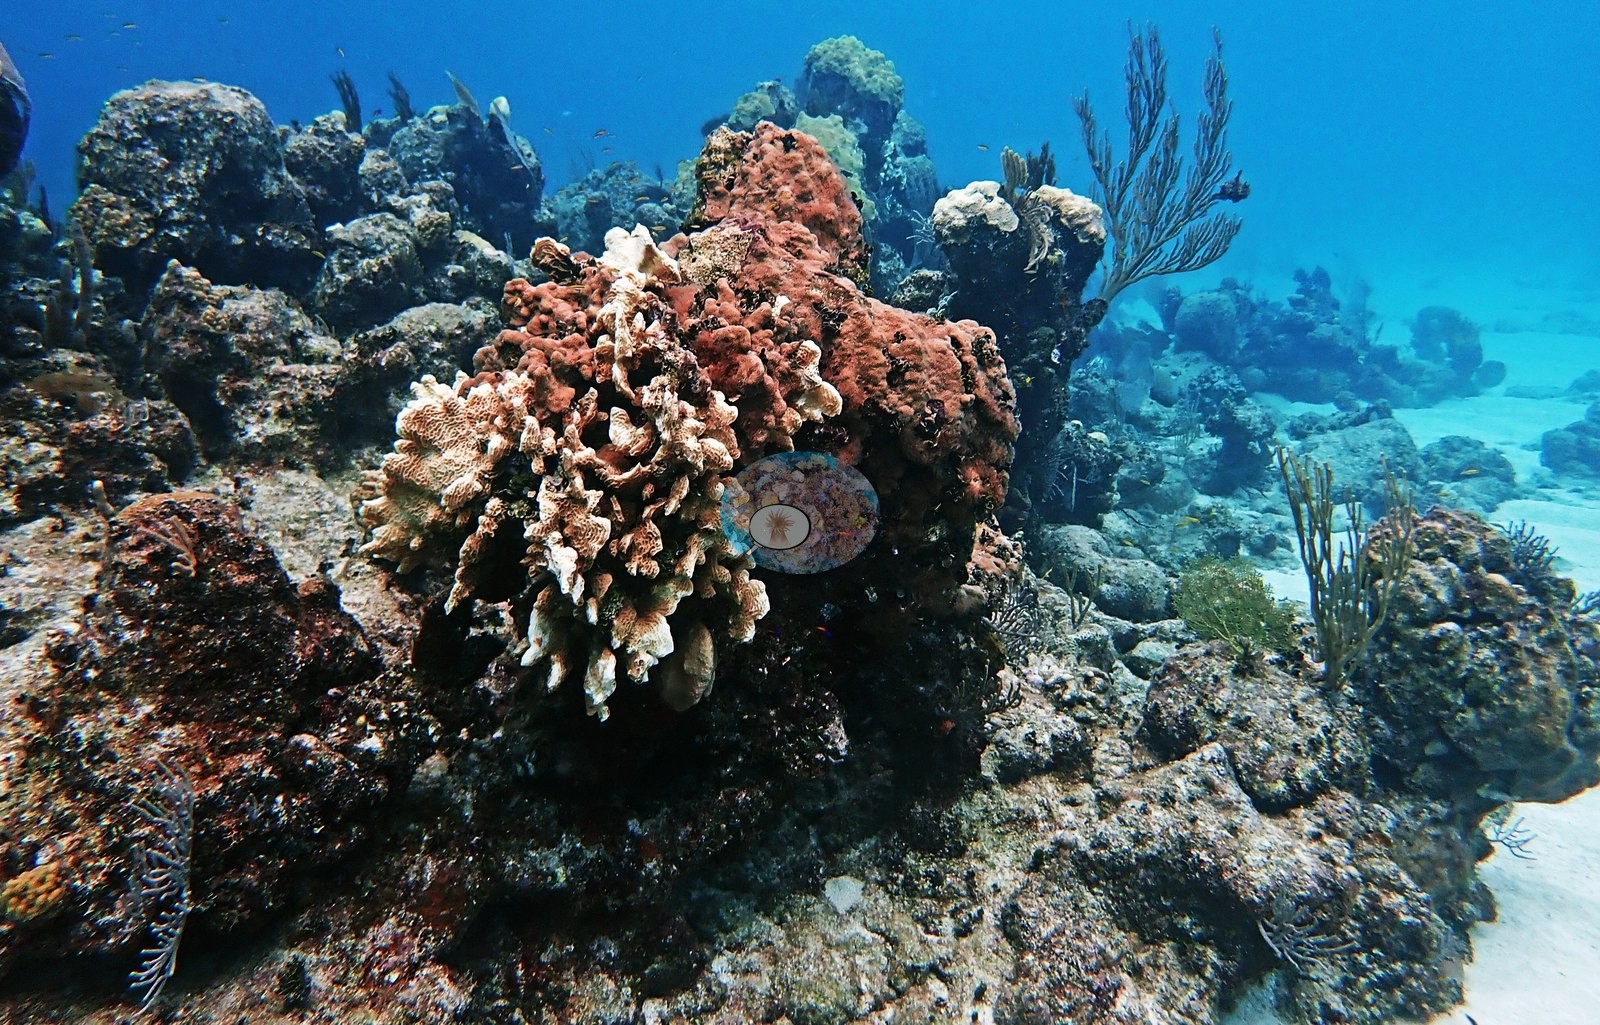
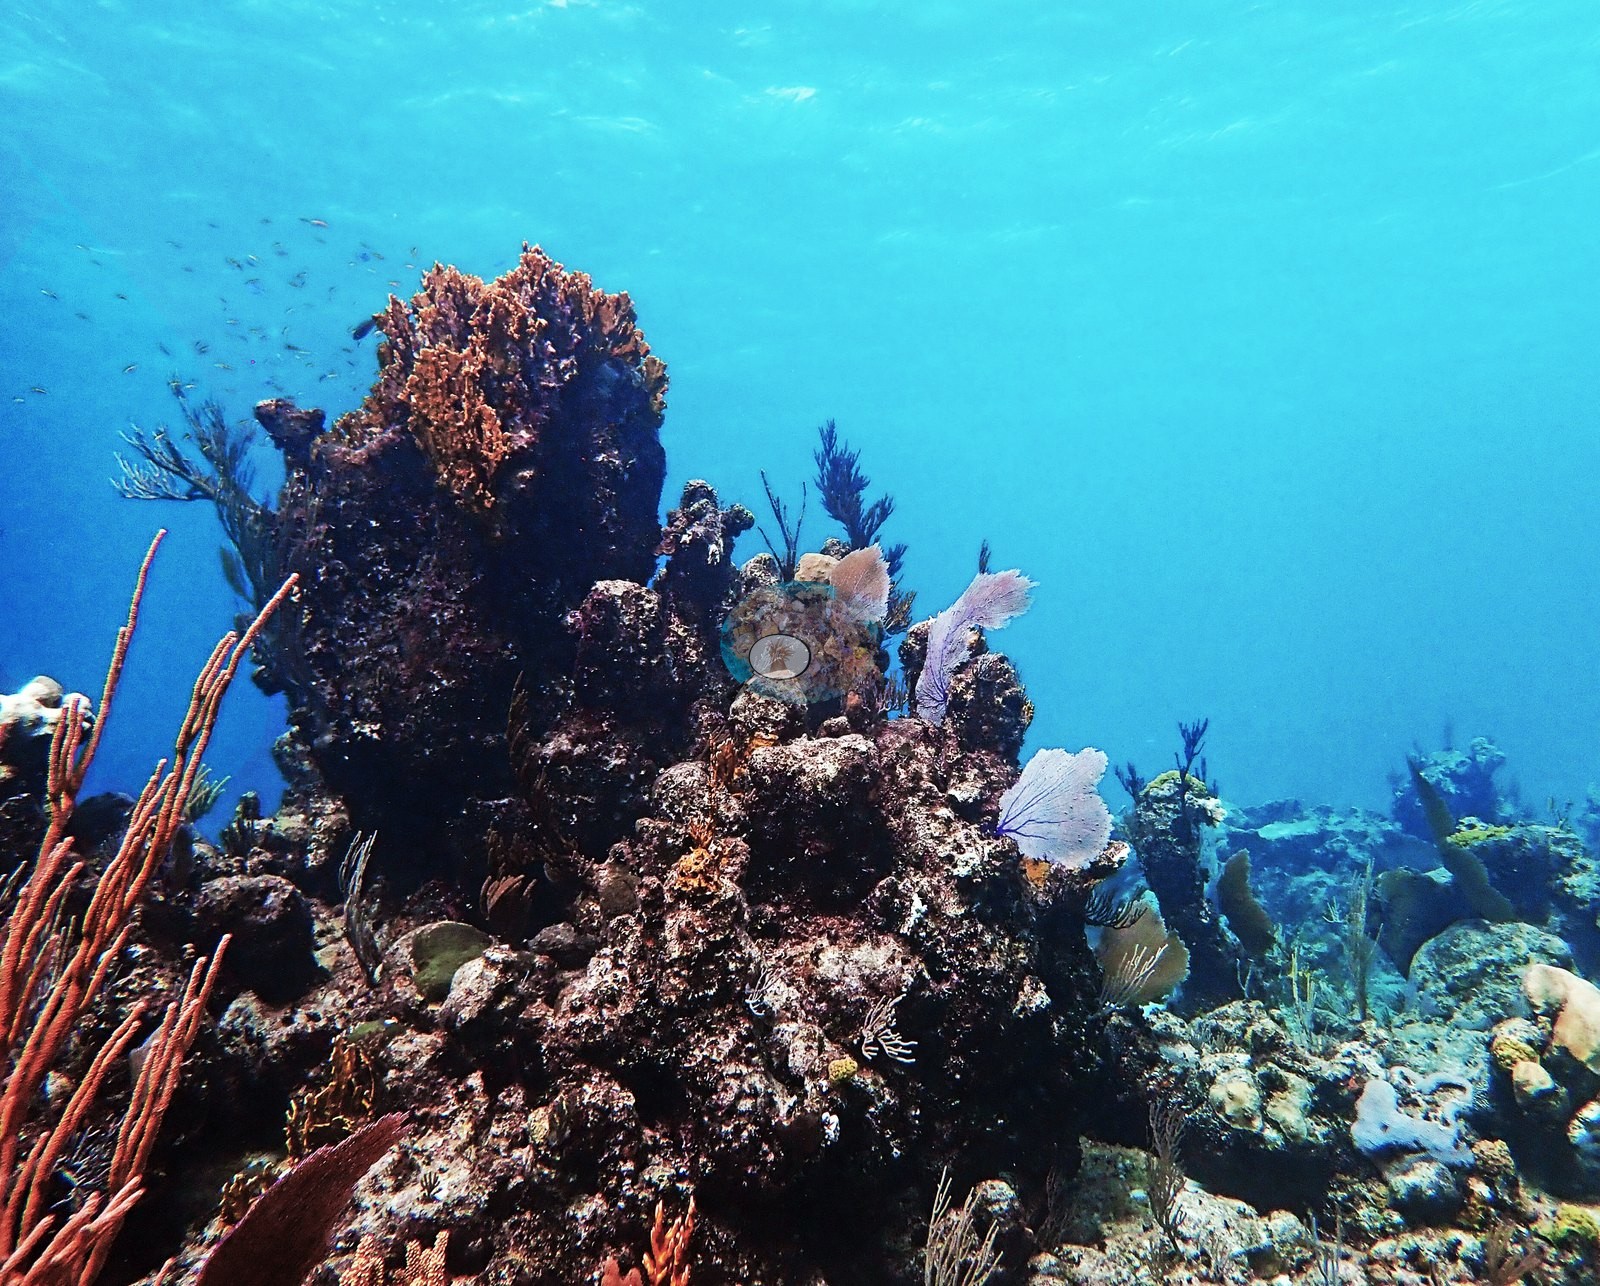
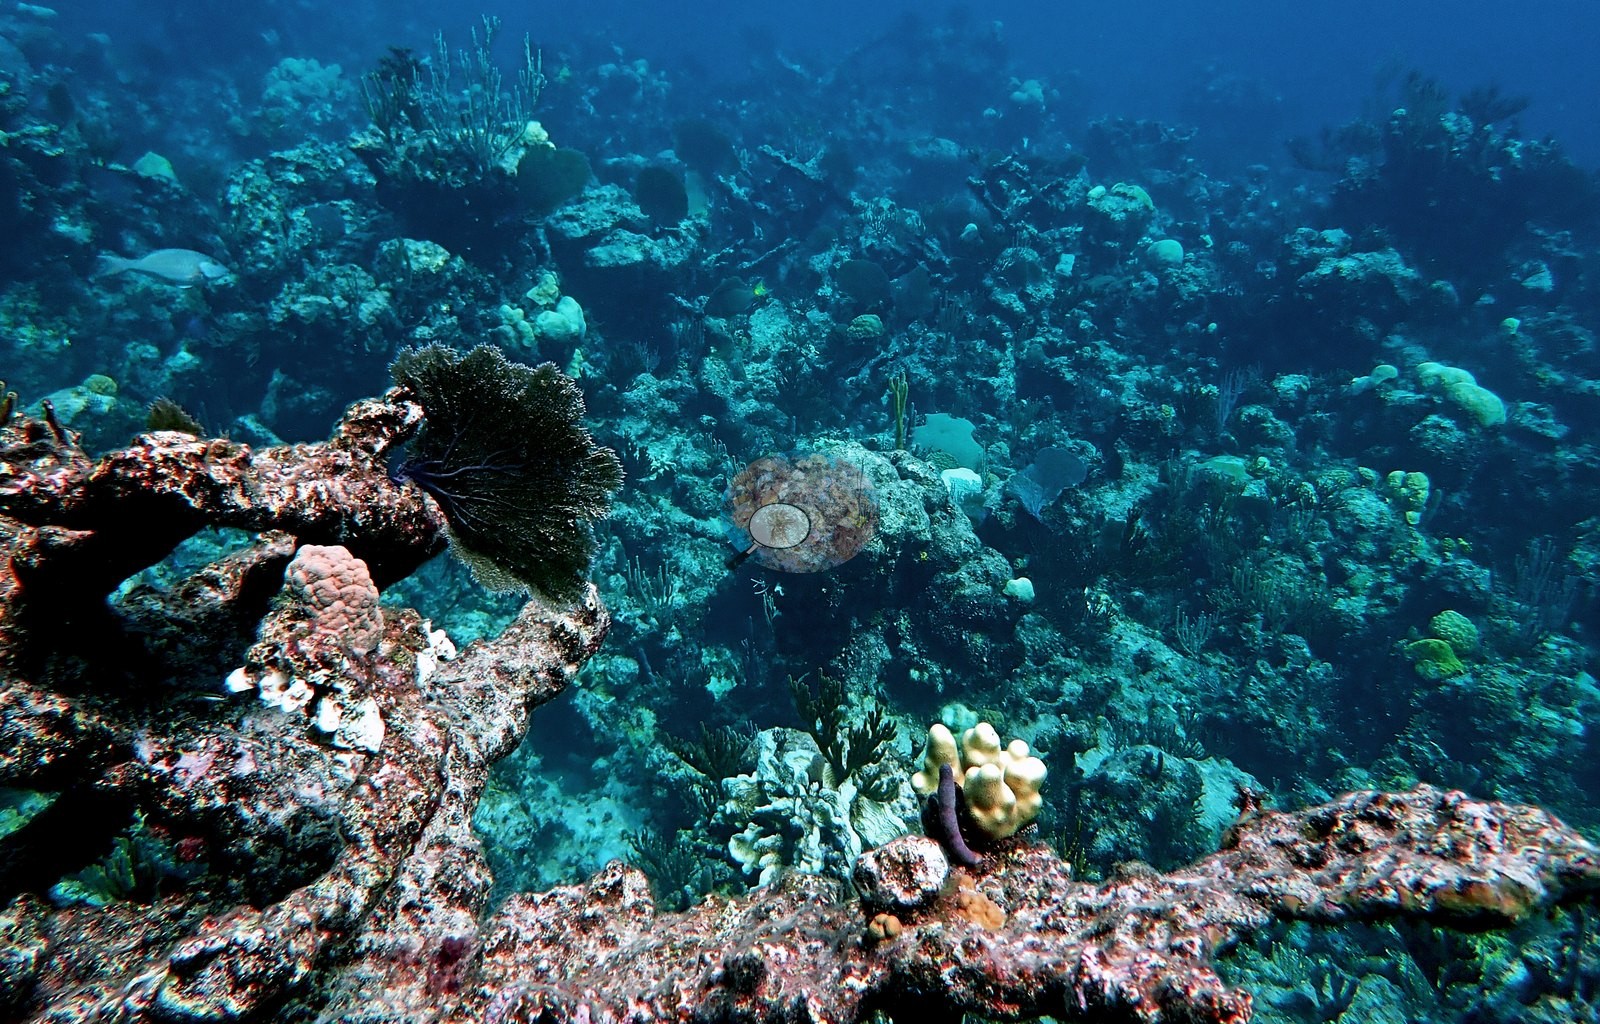
Small orange crinoid arms and bushy black-coral clumps occupy the shaded crevices (e.g., Image 10, Image 17, Image 41).
Coral cover
- Reference: Claude CV point count (this site's photos)
- Coral cover: 7.9% — a blind Claude computer-vision point count of 117 of Anderson's edited photographs (20 points per photo; water, fish, and obstructions excluded). Other computer-vision methods are listed in the method table.
Stressors
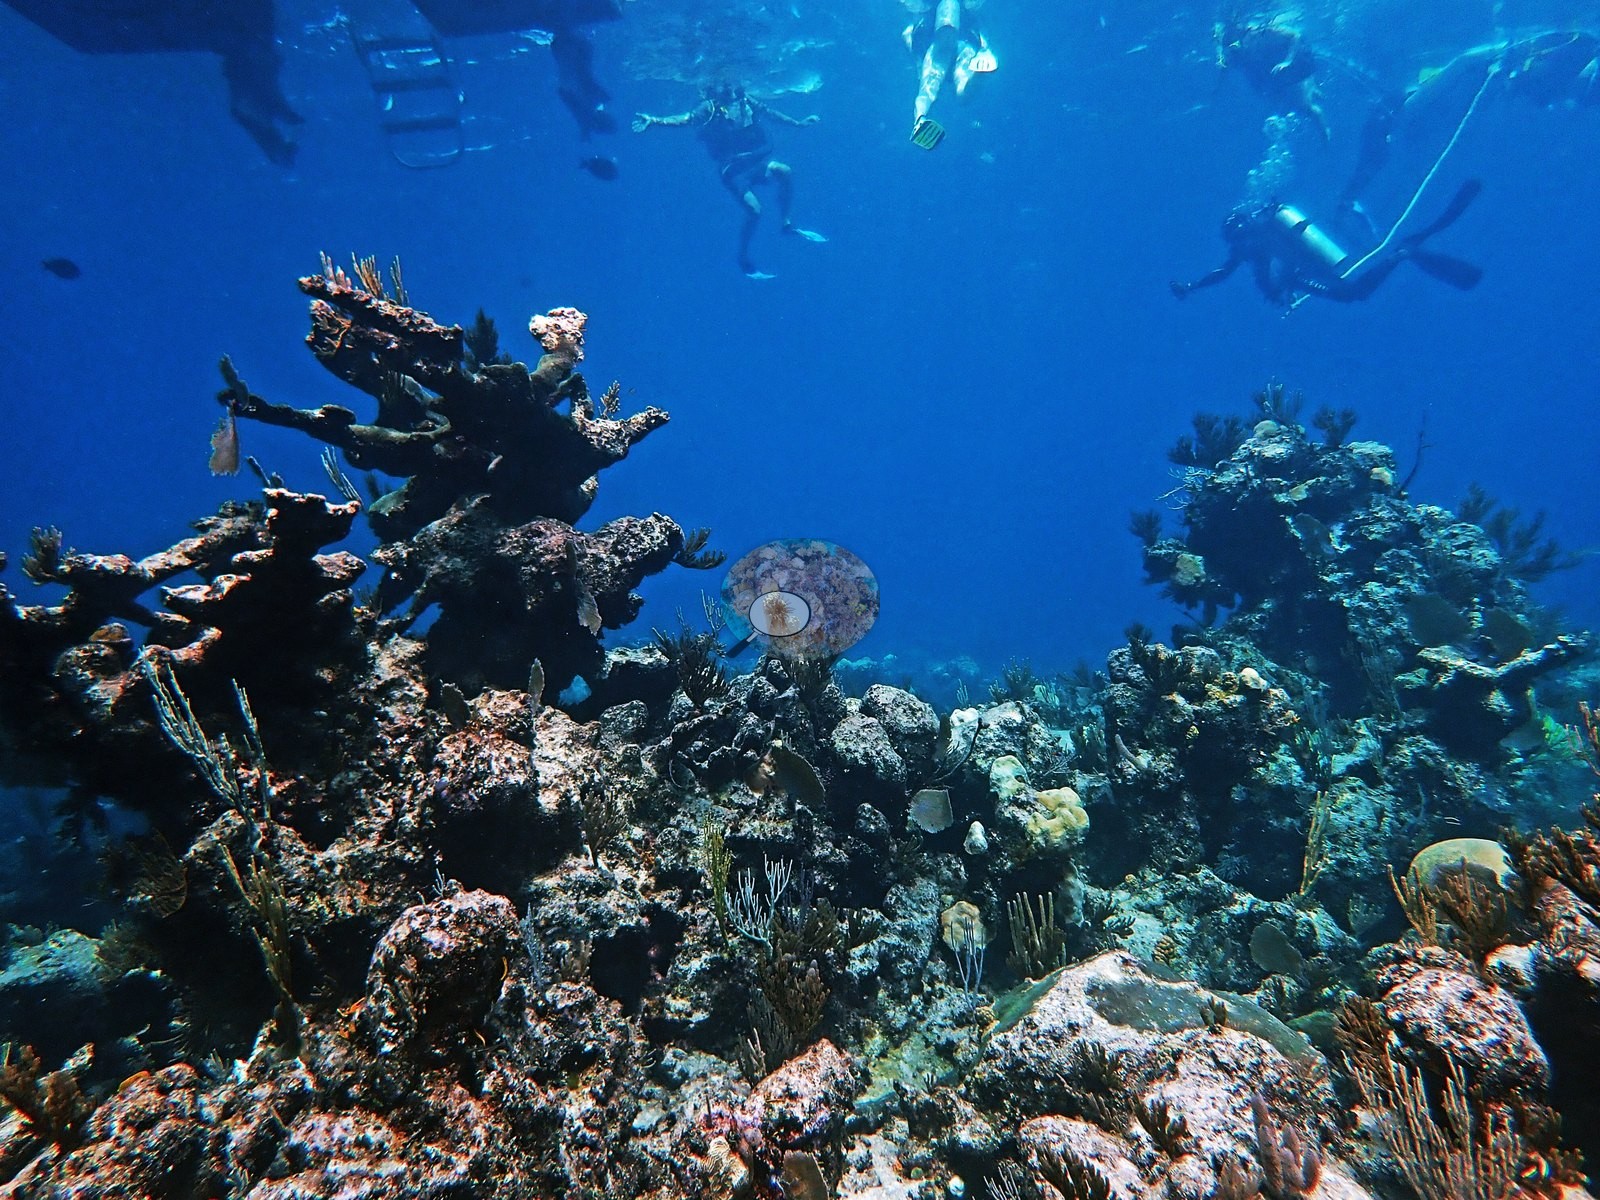
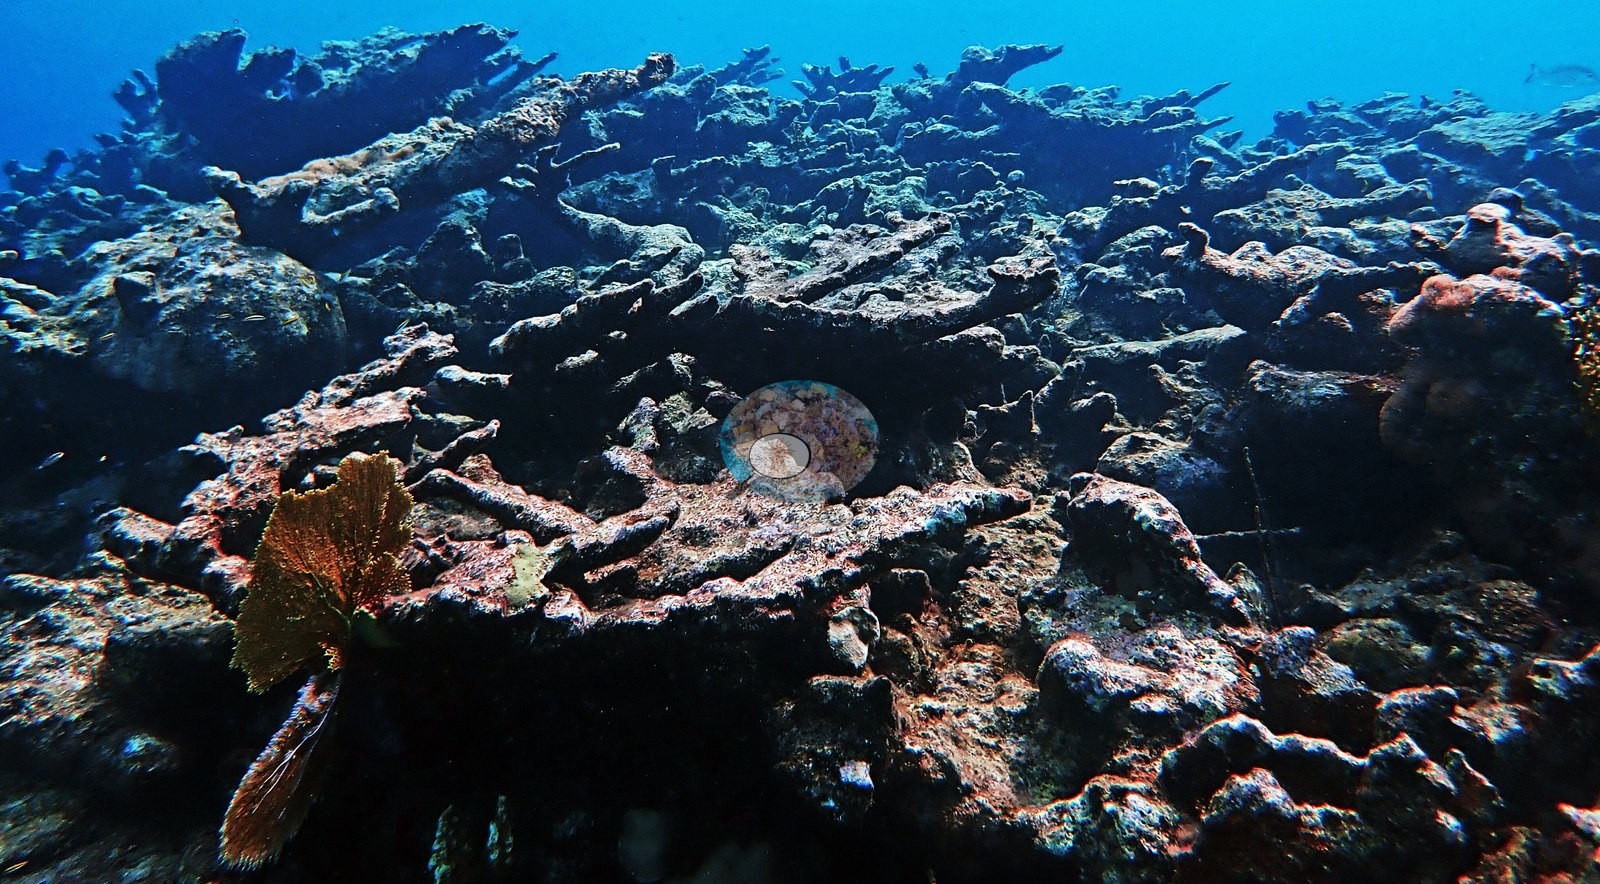
Standing dead elkhorn framework is the signature structure. Anderson's own frame labels call it out - "Apalm framework" (e.g., Image 1), "dead apalm" (e.g., Image 115), "palmata graveyard" (e.g., Image 117) - and it shows up repeatedly as ranks of thick blades and branches, upright or toppled, rounded off at the tips and crusted in mauve coralline algae, turf, and sponge (e.g., Image 7, Image 80, Image 86, Image 99, Image 100, Image 104, Image 107, Image 108).
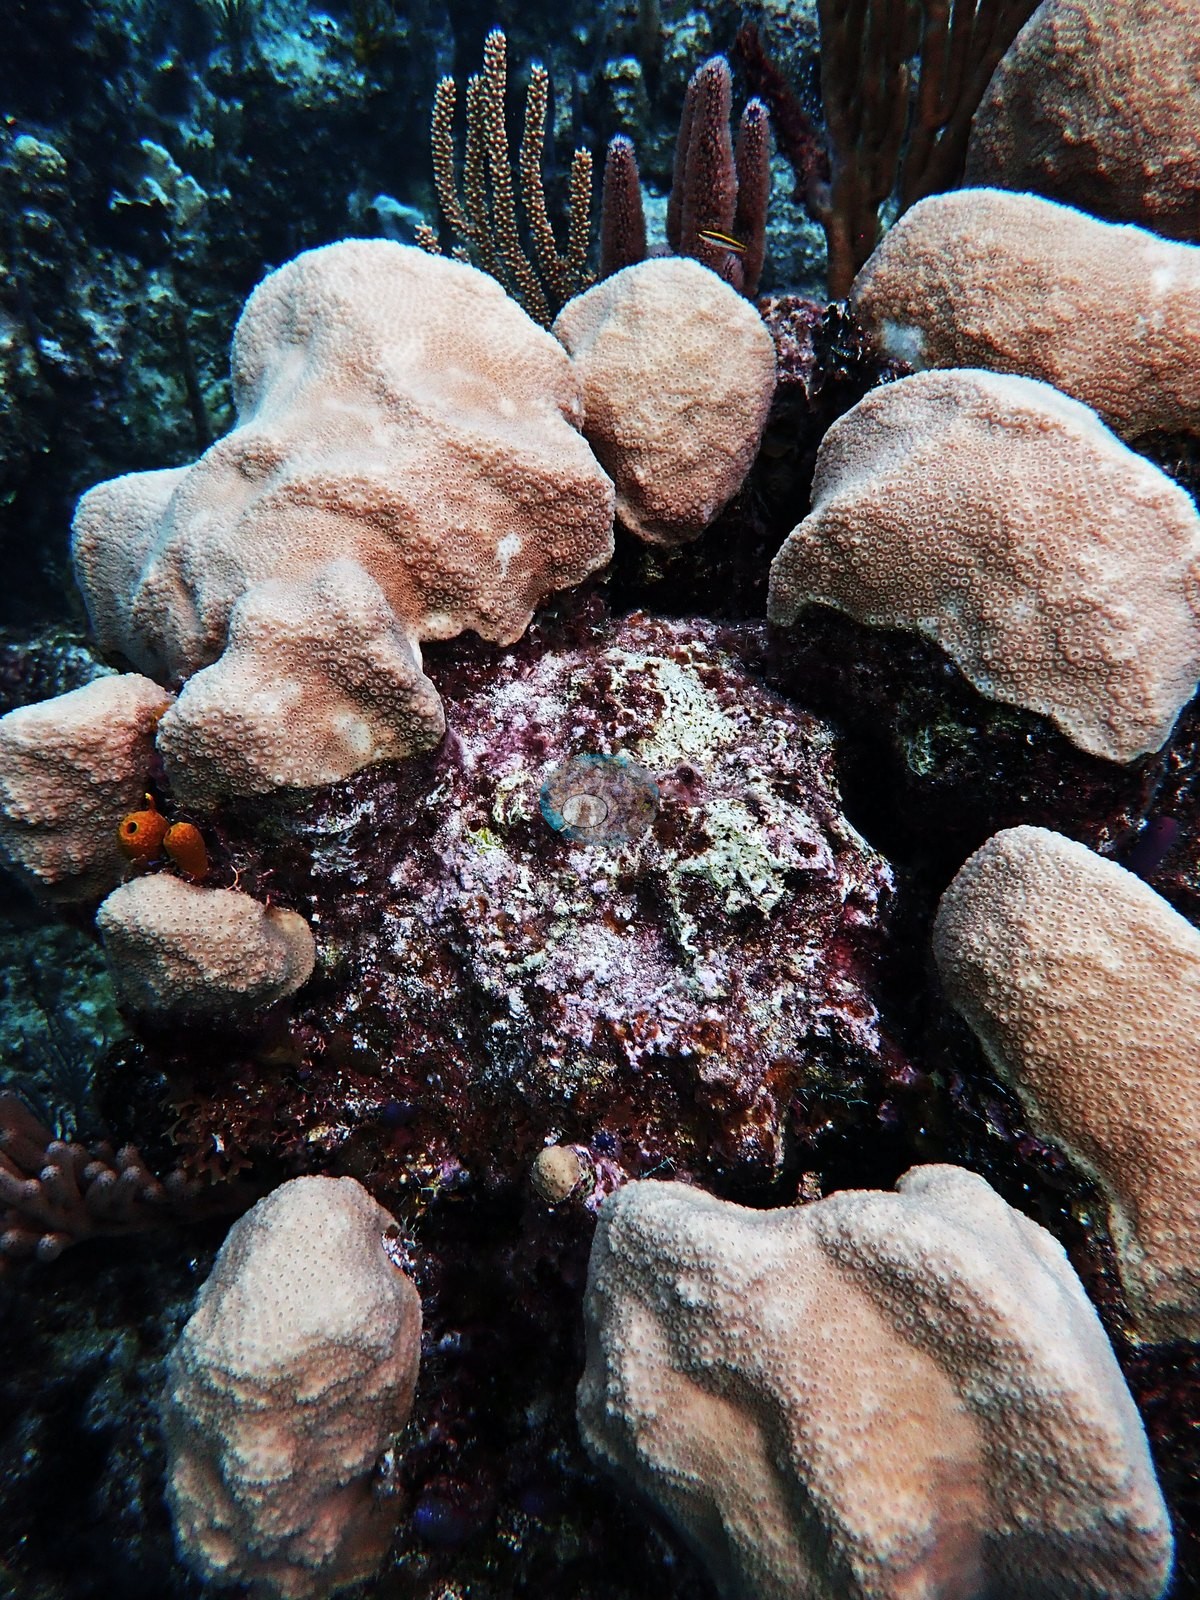
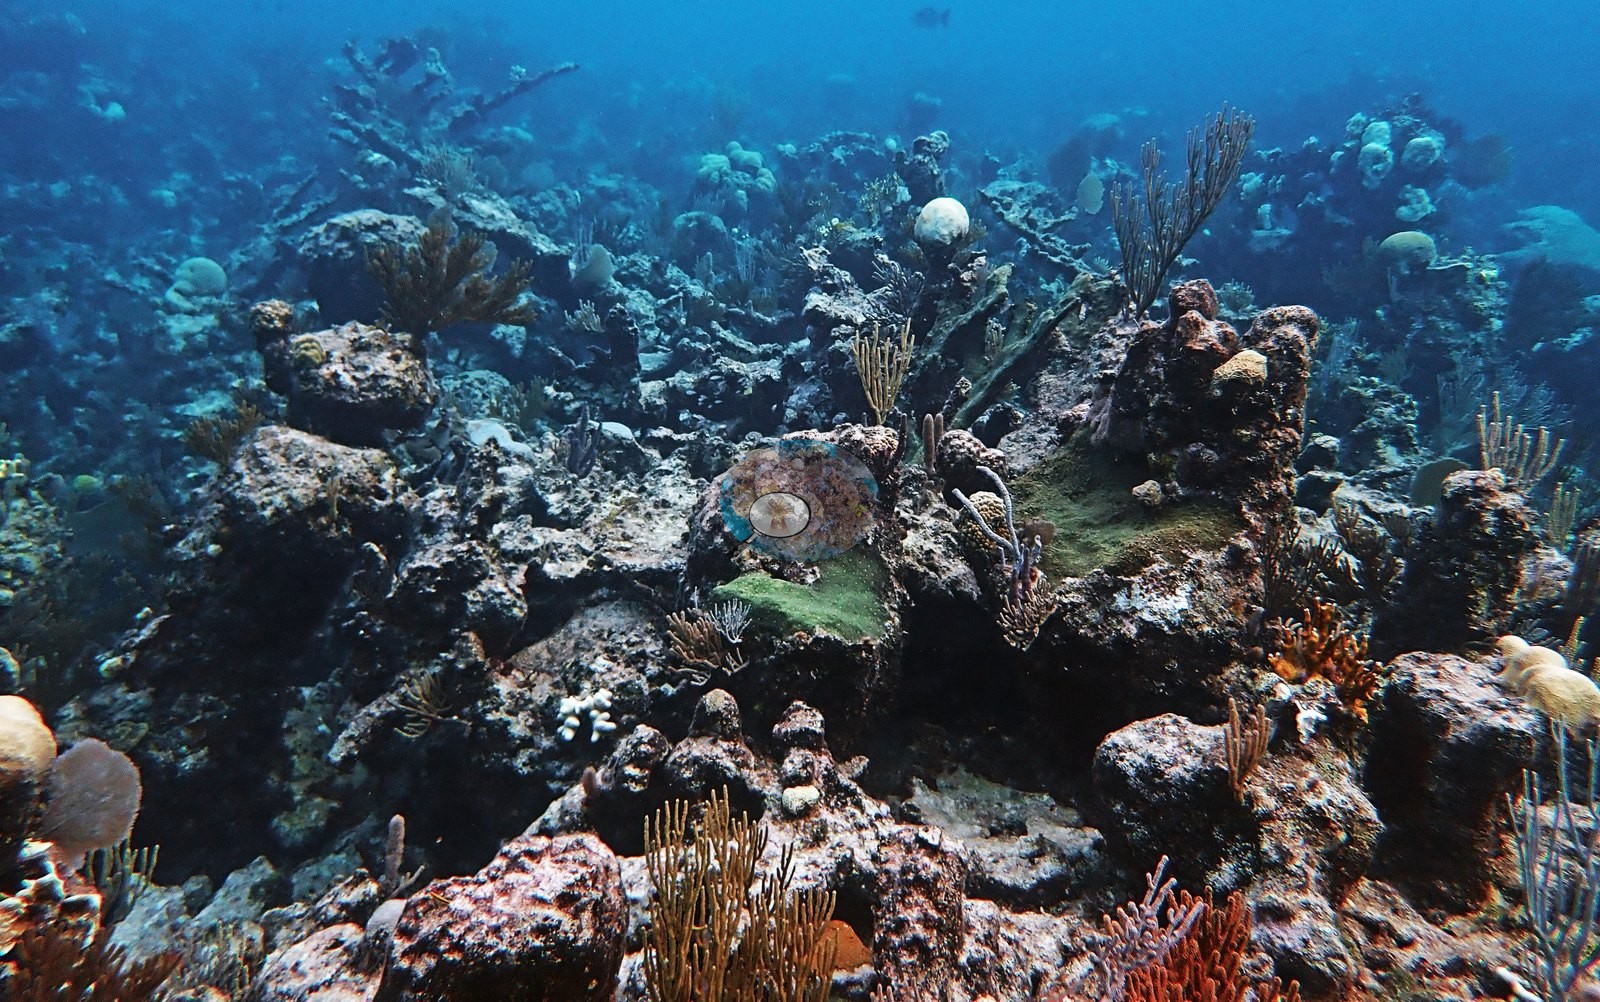
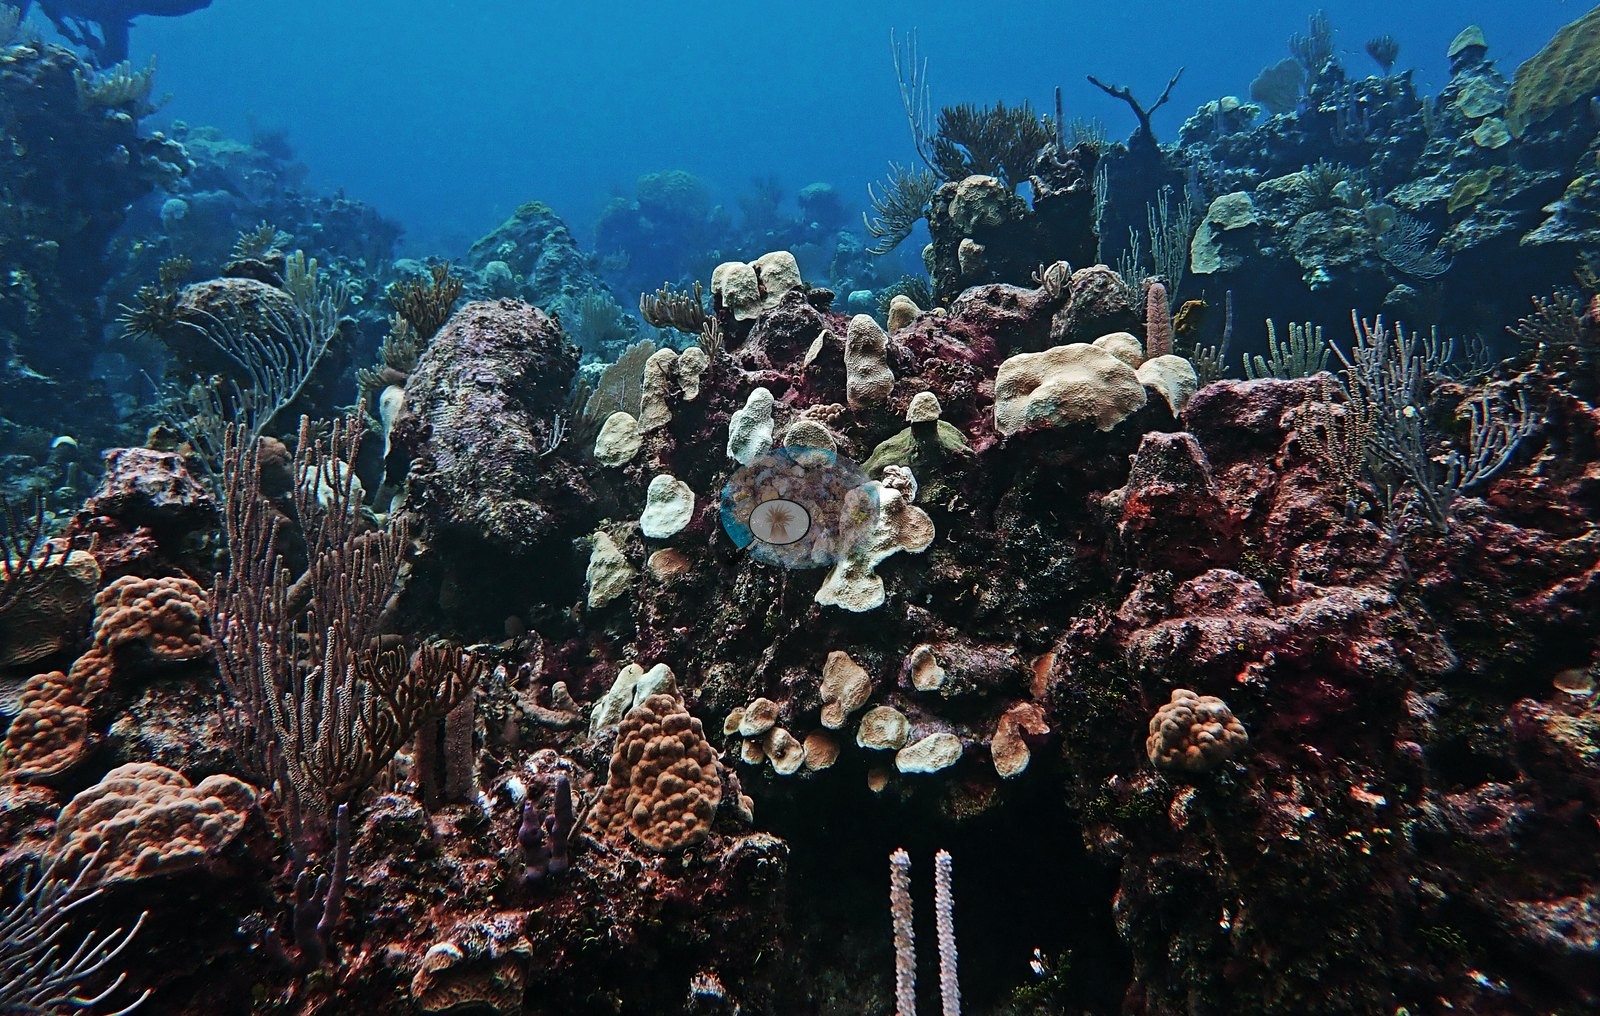
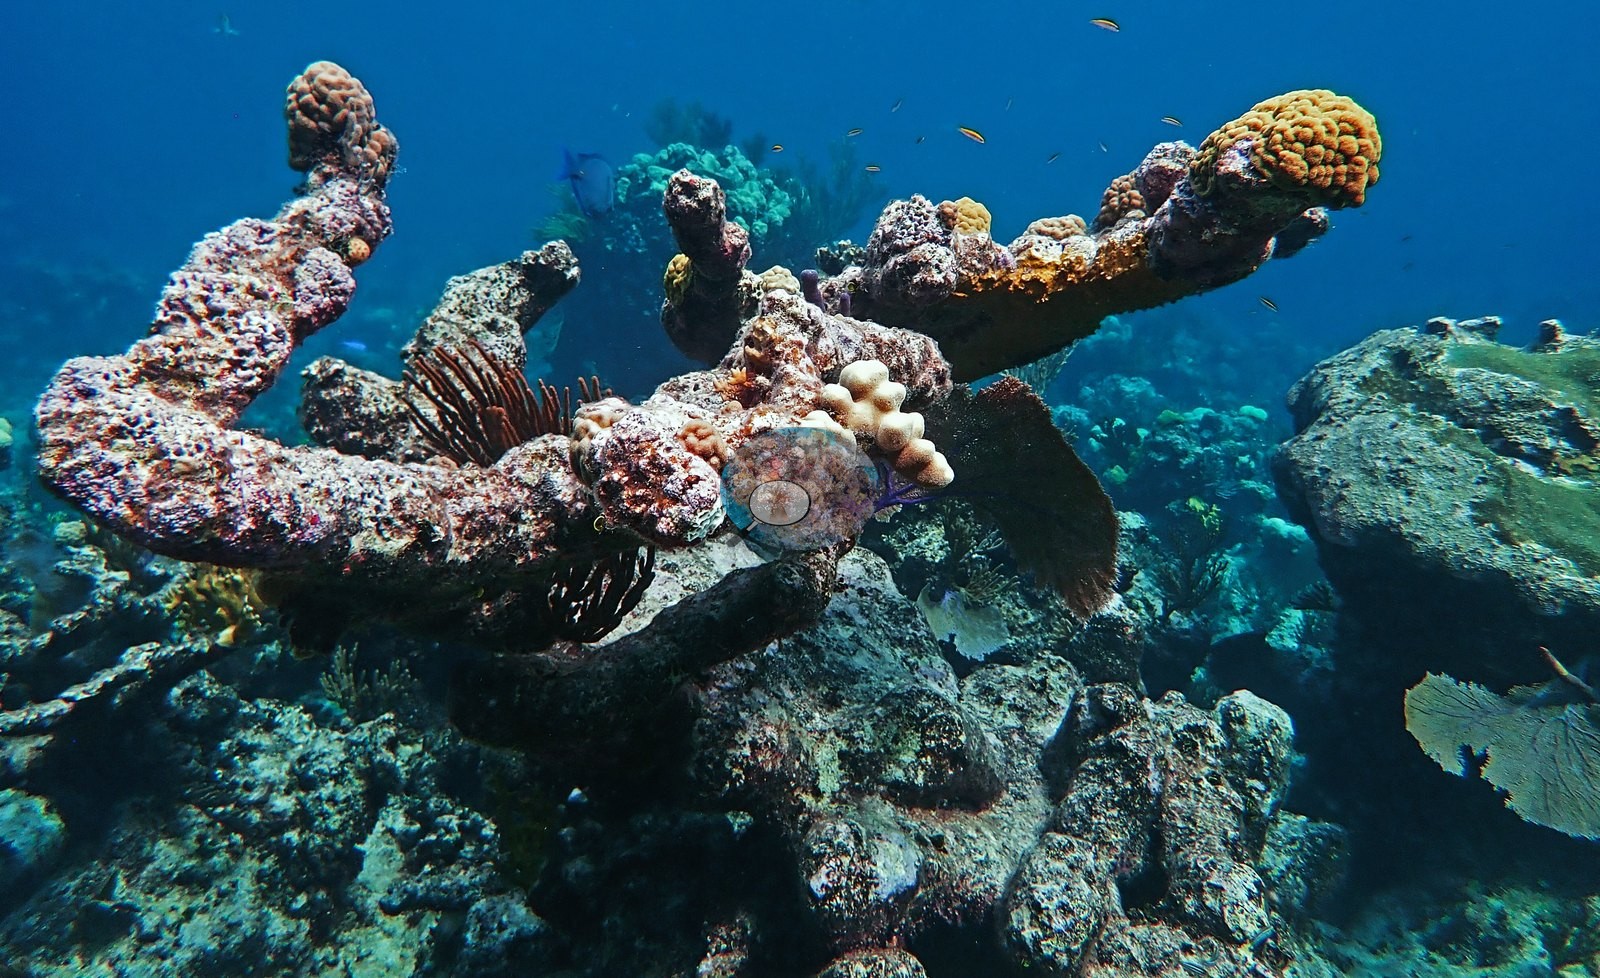
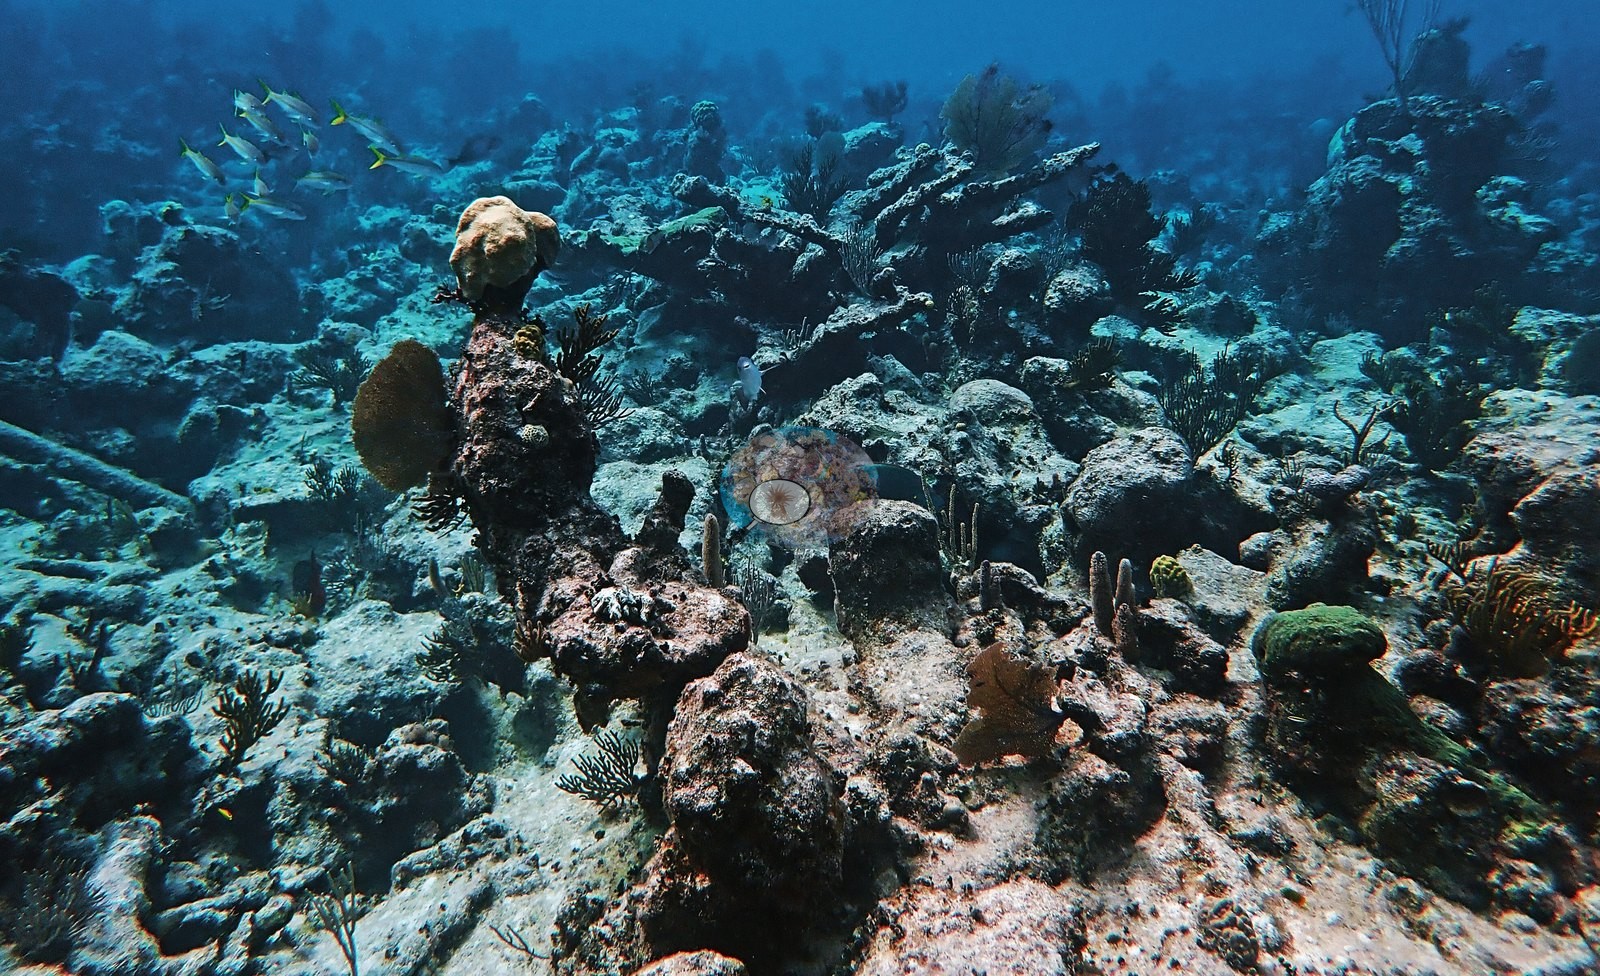
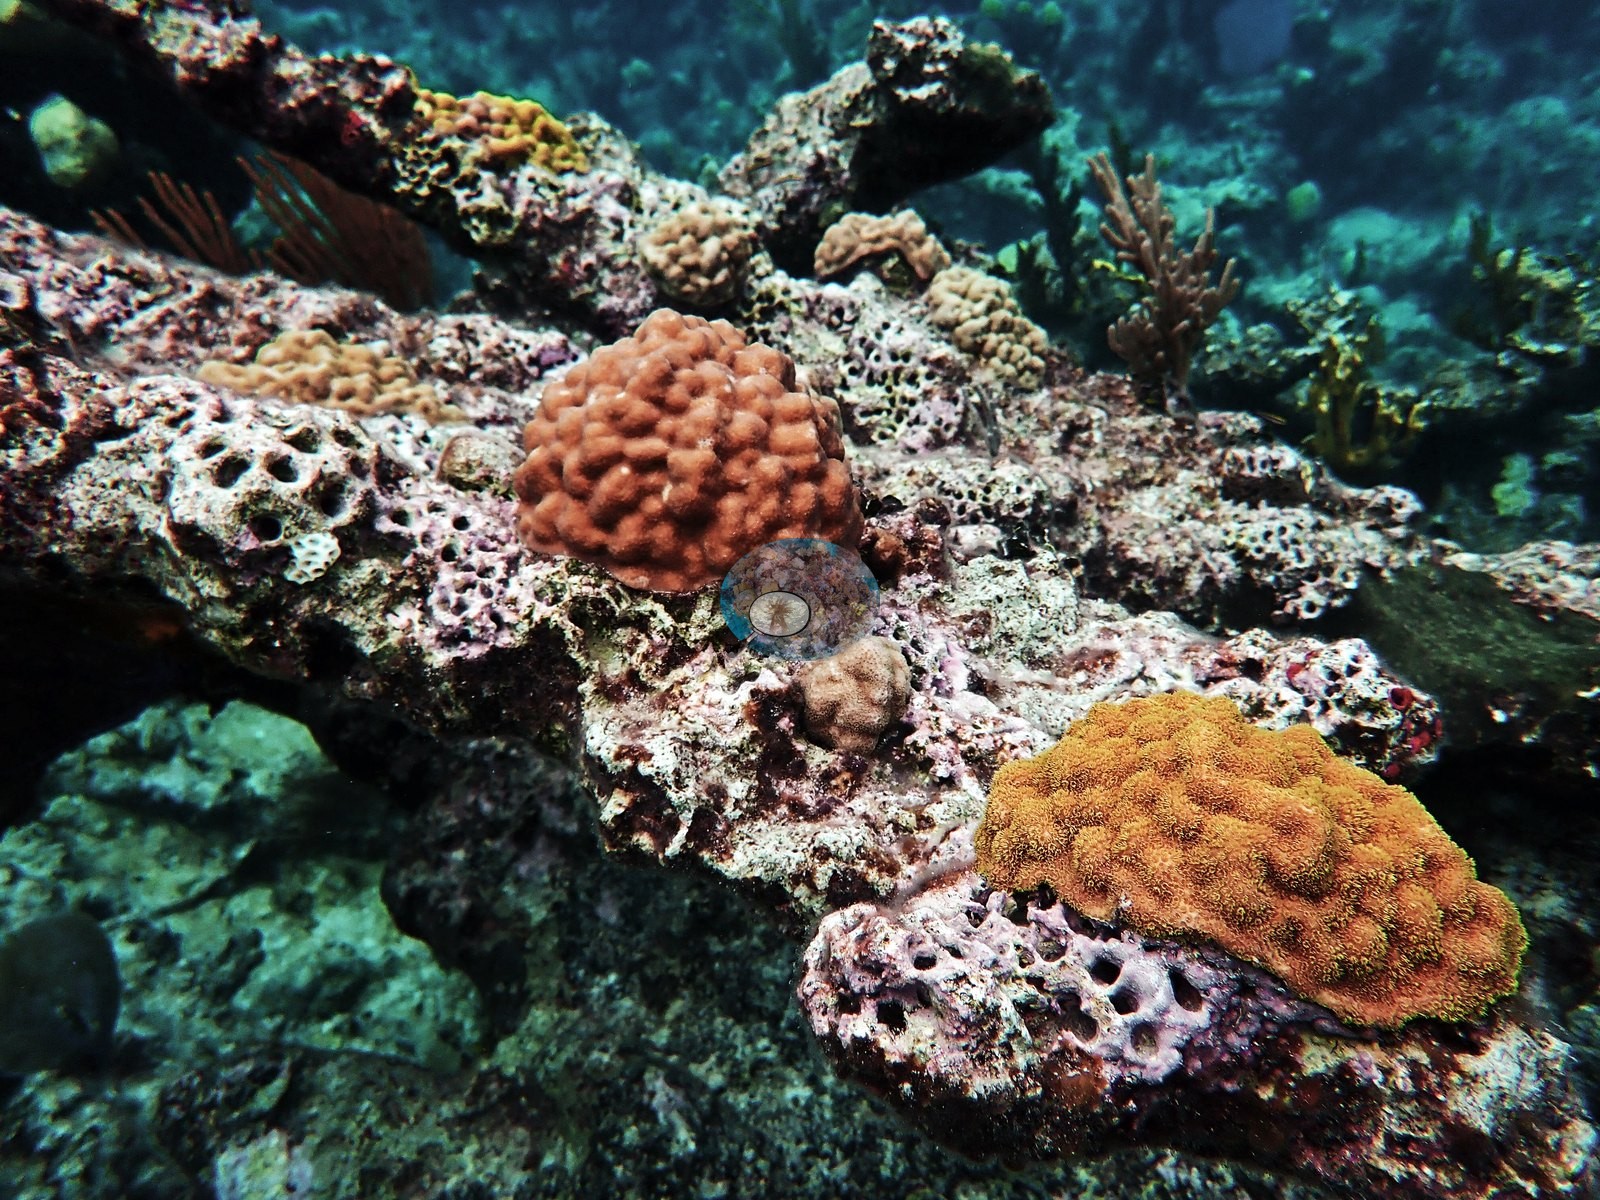
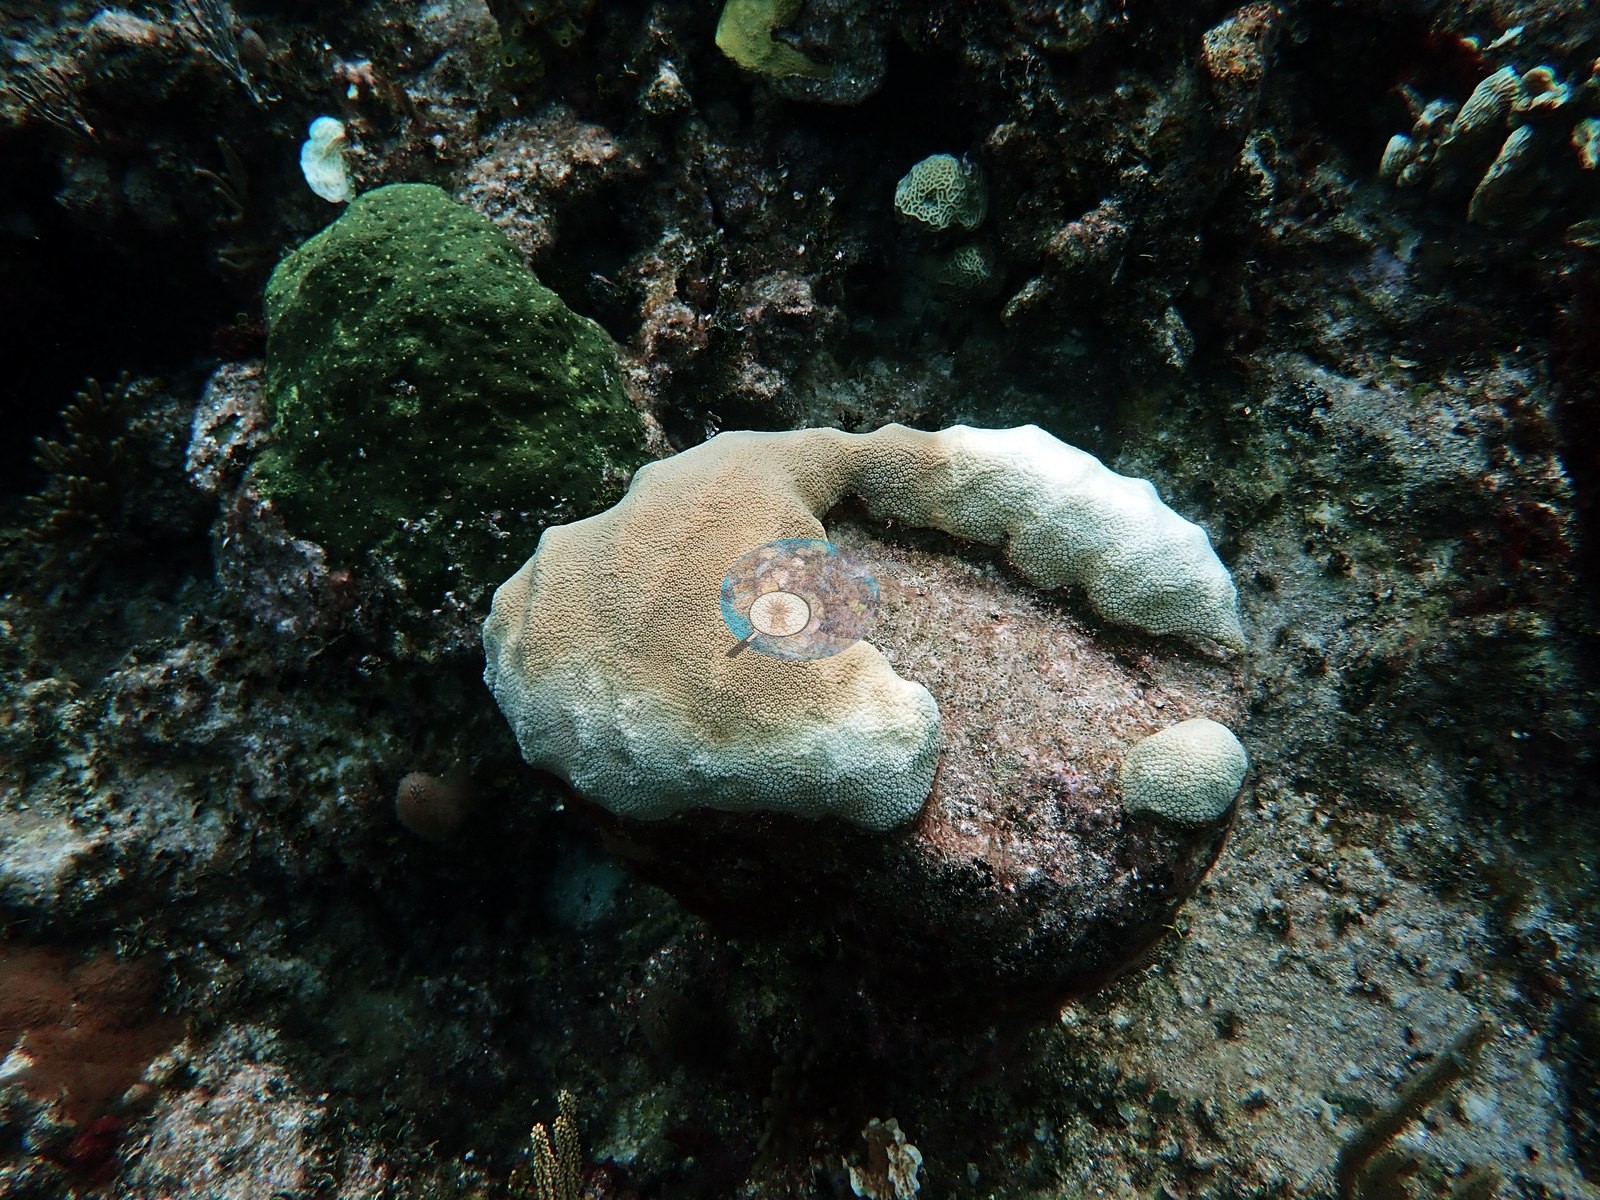
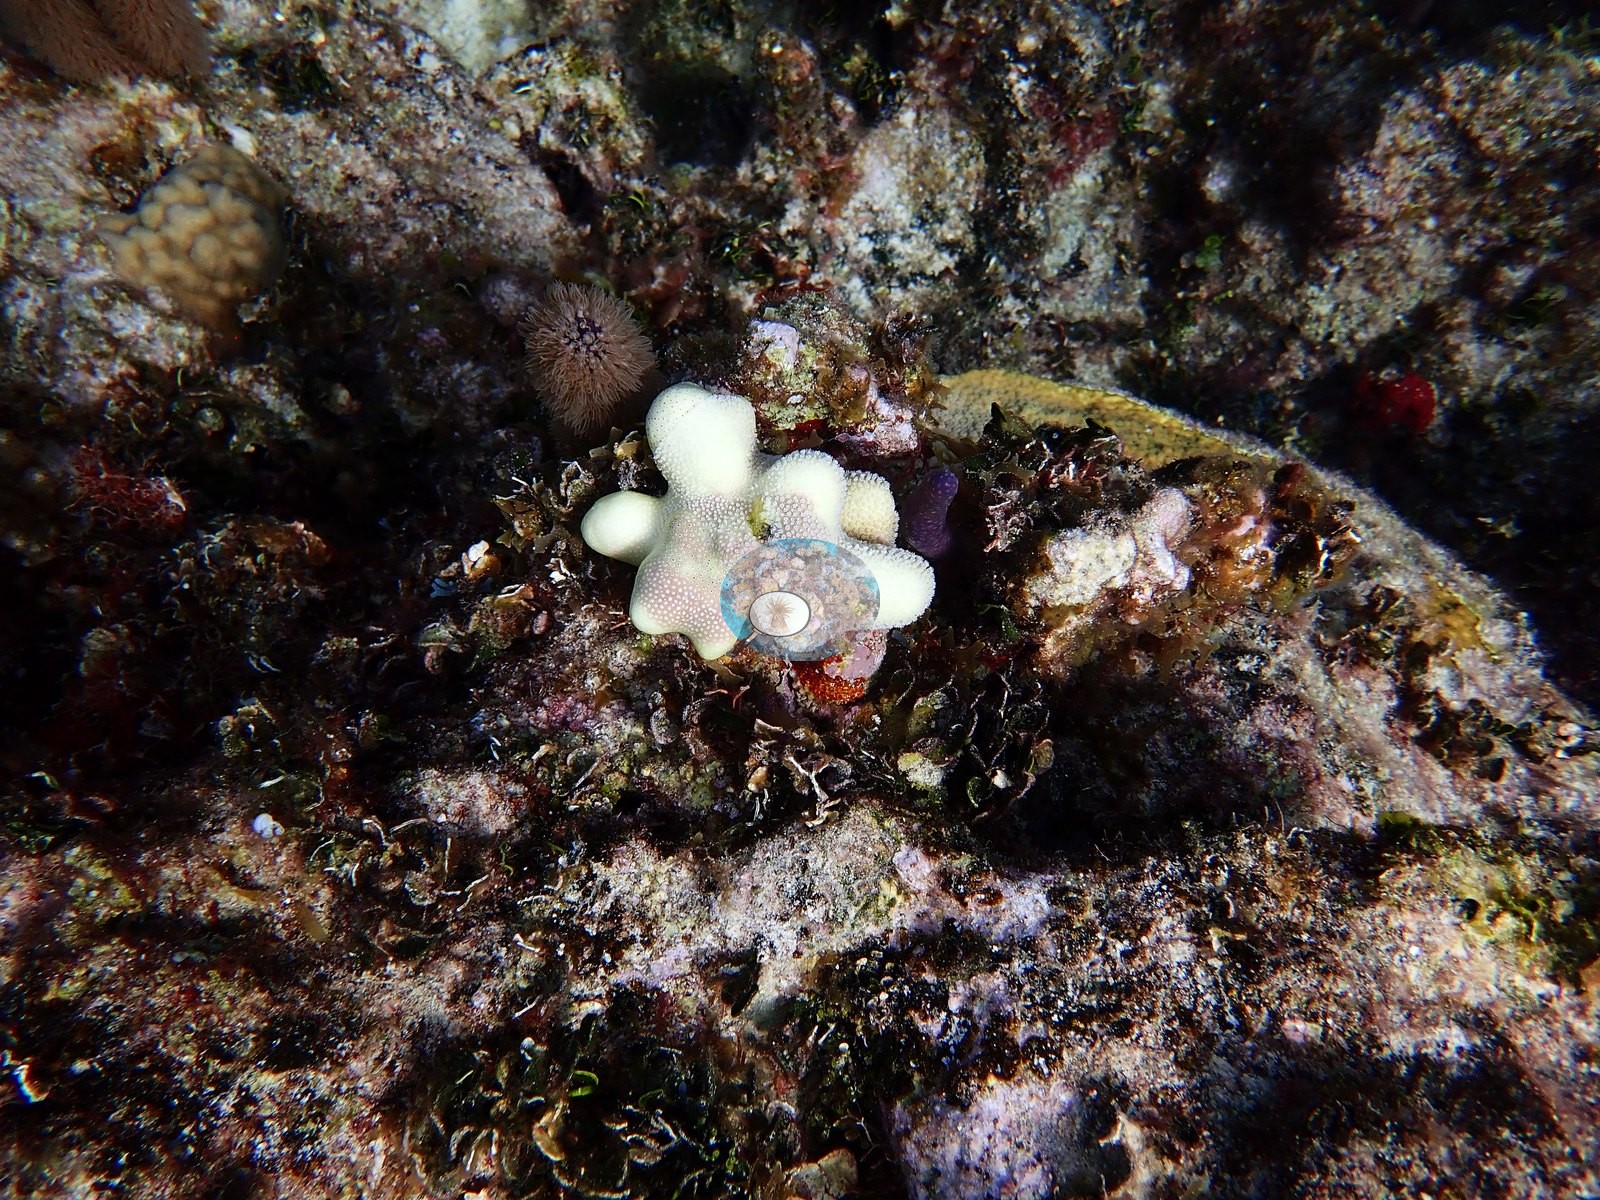
Image 86 and Image 117 are the starkest: whole thickets of intact but dead branching skeleton with nothing living on the branch surfaces. The condition signal is the main thing the full set adds. Wholly or partly white colonies appear in roughly a sixth of the frames, spread across the dive rather than clustered in one spot: whole white or cream massives (e.g., Image 13, Image 16, Image 17, Image 43, Image 89, Image 93, Image 110), white branching colonies (e.g., Image 8, Image 114), and - most telling - several large colonies split by a sharp, clean margin between normally pigmented tissue and stark white tissue on the same head (e.g., Image 28, Image 50, Image 64, Image 67).
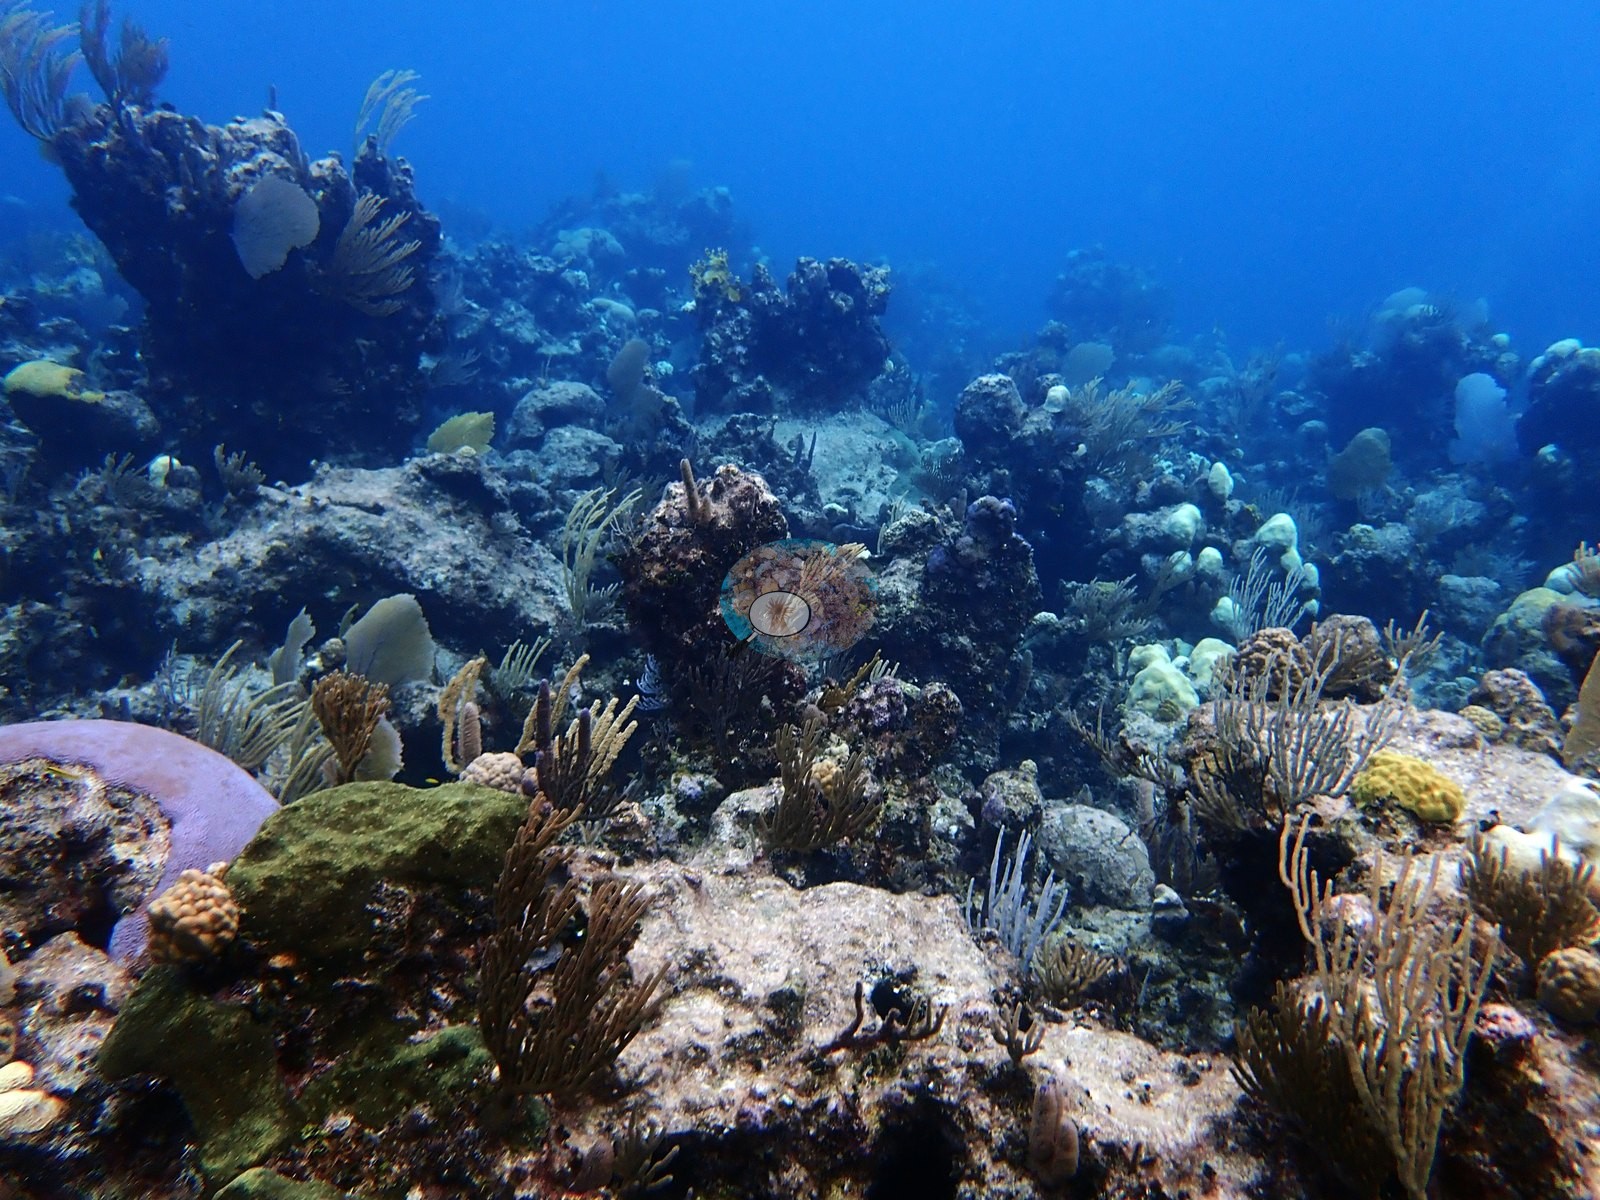
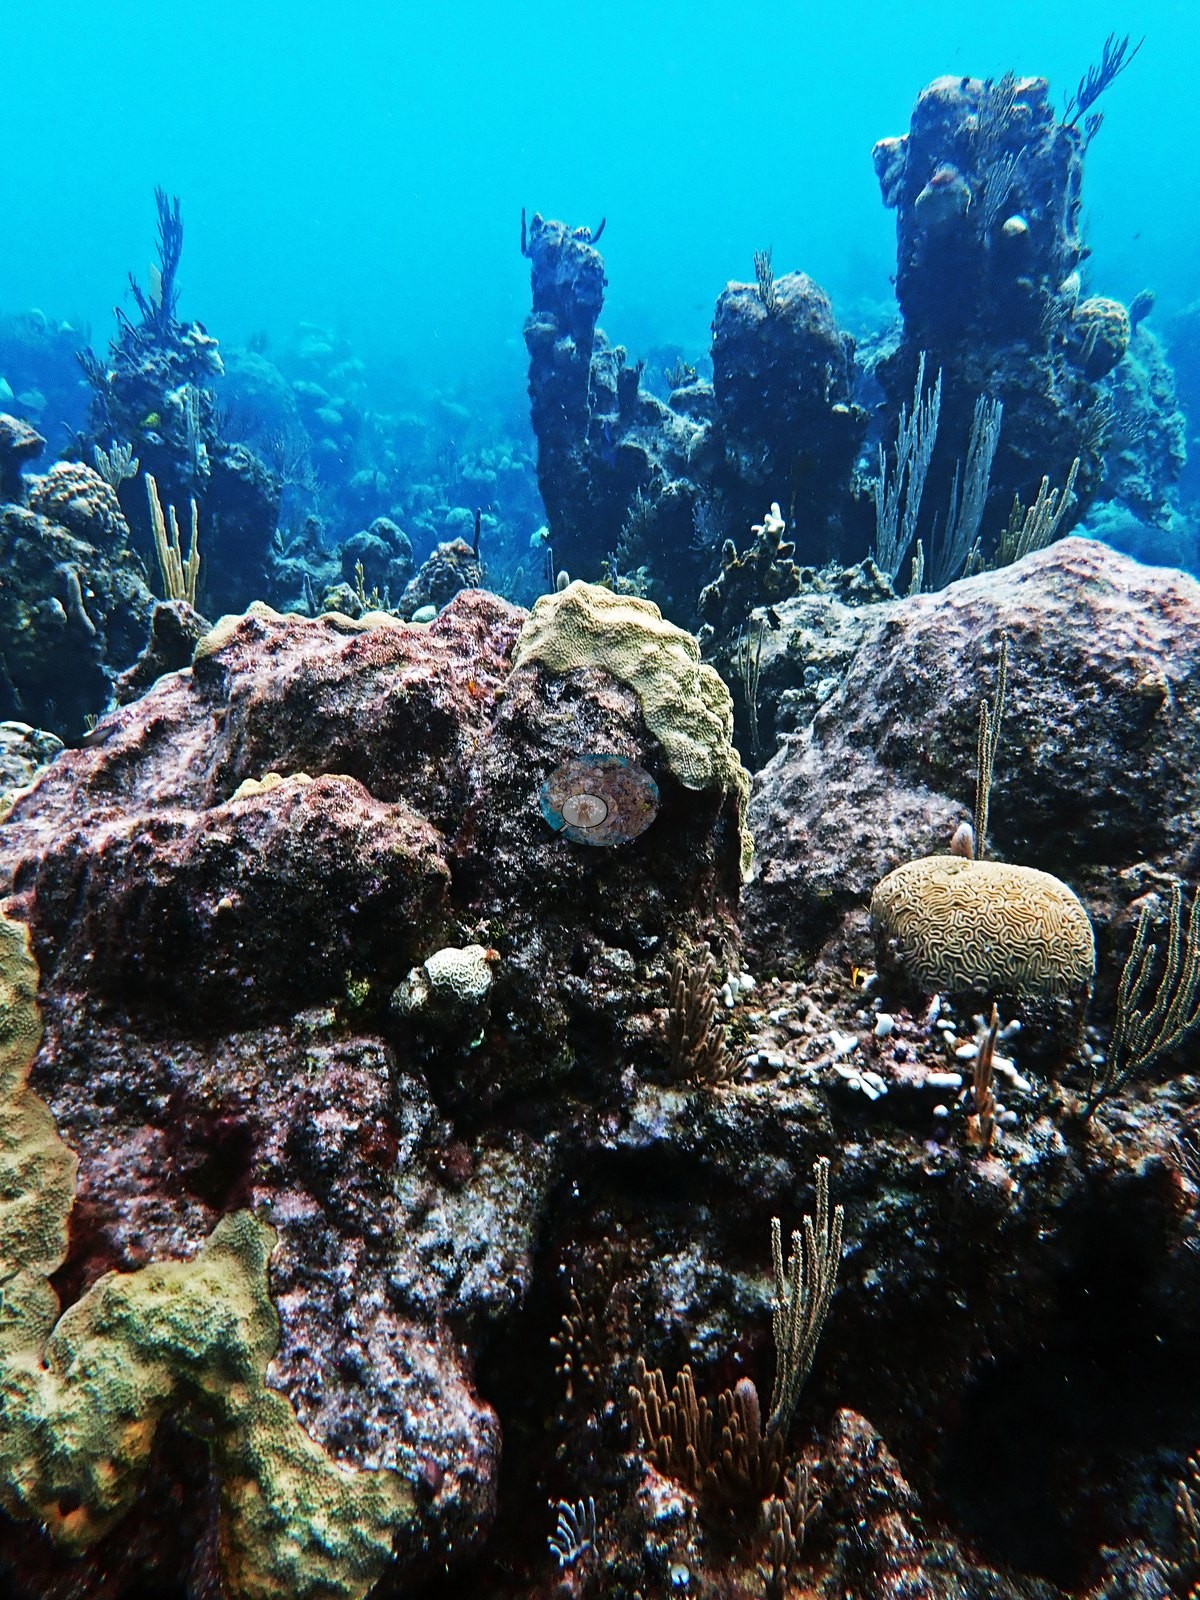
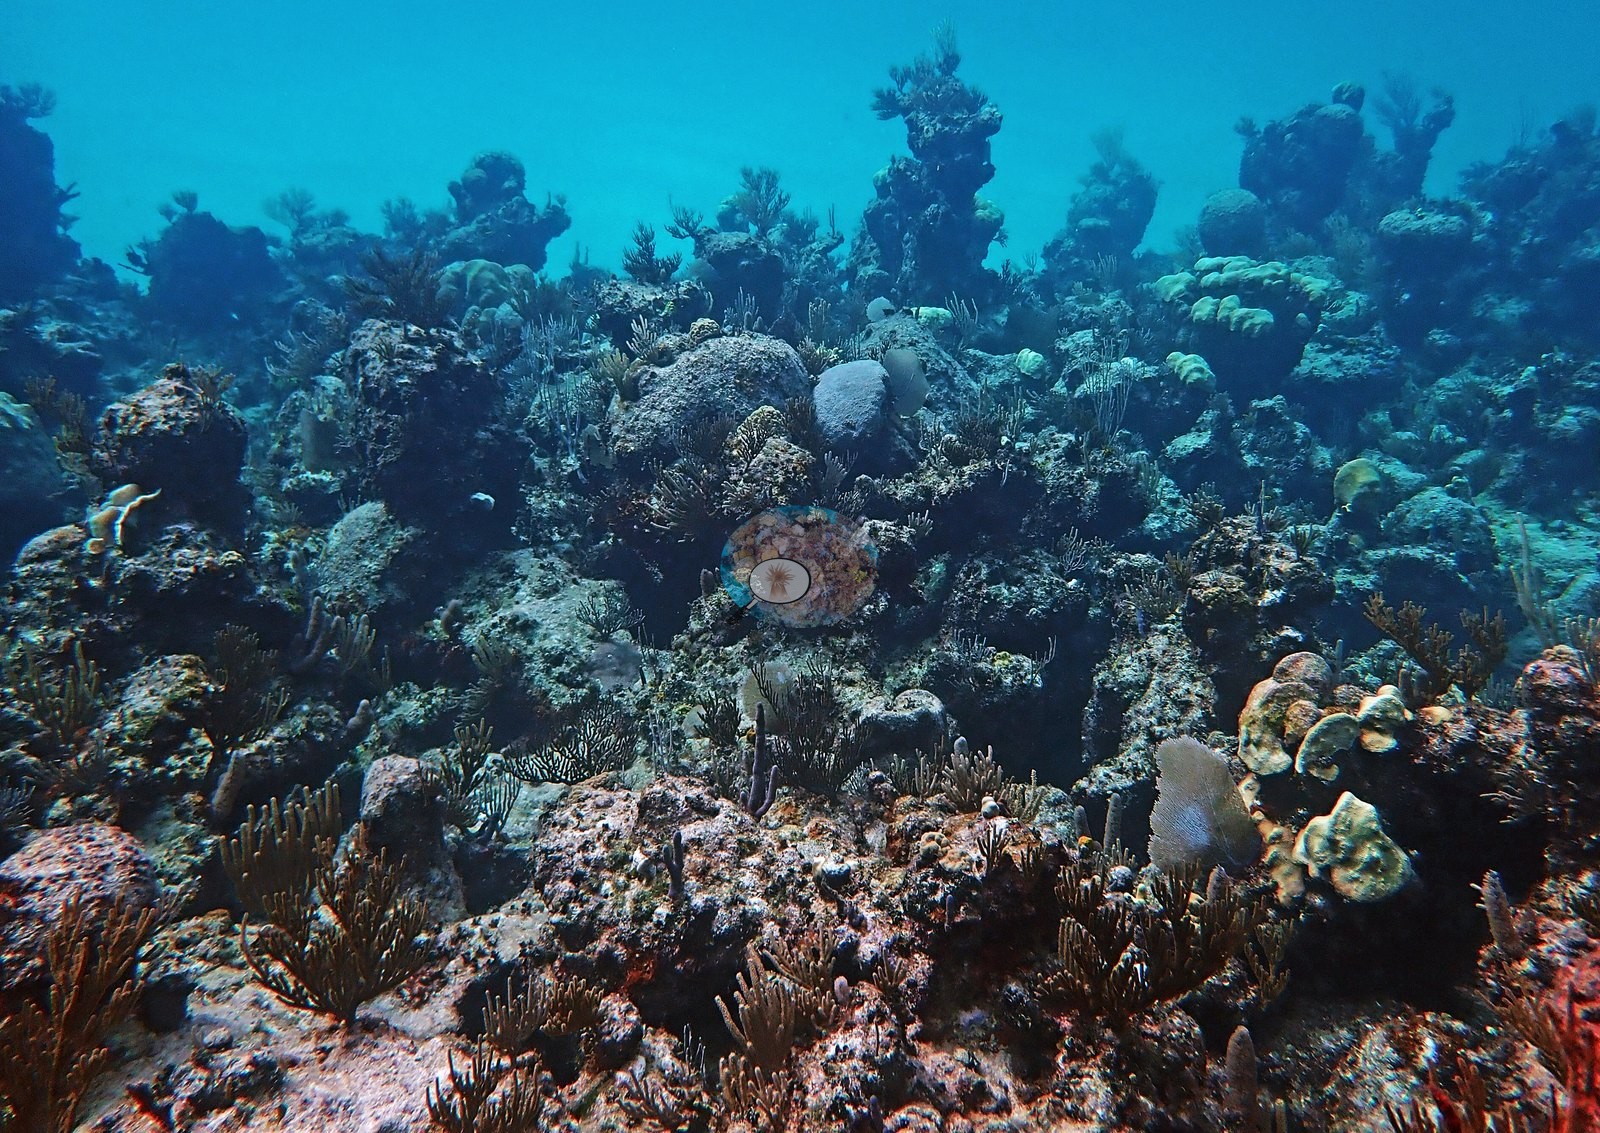
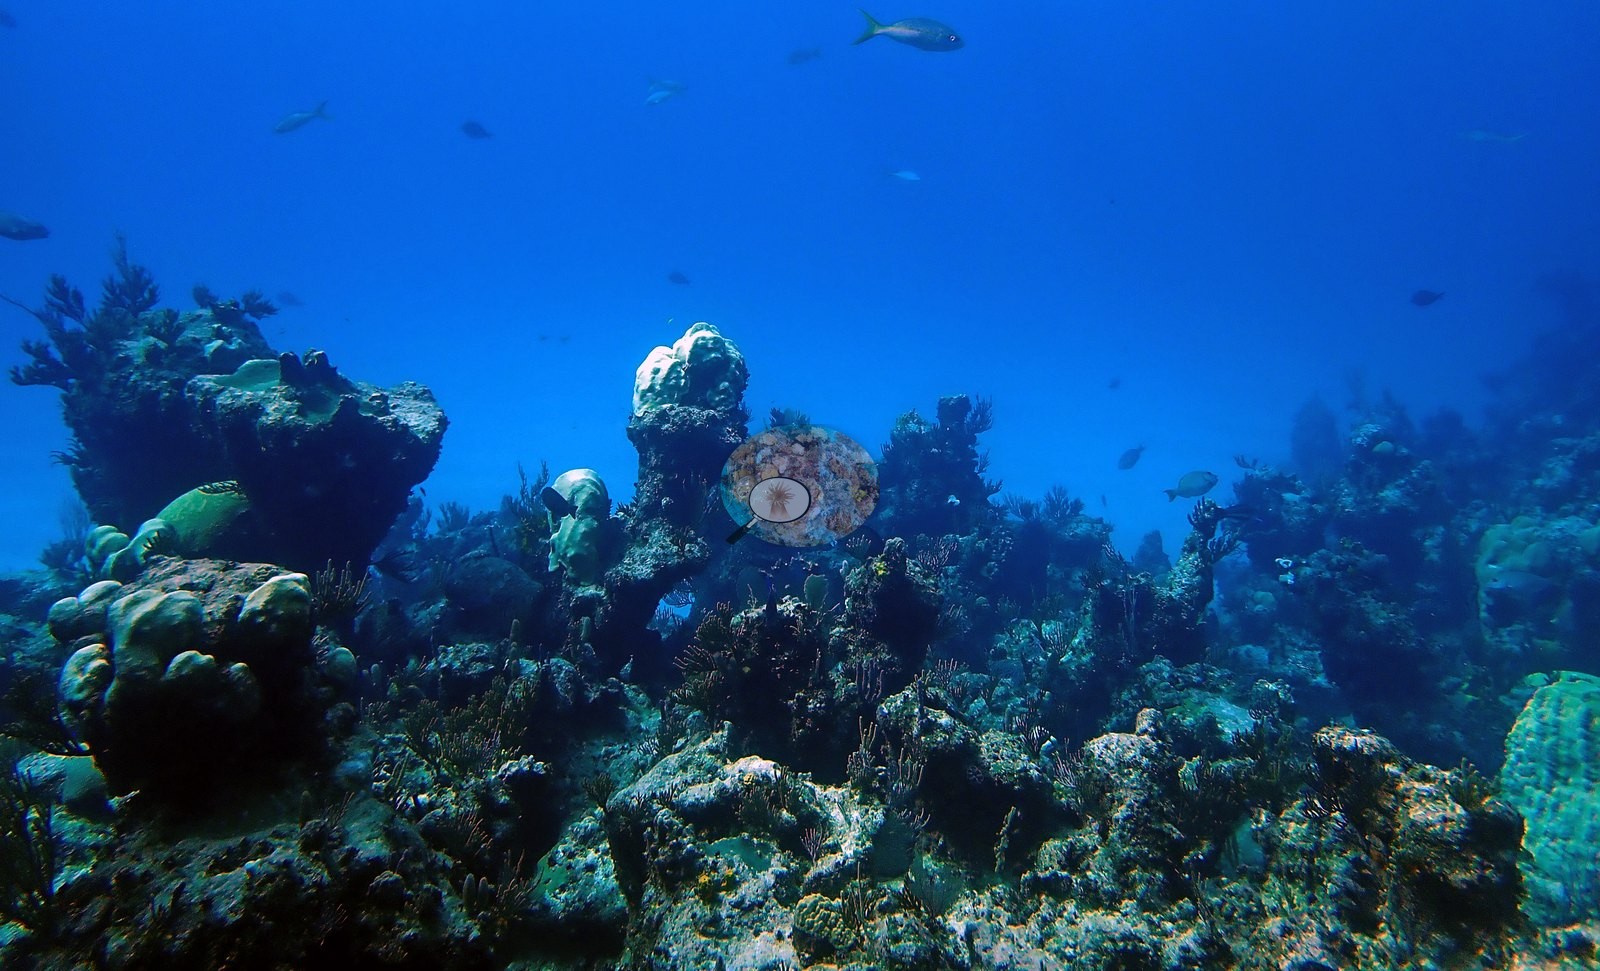
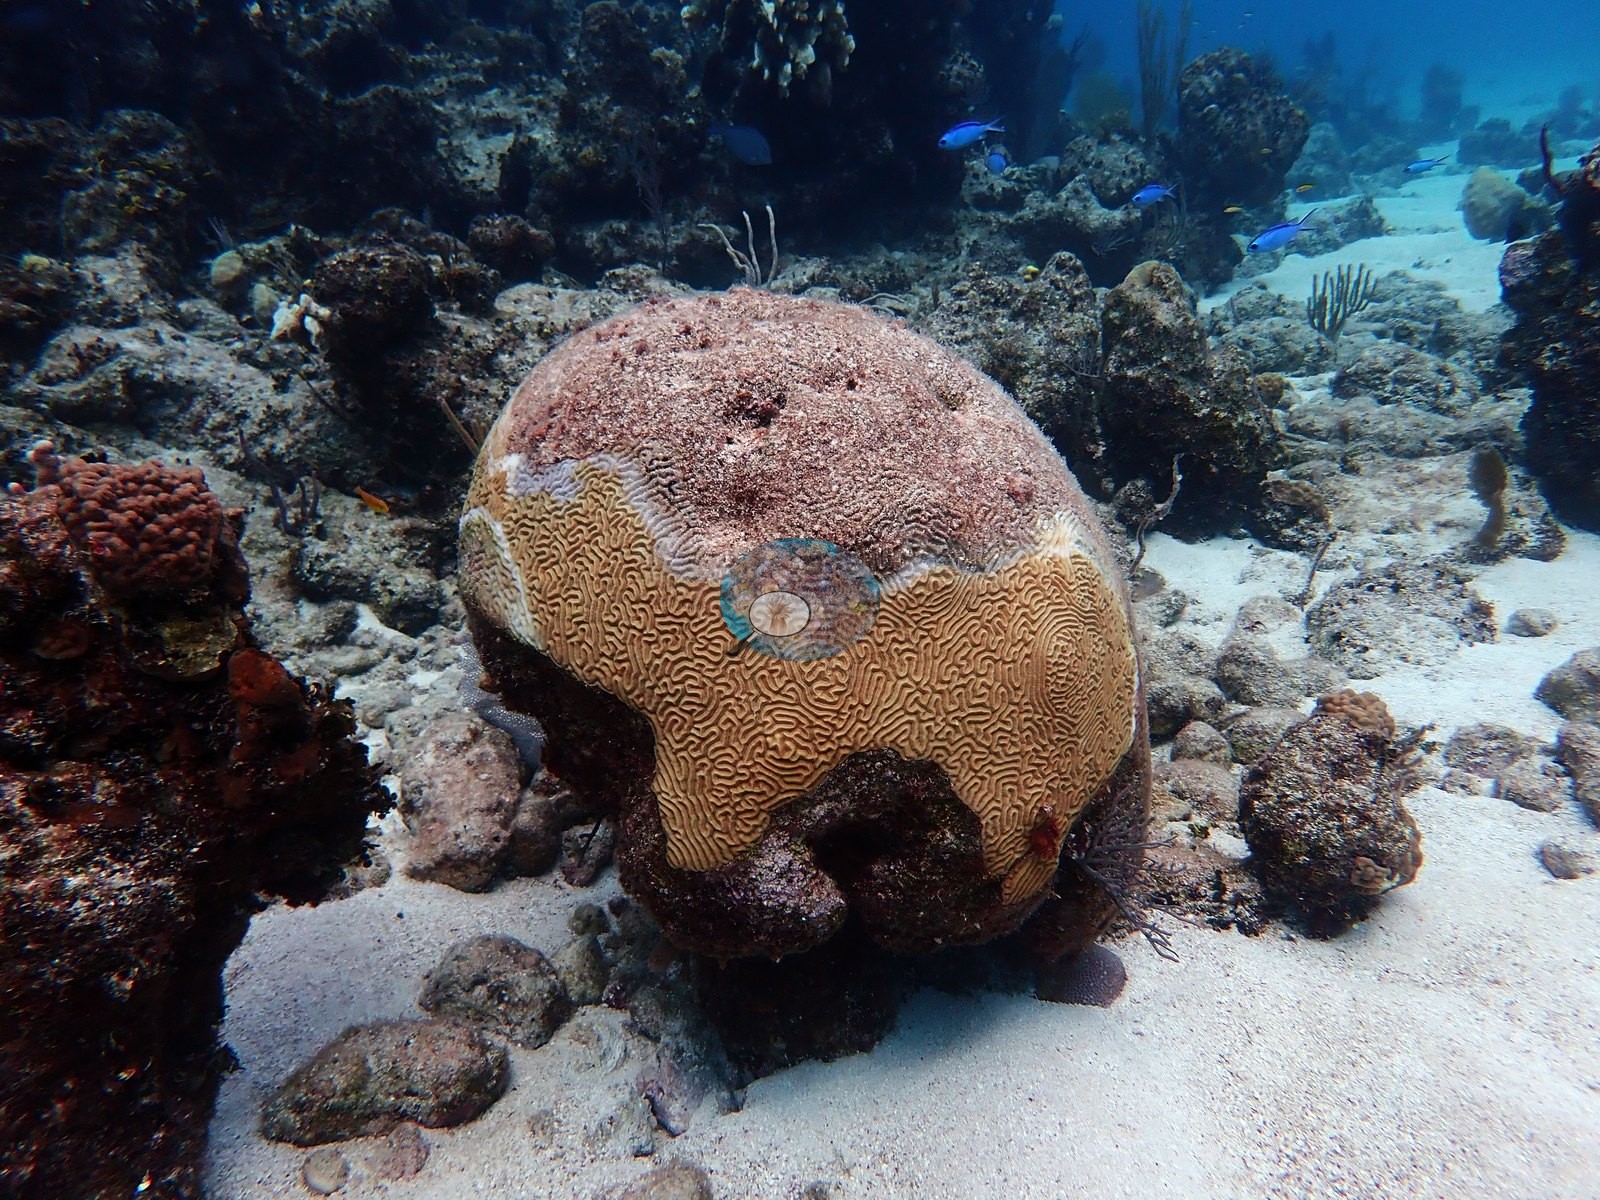
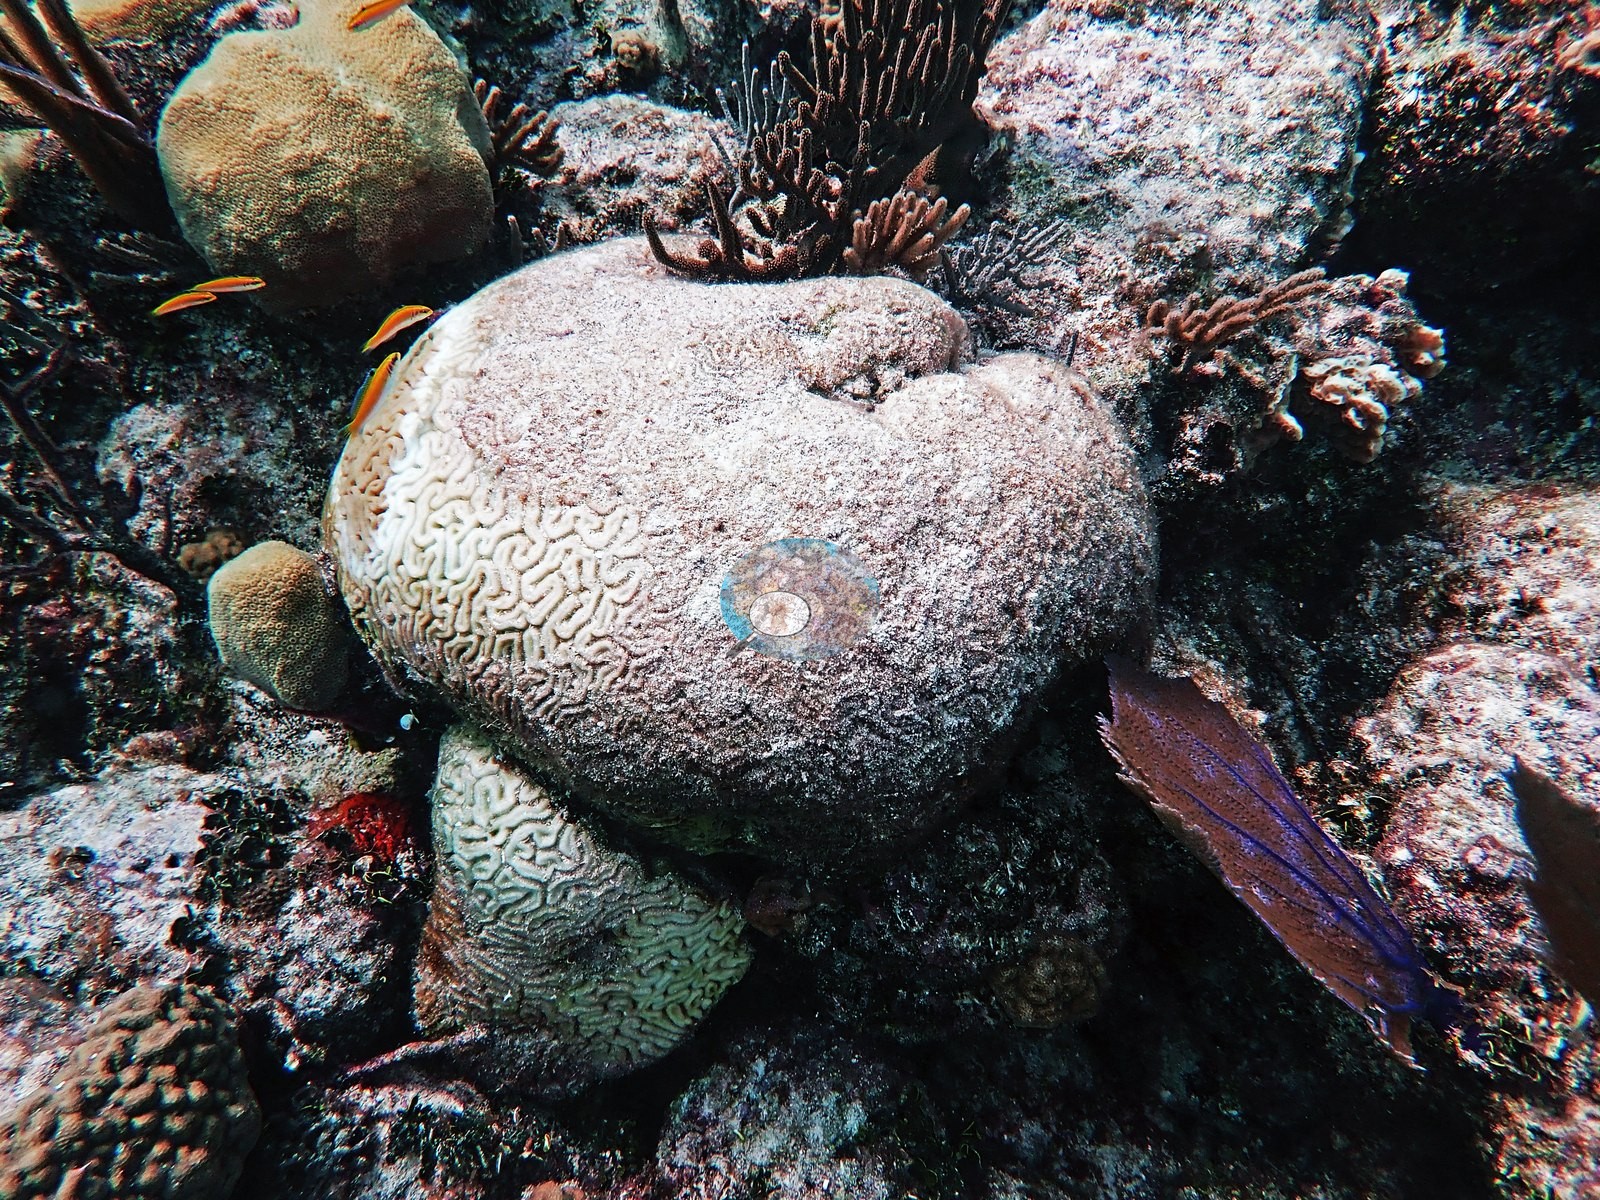
Anderson labeled two of these frames himself: "bleached Ofav" (e.g., Image 113) and "bleached Porites" (e.g., Image 114).
A third, "diseased Ofav" (e.g., Image 116), is his own disease call on a mounded colony with pale advancing tissue and exposed skeleton.
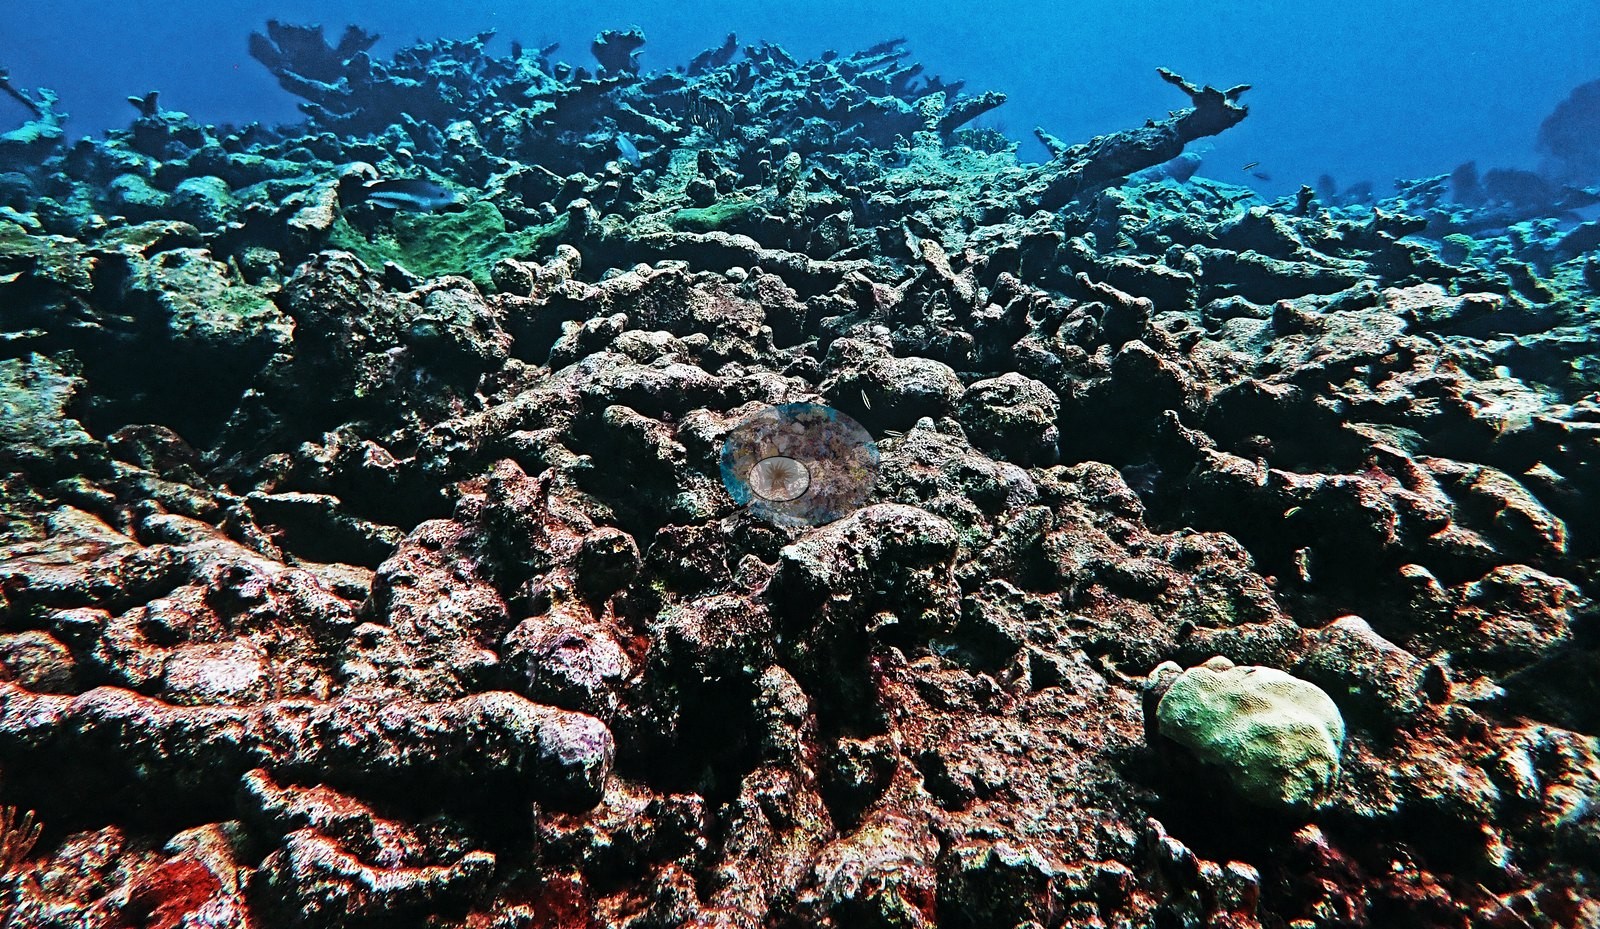
Alongside that, partial mortality with turf and algal colonization is common on otherwise living massives (e.g., Image 21, Image 32, Image 35, Image 93), and the extensive consolidated rubble fields and dead pavement between the spurs are old, fully crusted-over loss rather than anything recent (e.g., Image 4, Image 9, Image 18, Image 102, Image 103, Image 112).
No bleaching or mortality percentage is given here, and none should be read into these counts - they are frame counts from a photographic set, not a survey.
Fish and other fauna
Fish in frame are few and small: yellowtail snapper, blue chromis and small wrasses over the spurs (e.g., Image 52), the odd parrotfish and surgeonfish, and nothing resembling a large-bodied or predatory assemblage anywhere in 121 frames.
Comparisons with other data
No other surveys have been conducted at this site to date. Within 5 km, fourteen independent stations (AGRRA, Reef Check and XL Catlin Seaview Survey) recorded 0.7–23% hard coral cover between 2004 and 2019; the nearest, AGRRA at BBC, 1.04 km away, read 14–16% between 2011 and 2019.
Other notes
One finding stands out in the full edited set: the pale colonies are not incidental, they run right through the dive.
CV model comparison
More info
A few colony-focused photos raise the mean; the median is the typical photo. No computer-vision method yet estimates coral cover accurately on new images, so treat this as indicative rather than a measurement; it is revised as the methods improve.More info
DINOv3 and CoralSCOP were run on the same photos and are listed for comparison. Coralscapes v2 and v1 were also run but are not shown: the author does not consider Coralscapes reliable for these photos. No diver transect exists for this trip, so agreement between the rows is not accuracy, and no computer-vision method yet estimates coral cover accurately on new images; treat every row as indicative.| Method | Hard-coral cover (%) |
|---|---|
| CoralSCOP edited | 19.5 |
| Claude (edited photos) | 7.9 |
See a more detailed, stand-alone version of this table.
Independent surveys nearby
| Agency / program | Year(s) | Stations / distance | Link |
|---|---|---|---|
| AGRRA | 2008–2019 | 11 stations, 1.04–2.25 km | Records ↓ |
| Reef Check | 2004–2010 | 2 stations, 1.06–1.17 km | Records ↓ |
| XL Catlin Seaview Survey | 2013 | 1 station, 4.62 km | Records ↓ |
 Coral Reef Diagnostics
Within 5 km, 14 independent survey stations recorded hard coral cover in 29 records between 2004 and 2019. Of the 6 stations surveyed in more than one year, 1 declined, 1 increased, and 4 changed by less than 5 percentage points between their first and latest surveys. The longest record, Willaurie (AGRRA, 1.23 km away), went from 13% in 2011 to 21% in 2019. The most recent nearby survey is from 2019, so these values predate recent heat stress. This site's own estimate (7.9%) sits within the range of these surveys (0.7–23%); the methods differ, so the comparison is context, not a like-for-like test.
Collected by other programs using different methods (Reef Check uses point-intercept transects; AGRRA uses benthic point-intercept transects, reported here as live coral cover; the XL Catlin Seaview Survey uses photo-transects with automated image annotation), so these are context for the figures above, not a like-for-like comparison. Where a station was surveyed more than once the range is shown. Station names are not dive-site names.
Show all 14 independent survey records
| Agency | Site / location | Date | Hard coral cover (%) | Distance | Link |
|---|---|---|---|---|---|
| Reef Check | Goulding Cay Reef | 2004 | 8.8% | 1.06 km | — |
| AGRRA | — | 2008 | 11% (5 surveys) | 1.07 km | — |
| Reef Check | Goulding Cay | 2010 | 5.6% | 1.17 km | — |
| AGRRA | BBC | 2011–2019 | 14–16% (2 surveys) | 1.04 km | — |
| AGRRA | Willaurie | 2011–2019 | 13–21% (4 surveys) | 1.23 km | — |
| AGRRA | Elkhorn Garden | 2011–2019 | 10–14% (3 surveys) | 1.36 km | — |
| AGRRA | Nari Nari | 2011–2019 | 5.8–10% (3 surveys) | 1.62 km | — |
| AGRRA | Clifton Wall | 2011–2019 | 9.4–23% (3 surveys) | 1.83 km | — |
| AGRRA | Tunnel Wall | 2011–2019 | 4.2–7.0% (2 surveys) | 2.25 km | — |
| XL Catlin Seaview Survey | transect 24013 | 2013 | 0.7% | 4.62 km | doi:10.14264/uql.2019.930 |
| AGRRA | NariNari | 2016 | 3.8% | 1.62 km | — |
| AGRRA | Sand Chute | 2019 | 13% | 1.23 km | — |
| AGRRA | Bond Reef | 2019 | 12% | 1.28 km | — |
| AGRRA | Wreck on the Wall | 2019 | 17% | 1.37 km | — |
Data & links
All images from Coral Reef Diagnostics. Data are from Coral Reef Diagnostics and the organizations named in the data sources above.
© Coral Reef Diagnostics.